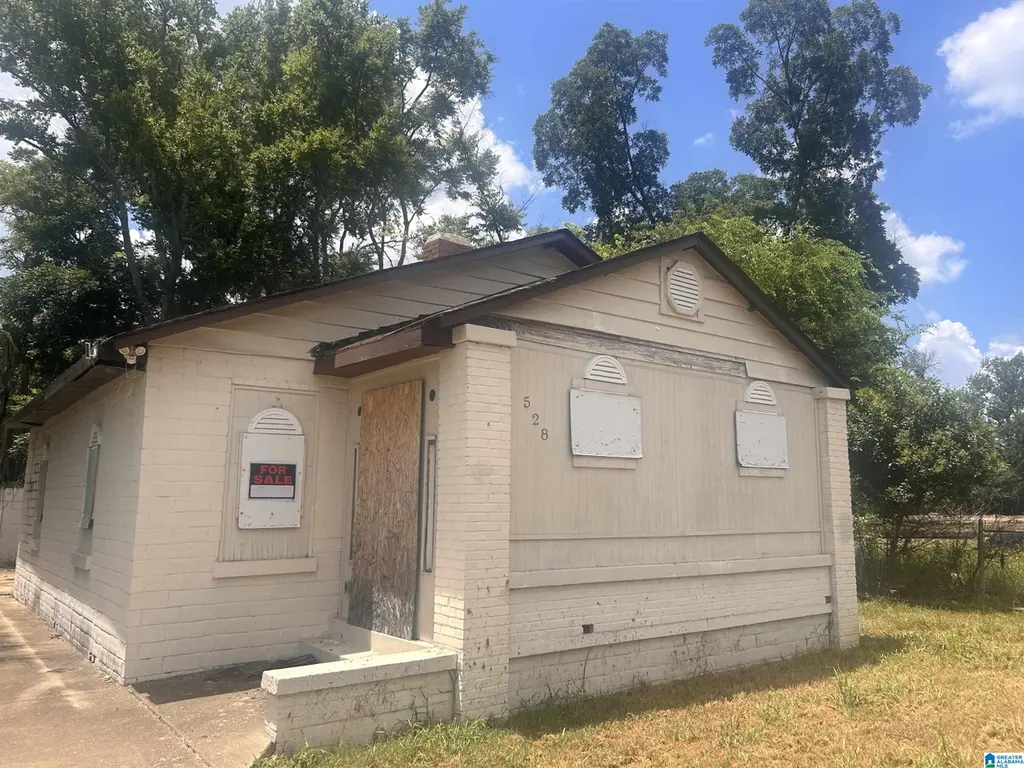
528 1st St SW · Birmingham, AL
Flood risk 5/10 · Moderate
- FEMA flood zone
- AE
- Chance of flooding over 30 yrs
- 0.24%
- Est. flood insurance / yr
- $1,737 – $8,500
Fire risk 1/10 · Minimal
- Est. fire insurance / yr
- $916 – $1,700
Heat risk 7/10 · Major
- Hot days now (above 106°F)
- 7 days/yr
- Hot days in 30 yrs
- 19 days/yr
Wind risk 6/10 · Moderate
- Chance of severe wind over 30 yrs
- 27.0%
Air-quality risk 4/10 · Minor
- Unhealthy air days now
- 6 days/yr
- Unhealthy air days in 30 yrs
- 8 days/yr
Risk factors via First Street. Map © Google.
Why this score? — see what drove the D grade
The composite is a weighted blend of 9 inputs, each scored 0–100. Each bar is that input's sub-score; the figure is the points it added to the 100-point composite (weight × sub-score).
- Cash flow +15.0/30.0
- ARV discount +7.5/15.0
- 1% rule +5.0/10.0
- DSCR +5.0/10.0
- Livability +3.4/5.0
- Rent growth +2.5/5.0
- Condition / age +2.5/5.0
- Schools +0.9/10.0
- Appreciation +0.0/10.0
$18,000
🖨 Deal sheet 📄 Offer letter ✓ Due diligence
Listing remarks MLS
TRANSFER OF TAX INTEREST ONLY -- Great investment opportunity to own this partially gutted property and transform it how you like. Currently zoned R5 on a large corner!! Possibilities are endless!! MAKE YOUR BEST OFFER BEING SOLD "AS IS" ----CASH ONLY---
Key facts
- 9,583 sq ft lot
- Built 1930
- Listed 255 days
Neighborhood map
What this means for you Summary
Snapshot
- This is a 2-bed/1.0-bath single-family listed at $18k.
Deal economics
- At list price, monthly cash flow is $288 ($3k/yr) — positive.
- The deal already cash-flows at list — no discount required.
- Meets the 1% rule at list price ($1k rent vs $18k).
- Recommended offer: $16k (12.0% below list) — sets the bar for market timing.
- Cap rate 54.0% vs local median 6.2% in Birmingham — top-decile yield for the area; either an underpriced asset or a hidden risk that comps aren't pricing in. Stress-test before assuming the spread holds.
Location & tenants
- Location reads 67/100 on livability (#78 in AL) — a middle-class / working-renter tenant base. Strengths: commute A+, cost of living A+, housing A+; Watch: amenities C-, schools F, crime F.
- Birmingham City (urban): math 4% / reading 20% proficiency, ranked #116 of 129 in AL (top 90%) — low school quality limits family demand, transient renter base, plan for 1-2y turnover; 82% free/reduced lunch — lower-income household profile, screen leases tightly.
- Market conditions: Rents soft (-0.0%/yr); 152 active listings in the ZIP; 40 comparable units currently listed for rent nearby; rentals lingering (median 44d on market — plan ~5-8 weeks vacancy on turnover, expect pricing pressure); 55% of comp listings sitting > 30 days — soft ceiling on asking rent; lower-income renter base — watch delinquency; 2,114 units permitted in Jefferson County in 2024 (556 in 5+ unit buildings).
- This rent runs 37% of the median local income ($35k/yr) — at the standard rent-burdened threshold; future hikes will face affordability resistance.
Forward outlook
- Local home prices are declining (-3.0%/yr); year-one equity from $124 of loan paydown is wiped out by about $540 of value loss. Plan a longer hold.
- Jefferson County population projected to shrink 4% by 2050 — rents likely to lag national; underwrite the cash flow, not the appreciation.
- At projected returns (-3.0% appreciation + 0.0% rent growth), your $5k cash investment doubles in ~2 years — after that, you're playing with house money.
Negotiation context
- It's been on market 255 days — a 12% lower offer ($16k) is reasonable based on typical stale-listing flexibility.
Risks & watch-outs
- Watch-outs: flood insurance adds $427/mo; built in 1930 — expect roof / HVAC / electrical / plumbing capex.
- Climate carrying-cost: in FEMA flood zone AE (mandatory federal flood insurance); major wind risk, 27% chance of damaging wind over 30y; extreme-heat days projected 7→19/yr by 2055 (HVAC capex compounding) — expect insurance premiums to compound above CPI over the hold.
Questions for the listing agent
- It's been on market 255 days. Have you received any prior offers? Is the seller open to a 12% concession, seller financing, or rate buy-down credit?
- Built in 1930 — when were the roof, HVAC, electrical panel, plumbing, and water heater last replaced?
- What's the actual annual flood-insurance premium (NFIP or private), and is the property in a SFHA with mandatory coverage?
- Why hasn't it sold? Are there any deal-killer items the seller is aware of (foundation, flood, title, zoning, code violations)?
- Is there a deadline driving the sale (1031 exchange, divorce, estate, relocation)? That informs how much negotiation room exists.
- Schools are F-rated, which usually means shorter tenancies and higher turnover. Who's the typical renter profile here, and what's been the actual vacancy rate?
- Crime grade is F in this area — have there been break-ins, vandalism, or insurance claims at this property in the last 3 years? What carrier currently insures it and at what premium?
- The area grade is low — what's the realistic commute time and amenity access for the typical tenant pool here? Any planned neighborhood developments (good or bad) we should know about?
- What's the average days-on-market for RENTAL listings here right now (not sales)? A rising rental-DOM trend means longer vacancies and softer asking-rent achievability than the comps imply.
- What's the recent tenant-quality profile in this submarket — average credit score on applications, eviction rate, late-payment / NSF rate, and stable-employment percentage? A property-management company in the area should have these aggregated.
- How much new for-sale + rental construction is in the pipeline within 1–3 miles? Heavy new supply typically softens prices + rents 12–24 months out; constrained supply supports both.
Investment metrics
- 1% rule
- 5.96% ✓
- Cap rate
- 53.96%
- Cash-on-cash
- 170.24%
- DSCR
- 8.57
- GRM
- 1.4
CMA / ARV
- ARV (median comp)
- $53,598
- List price
- $18,000
- Delta
- -66.42%
- Verdict
- UNDERPRICED
- Comps
- 20 within 1.0 mi
Show comp detail 7 sales within ~0.75 mi
| Address | Dist | Beds/Ba | Sqft | Sold | Price | $/sf | Match |
|---|---|---|---|---|---|---|---|
| 446 1st St N | 0.39mi | 2/1.0 | 1,034 (-1%) | 13mo | $75,000 | $73 | 70 |
| 112 Kappa Ave S | 0.51mi | 3/1.0 (+1) | 1,034 (-1%) | 7mo | $25,000 | $24 | 64 |
| 310 S Center St | 0.19mi | 3/1.0 (+1) | 1,107 (+6%) | 20mo | $97,000 | $88 | 60 |
| 719 Washington Ave SW | 0.63mi | 3/1.0 (+1) | 1,064 (+2%) | 13mo | $40,000 | $38 | 51 |
| 216 S 3rd Ave | 0.68mi | 3/1.0 (+1) | 1,143 (+10%) | 2mo | $75,000 | $66 | 46 |
| 41 1st Ave S | 0.51mi | 2/1.0 | 958 (-8%) | 24mo | $20,000 | $21 | 43 |
| 503 4th Ct W | 0.47mi | 3/1.0 (+1) | 1,178 (+13%) | 16mo | $15,000 | $13 | 39 |
Match score weights: distance 35% · size 25% · config 20% · recency 20%. Top-matched comps best support the ARV.
Projected returns pro-forma
-3.0% appreciation · 0.0% rent growth · sell at horizon
- IRR
- 61.5%
- Equity multiple
- 3.50×
- Total profit
- $12,595
- Equity at exit
- $2,684
- IRR
- 64.0%
- Equity multiple
- 5.69×
- Total profit
- $23,626
- Equity at exit
- $1,556
Cash invested: $5,040 (down + closing). Projections, not guarantees.
Landlord ↔ Tenant lean methodology
- Overall (STATE)
- 90 Strongly Landlord-Friendly
- State Alabama
- 90 Strongly Landlord-Friendly · R+15
- County
- — inherits STATE
- City
- — inherits STATE
ZIP-level market 35211
- Rents YoY
- -0.0%
- Active inventory
- 152
- Price-to-rent
- 1.4×
Monthly cashflow live
- Estimated rent
- $1,073 high interval (Pro) →
- Mortgage (P&I)
- −$94
- Tax from tax record
- −$31 /mo · $367/yr
- Insurance
- −$8
- Flood insurance flood zone
- −$427 /mo · $5,118/yr
- HOA
- −$0
- Vacancy / Maint / Mgmt
- −$225
- Net cashflow
- $288
Break-even live
UW: 25.0% down · 7.5% · 30yr · 1.5% tax · 5.0% vac · 8.0% maint · 8.0% mgmt
Financing live
Cash to close
- Down payment
- $4,500
- Closing costs
- $540
- Reserves months
- —
- Total cash needed
- —
Loan-product check · same deal, 3 products live
Conventional
25% down · 7.5% · 30yr
- Down + closing
- —
- Monthly P&I
- —
- Monthly cashflow
- —
- DSCR
- —
- Eligible?
- —
Personal DTI + credit; lowest rate.
DSCR
20% down · 8.5% · 30yr
- Down + closing
- —
- Monthly P&I
- —
- Monthly cashflow
- —
- DSCR
- —
- Eligible?
- —
No personal income docs; deal must DSCR.
Hard money
10% down · 12.0% · 12mo
- Down + closing
- —
- Monthly P&I
- —
- Monthly cashflow
- —
- DSCR
- —
- Eligible?
- —
Short-term bridge; refi at stabilization.
Rent comps 40 comps
| Address | Beds | Baths | Sqft | Rent | $/sqft | DOM | Units | Dist |
|---|---|---|---|---|---|---|---|---|
| 413 Fulton Ave SW Birmingham, AL | 3.0 | 1.0 | 940 | $525 | $0.56 | 3d | 1 | 0.31mi |
| 608 Fulton Ave SW Birmingham, AL | 3.0 | 1.0 | 1271 | $1,300 | $1.02 | 44d | 1 | 0.47mi |
| 112 Kappa Ave S Birmingham, AL | 3.0 | 2.0 | 1034 | $1,100 | $1.06 | 44d | 1 | 0.49mi |
| 644 Alabama Ave SW Birmingham, AL | 3.0 | 1.0 | 1274 | $1,125 | $0.88 | 24d | 1 | 0.58mi |
| 624 4th Ct W Birmingham, AL | 3.0 | 1.5 | 992 | $1,250 | $1.26 | 44d | 1 | 0.63mi |
| 719 Washington Ave SW Birmingham, AL | 3.0 | 1.0 | 1064 | $950 | $0.89 | 12d | 1 | 0.63mi |
| 12 4th Ave SW Unit 1 Birmingham, AL | 3.0 | 1.0 | 1336 | $1,100 | $0.82 | 44d | 1 | 0.69mi |
| 724 4th Ct W Birmingham, AL | 3.0 | 1.0 | 1300 | $930 | $0.72 | 44d | 1 | 0.71mi |
| 261 3rd Ave SW Birmingham, AL | 1.0–2.0 | 1.0 | 634 | $850 | $1.34 | 3d | 14 | 0.75mi |
| 617 7th St W Birmingham, AL | 3.0 | 1.5 | 1120 | $1,175 | $1.05 | 44d | 1 | 0.76mi |
| 310 Gamma St S Birmingham, AL | 3.0 | 1.5 | 1001 | $1,200 | $1.20 | 16d | 1 | 0.82mi |
| 410 8th Ter W Birmingham, AL | 3.0 | 1.0 | 1440 | $1,200 | $0.83 | 16d | 1 | 0.83mi |
| 908 4th Ave W Birmingham, AL | 2.0 | 1.0 | 700 | $745 | $1.06 | 24d | 1 | 0.86mi |
| 827 6th Ave W Birmingham, AL | 3.0 | 1.0 | 1214 | $1,075 | $0.89 | 24d | 1 | 0.88mi |
| 313 Beta St S Unit 317A Birmingham, AL | 2.0 | 1.0 | 850 | $799 | $0.94 | 2d | 1 | 0.91mi |
| 1012 Cotton Ave SW Birmingham, AL | 3.0 | 1.0 | 1232 | $1,000 | $0.81 | 44d | 1 | 0.91mi |
| 506 Alpha St S Birmingham, AL | 3.0 | 1.0 | 944 | $1,373 | $1.45 | 44d | 1 | 0.93mi |
| 1000 4th Ave W Unit 4 Birmingham, AL | 2.0 | 1.0 | 840 | $823 | $0.98 | 24d | 1 | 0.93mi |
| 1100 Cotton Ave SW Unit b Birmingham, AL | 2.0 | 1.5 | 816 | $988 | $1.21 | 44d | 1 | 0.97mi |
| 963 3rd St W Birmingham, AL | 3.0 | 2.0 | 1444 | $1,295 | $0.90 | 24d | 1 | 0.98mi |
| 1024 4th Ave W Unit B Birmingham, AL | 2.0 | 1.0 | 840 | $823 | $0.98 | 44d | 1 | 0.98mi |
| 405 11th St SW Unit B Birmingham, AL | 2.0 | 1.0 | 1065 | $800 | $0.75 | 44d | 1 | 0.99mi |
| 915 6th St W Birmingham, AL | 3.0 | 1.0 | 1332 | $1,075 | $0.81 | 44d | 1 | 1.01mi |
| 905 7th St W Birmingham, AL | 3.0 | 2.0 | 1029 | $1,150 | $1.12 | 44d | 1 | 1.03mi |
| 741 Center Pl SW Birmingham, AL | 3.0 | 1.0 | 1101 | $1,250 | $1.14 | 16d | 1 | 1.06mi |
| 806 Gamma St S Birmingham, AL | 3.0 | 1.0 | 1252 | $1,200 | $0.96 | 44d | 1 | 1.10mi |
| 1101 7th Ave W Birmingham, AL | 3.0 | 1.0 | 1248 | $1,250 | $1.00 | 44d | 1 | 1.11mi |
| 1119 Graymont Ave W Birmingham, AL | 3.0 | 1.0 | 1260 | $1,073 | $0.85 | 2d | 1 | 1.14mi |
| 219 12th St W Birmingham, AL | 2.0 | 1.0 | 800 | $799 | $1.00 | 24d | 1 | 1.15mi |
| 1220 Alabama Ave SW Birmingham, AL | 3.0 | 1.5 | 1175 | $1,350 | $1.15 | 44d | 1 | 1.19mi |
| 1228 Fulton Ave SW Birmingham, AL | 2.0 | 1.0 | 900 | $800 | $0.89 | 44d | 1 | 1.19mi |
| 856 Center Way SW Birmingham, AL | 3.0 | 2.0 | 1142 | $1,200 | $1.05 | 44d | 1 | 1.22mi |
| 757 10th Ave W Birmingham, AL | 2.0 | 1.0 | 1136 | $1,000 | $0.88 | 44d | 1 | 1.23mi |
| 612 12th St W Birmingham, AL | 3.0 | 1.5 | 1242 | $1,150 | $0.93 | 44d | 1 | 1.23mi |
| 517 11th Ct W Birmingham, AL | 2.0 | 1.0 | 970 | $795 | $0.82 | 44d | 1 | 1.33mi |
| 1153 2nd St N Birmingham, AL | 3.0 | 1.0 | 1056 | $1,150 | $1.09 | 19d | 1 | 1.35mi |
| 916 14th St SW Unit A Birmingham, AL | 2.0 | 1.0 | 870 | $800 | $0.92 | 24d | 1 | 1.38mi |
| 916 14th St SW Unit F Birmingham, AL | 2.0 | 1.0 | 800 | $800 | $1.00 | 12d | 1 | 1.38mi |
| 916 14th St SW Unit F Birmingham, AL | 2.0 | 1.0 | 870 | $800 | $0.92 | 44d | 1 | 1.38mi |
| 1400 7th Ave N Birmingham, AL | 1.0 | 1.0 | 730 | $961 | $1.32 | 24d | 3 | 1.42mi |
Listing history 14 events
-
2026-06-18days on market $18,000 Active 255 DOM
-
2026-06-17days on market $18,000 Active 254 DOM
-
2026-06-16days on market $18,000 Active 253 DOM
-
2026-06-15days on market $18,000 Active 252 DOM
-
2026-06-13days on market $18,000 Active 250 DOM
-
2026-06-10days on market $18,000 Active 247 DOM
-
2026-06-09days on market $18,000 Active 246 DOM
-
2026-06-08days on market $18,000 Active 245 DOM
-
2026-06-07days on market $18,000 Active 244 DOM
-
2026-06-03days on market $18,000 Active 240 DOM
-
2026-06-02days on market $18,000 Active 239 DOM
-
2026-06-01days on market $18,000 Active 238 DOM
-
2026-05-31days on market $18,000 Active 237 DOM
-
2025-10-06$18,000 Active 266-char remark
Show marketing remark (266 chars)
TRANSFER OF TAX INTEREST ONLY -- Great investment opportunity to own this partially gutted property and transform it how you like. Currently zoned R5 on a large corner!! Possibilities are endless!! MAKE YOUR BEST OFFER BEING SOLD "AS IS" ----CASH ONLY---
ⓘ Source: listings_history table (triggers on properties + properties_extension) + one-shot
backfill from property_details.listing_events for pre-trigger history.
Tax reassessment forecast AL · Resets to sale price
- Current annual tax
- $367 · $31/mo
- Projected year-2 tax
- $367 · $31/mo
- Expected delta
- $0/yr ($0/mo · 0.0%)
ⓘ Screening estimate from a state-policy table — verify with the county assessor before closing.
Climate risk First Street
- Flood 5/10 Major FEMA zone AE · 24% chance over 30 yrs
- Wildfire 1/10 Low
- Heat 7/10 Severe 7 d/yr ≥106°F today · 19 d/yr by 30 yrs out
- Wind 6/10 Major 27% chance of damaging wind over 30 yrs
- Air quality 4/10 Moderate 6 unhealthy d/yr today · 8 by 30 yrs out
Nearby sold comps map
Loading sold comps map…
Walkable amenities ~0.75 mi
Loading nearby amenities…
Taxation est. · year 1
- Rental income
- $12,873
- − Mortgage interest
- −$1,008
- − Property taxes
- −$367
- − Insurance
- −$5,208
- − Repairs & maintenance
- −$1,030
- − Management
- −$1,030
- − Depreciation
- −$524
- Taxable income
- $3,706
- Est. tax owed @ 24.0%
- −$889
- After-tax cash flow
- $2,572/yr
For passive investors: Depreciation is non-cash, so a rental often shows a tax loss while cash-flowing — sheltering income. Rental losses are passive: they offset passive income freely, and up to $25,000/yr can offset ordinary (W-2) income if you actively participate and your MAGI is under $100k (phasing out to $0 by $150k); unused losses carry forward. On sale, claimed depreciation is recaptured at up to 25%, and gains may owe capital-gains tax (a 1031 exchange can defer both). Figures are a year-1 estimate at your 24.0% rate — not tax advice; consult a CPA.
Schools (NCES district)
- District
- Birmingham City
- NCES district ID
- 0100390
- Math proficiency
- 4% ▼ -17.00%
- Reading proficiency
- 20% ▼ -4.00%
- Median HH income
- $31,988
- Composite
- 9.49/100
- National rank
- #9850
- State rank
- #116 of 129 in AL
Livability — Birmingham
- Score
- 67/100
- State rank
- #78
- US rank
- #10412
Category grades
Schools grade is shown separately in the Schools card above.
Census & demographics
- Census place
- Birmingham, AL
- County
- Jefferson County · 527,445 people
- City population
- 210,422
- Metro
- Birmingham-Hoover, AL
- Population (ZIP)
- 24,924
- Household income
- $34,884
- Rent vs Own
- Severe rent burden
- 2161.0
Population outlook (Jefferson County) Hauer SSP2
- Today (2025)
- 669,185 people
- By 2030
- 669,694 · +0.1%
- By 2040
- 661,388 · -1.2%
- By 2050
- 643,086 · -3.9%
- By 2075
- 577,267 · -13.7%
- By 2100
- 474,758 · -29.1%
Race, ethnicity, and origin ACS 2023
- Neighborhood character
- Predominantly Black (77%)
- Race & ethnicity
- Black 77% White 10% Hispanic / Latino 10% Two or more races 4%
- Hispanic origin (detail)
- Mexican 7%
- Foreign-born
- 6% · Canada
- Languages at home
- 91% English-only · Spanish 8% French/Haitian/Cajun 1%
Political lean MEDSL · Jefferson
- 2024 margin
- D (+10.4) · D 54.6% · R 44.2% · Other 1.2%
- 2008→2024 swing
- +5.4pp toward D · 2008: 5.1pp · 2024: 10.4pp
- All cycles
- 2024: D+10.4 2020: D+13.2 2016: D+7.2 2012: D+6.0 2008: D+5.1
Not yet ingested
- Civics
- —
Market trends
- HPI YoY
- ▼ -49.29%
- Current HPI
- 91.2903
- Rent YoY
- ▬ -0.01%
- Metro
- Birmingham-Hoover, AL
- State GDP YoY
- ▲ 2.94%
- F500 in state
- 4
Industry mix (Fortune 500 HQ in AL)
| Industry | F500 HQs | Revenue |
|---|---|---|
| Financial Services | 1 | $8B |
|
||
| Healthcare | 1 | $5B |
|
||
Price history
1 event — show timeline
- 2025-10-06 Listed $18,000 Greater Alabama MLS
Property tax history
-2.6%/yrLatest (2025): $367 · +0.0% YoY. Source: county tax records.
Cash-flow waterfall
monthlySold comps — $/sqft
last 12 mo · ≤1 miLoading sold comps…