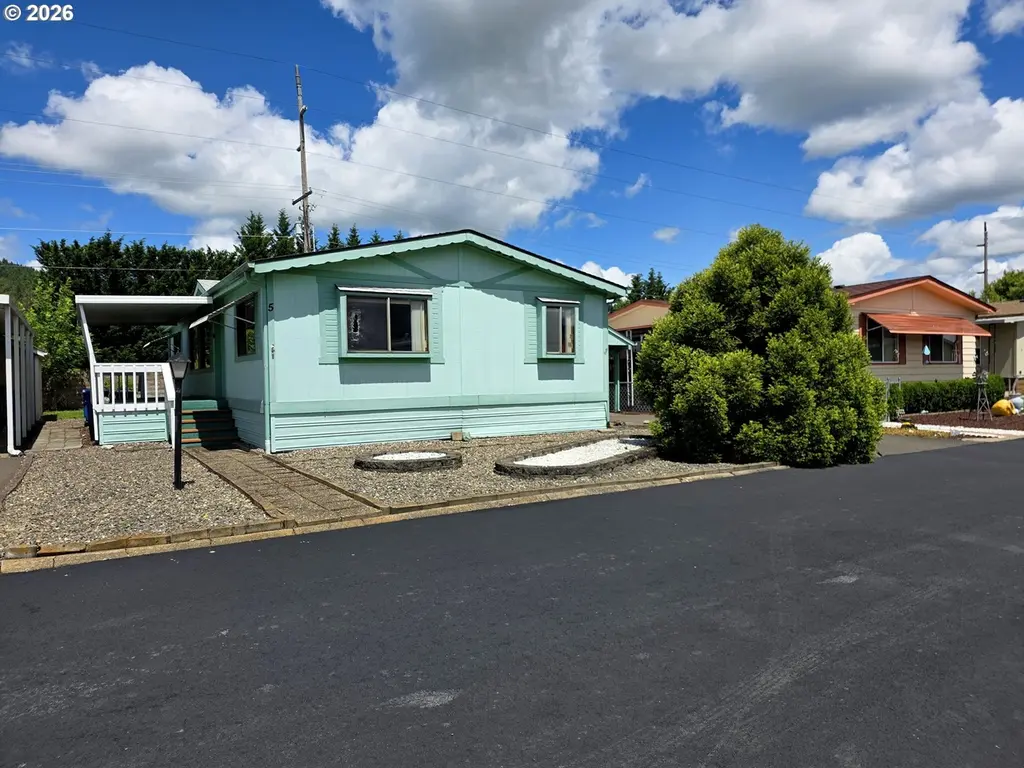
1200 E Central Ave #5 · Sutherlin, OR
Flood risk 9/10 · Severe
- FEMA flood zone
- X (unshaded)
- Chance of flooding over 30 yrs
- 0.99%
- Est. flood insurance / yr
- $507 – $1,088
Fire risk 8/10 · Major
- Est. fire insurance / yr
- $498 – $926
Heat risk 5/10 · Moderate
- Hot days now (above 92°F)
- 8 days/yr
- Hot days in 30 yrs
- 17 days/yr
Wind risk 1/10 · Minimal
- Chance of severe wind over 30 yrs
- —
Air-quality risk 9/10 · Severe
- Unhealthy air days now
- 12 days/yr
- Unhealthy air days in 30 yrs
- 12 days/yr
Risk factors via First Street. Map © Google.
Why this score? — see what drove the B+ grade
The composite is a weighted blend of 9 inputs, each scored 0–100. Each bar is that input's sub-score; the figure is the points it added to the 100-point composite (weight × sub-score).
- Cash flow +30.0/30.0
- ARV discount +15.0/15.0
- 1% rule +10.0/10.0
- DSCR +10.0/10.0
- Livability +3.5/5.0
- Rent growth +2.5/5.0
- Schools +2.5/10.0
- Condition / age +2.5/5.0
- Appreciation +0.0/10.0
$59,900
🖨 Deal sheet (PDF) 📄 Offer letter ✓ Due diligence
Listing remarks MLS
Very well maintained home in a nice Sutherlin 55 and older park w/recreation facilities and a pool. Home features a nice floor plan & a low maintenance yard.
Key facts
- Covered deck
- Double pane windows
- Grass in the back
Tags
Property features AI
Finance
- Other: Property is resale; Property type: Residential (manufactured home in park)
- Financial info: Land lease (lot rent) is paid monthly; Land lease expiration: June 30, 2028
- HOA & community: Pineview Mobile Home Park; Park amenities include meeting room, party room, pool and recreation facilities; Some pet restrictions; Land lease in place (monthly lot rent)
Exterior
- Parking: Carport (1 space); Driveway
- Utilities: Public water; Public sewer; Electricity
- Home design: Manufactured home in park; One-level layout; Built in 1986; Mountain and valley views; T-111 siding; Composition roof; Entry facing unspecified direction
- Construction: Pillar/post/pier foundation with skirting; T-111 siding construction; Composition roof
- Exterior features: Covered deck; Porch; Tool shed; Yard; Public road access; Level, paved lot; Leased land (mobile home park)
Interior
- Kitchen: Disposal; Range hood; Free-standing range; Free-standing refrigerator
- Bedrooms: Primary bedroom on main level; Second bedroom on main level
- Flooring: Laminate flooring; Wall-to-wall carpet
- Bathrooms: 2 full bathrooms (both on the main level)
- Heating & cooling: Heat pump for heating and cooling
- Interior features: Ceiling fans; High ceilings; High-speed internet; Laminate flooring; Wall-to-wall carpet; Soaking tub; Walk-in shower; Laundry area; Washer and dryer included; Accessibility features (minimal steps, one level, utility room on main)
- Laundry & utility: Main-level laundry; Washer and dryer included; Electric hot water
Neighborhood map
What this means for you Summary
Snapshot
- This is a 2-bed/2.0-bath manufactured listed at $60k.
Deal economics
- At list price, monthly cash flow is $523 ($6k/yr) — positive.
- The deal already cash-flows at list — no discount required.
- Meets the 1% rule at list price ($1k rent vs $60k).
- Cap rate 18.1% vs local median 3.5% in Sutherlin — top-decile yield for the area; either an underpriced asset or a hidden risk that comps aren't pricing in. Stress-test before assuming the spread holds.
Location & tenants
- Location reads 70/100 on livability (#135 in OR) — a middle-class / working-renter tenant base. Strengths: cost of living A+, housing A+; Watch: employment C-, health & safety C-, amenities F.
- Sutherlin SD 130 (town): math 19% / reading 40% proficiency, ranked #47 of 58 in OR (top 81%) — low school quality limits family demand, transient renter base, plan for 1-2y turnover.
- Zoned schools: West Sutherlin Intermediate (math 22% / reading 37%, grade F, #263 of 412 statewide, top 68%, 328 students, 63% FRL); Sutherlin Middle School (math 17% / reading 37%, grade F, #96 of 128 statewide, top 78%, 289 students, 65% FRL); Sutherlin High School (math 24% / reading 44%, grade F, #94 of 143 statewide, top 70%, 361 students, 83% FRL) — zoned schools average 70% FRL vs 55% district-wide (15 pts higher); higher-poverty schools than district average — tighter screening recommended.
- Market conditions: 109 active listings in the ZIP; 2 comparable units currently listed for rent nearby; 190 units permitted in Douglas County in 2024 (0 in 5+ unit buildings).
Forward outlook
- Local home prices are declining (-3.0%/yr); year-one equity from $414 of loan paydown is wiped out by about $2k of value loss. Plan a longer hold.
- Douglas County population projected at -13% by 2050 — secular population decline; favor cash flow + early exit over multi-decade hold.
- At projected returns (-3.0% appreciation + 3.0% rent growth), your $17k cash investment doubles in ~4 years — after that, you're playing with house money.
Negotiation context
- Only 1 days on market — expect competitive offers; lowballing is unlikely to land.
- 2 sale attempts since 19y ago with the ask held roughly flat each time — persistent listings suggest the price (not the market) is what's stuck; bring a comps-based counter.
- Current owner paid $25k; list at $60k implies a 140% gain — meaningful room to come down on a strong offer.
Risks & watch-outs
- Watch-outs: flood insurance adds $66/mo.
- Climate carrying-cost: severe flood risk; severe wildfire risk; extreme-heat days projected 8→17/yr by 2055 (HVAC capex compounding) — expect insurance premiums to compound above CPI over the hold.
Questions for the listing agent
- What's the actual annual flood-insurance premium (NFIP or private), and is the property in a SFHA with mandatory coverage?
- Is there a deadline driving the sale (1031 exchange, divorce, estate, relocation)? That informs how much negotiation room exists.
- What's the average days-on-market for RENTAL listings here right now (not sales)? A rising rental-DOM trend means longer vacancies and softer asking-rent achievability than the comps imply.
- What's the recent tenant-quality profile in this submarket — average credit score on applications, eviction rate, late-payment / NSF rate, and stable-employment percentage? A property-management company in the area should have these aggregated.
- How much new for-sale + rental construction is in the pipeline within 1–3 miles? Heavy new supply typically softens prices + rents 12–24 months out; constrained supply supports both.
Investment metrics
- 1% rule
- 2.04% ✓
- Cap rate
- 18.11%
- Cash-on-cash
- 42.19%
- DSCR
- 2.88
- GRM
- 4.1
CMA / ARV
- ARV (median comp)
- $74,872
- List price
- $59,900
- Delta
- -20.00%
- Verdict
- UNDERPRICED
- Comps
- 20 within 1.0 mi
Show comp detail 7 sales within ~0.75 mi
| Address | Dist | Beds/Ba | Sqft | Sold | Price | $/sf | Match |
|---|---|---|---|---|---|---|---|
| 1200 E Central Ave #40 | 0.00mi | 2/2.0 | 1,188 (+3%) | 20mo | $100,000 | $84 | 78 |
| 221 Easy St | 0.36mi | 2/2.0 | 1,188 (+3%) | 22mo | $280,000 | $236 | 60 |
| 1000 E Central Ave #35 | 0.14mi | 3/2.0 (+1) | 1,296 (+12%) | 10mo | $60,000 | $46 | 59 |
| 310 Waite St | 0.39mi | 3/2.0 (+1) | 1,188 (+3%) | 21mo | $286,000 | $241 | 54 |
| 315 Waite St | 0.42mi | 3/2.0 (+1) | 1,296 (+12%) | 12mo | $230,000 | $177 | 44 |
| 232 Heavenly Ct | 0.73mi | 3/2.0 (+1) | 1,296 (+12%) | 8mo | $300,000 | $231 | 34 |
| 280 Spence Ave | 0.73mi | 3/2.0 (+1) | 1,248 (+8%) | 16mo | $305,000 | $244 | 34 |
Match score weights: distance 35% · size 25% · config 20% · recency 20%. Top-matched comps best support the ARV.
Projected returns pro-forma
-3.0% appreciation · 3.0% rent growth · sell at horizon
- IRR
- 33.4%
- Equity multiple
- 2.41×
- Total profit
- $23,652
- Equity at exit
- $8,931
- IRR
- 40.4%
- Equity multiple
- 4.79×
- Total profit
- $63,649
- Equity at exit
- $5,179
Cash invested: $16,772 (down + closing). Projections, not guarantees.
Landlord ↔ Tenant lean methodology
- Overall (STATE)
- 28 Tenant-Leaning
- State Oregon
- 28 Tenant-Leaning · D+6
- County
- — inherits STATE
- City
- — inherits STATE
ZIP-level market 97479
- Home prices YoY
- -19.2%
- Active inventory
- 109
- Price-to-rent
- 4.1×
Monthly cashflow live
- Estimated rent
- $1,222 medium interval (Pro) →
- Mortgage (P&I)
- −$314
- Tax from tax record
- −$36 /mo · $437/yr
- Insurance
- −$25
- Flood insurance flood zone
- −$66 /mo · $798/yr
- HOA
- −$0
- Vacancy / Maint / Mgmt
- −$257
- Net cashflow
- $523
Break-even live
Sensitivity live
| Price | -10% $557 | -5% $540 | +0% $523 | +5% $506 | +10% $489 |
|---|---|---|---|---|---|
| Rent | -10% $427 | -5% $475 | +0% $523 | +5% $571 | +10% $620 |
| Rate | -1.0pp $553 | -0.5pp $538 | base $523 | +0.5pp $508 | +1.0pp $492 |
UW: 25.0% down · 7.5% · 30yr · 1.5% tax · 5.0% vac · 8.0% maint · 8.0% mgmt
Financing live
Cash to close
- Down payment
- $14,975
- Closing costs
- $1,797
- Reserves months
- —
- Total cash needed
- —
Loan-product check · same deal, 3 products live
Conventional
25% down · 7.5% · 30yr
- Down + closing
- —
- Monthly P&I
- —
- Monthly cashflow
- —
- DSCR
- —
- Eligible?
- —
Personal DTI + credit; lowest rate.
DSCR
20% down · 8.5% · 30yr
- Down + closing
- —
- Monthly P&I
- —
- Monthly cashflow
- —
- DSCR
- —
- Eligible?
- —
No personal income docs; deal must DSCR.
Hard money
10% down · 12.0% · 12mo
- Down + closing
- —
- Monthly P&I
- —
- Monthly cashflow
- —
- DSCR
- —
- Eligible?
- —
Short-term bridge; refi at stabilization.
Rent comps 2 comps
| Address | Beds | Baths | Sqft | Rent | $/sqft | DOM | Units | Dist |
|---|---|---|---|---|---|---|---|---|
| 214 Sunny Ln Unit 122 Sutherlin, OR | 2.0 | 1.0 | 860 | $1,195 | $1.39 | 21d | 1 | 0.10mi |
| 233 NW Sherman St Sutherlin, OR | 2.0 | 2.0 | 988 | $1,550 | $1.57 | 14d | 2 | 1.41mi |
Listing history 11 events
-
2026-06-07statusdays on market $59,900 Pending 1 DOM
-
2026-06-03days on market $59,900 Active 20 DOM
-
2026-06-03price $59,900 Active 19 DOM
-
2026-06-02days on market $64,900 Active 19 DOM
-
2026-06-01days on market $64,900 Active 18 DOM
-
2026-05-31days on market $64,900 Active 17 DOM
-
2026-05-30days on market $64,900 Active 16 DOM
-
2026-05-14$64,900 Active 857-char remark
-
2008-06-06soldstatus $25,000 161-char remark
Show marketing remark (161 chars)
Very well maintained home in a nice Sutherlin 55 and older park w/recreation facilities and a pool. Home features a nice floor plan & a low maintenance yard.
-
2008-05-22historical 161-char remark
Show marketing remark (161 chars)
Very well maintained home in a nice Sutherlin 55 and older park w/recreation facilities and a pool. Home features a nice floor plan & a low maintenance yard.
-
2007-06-27$29,000 161-char remark
Show marketing remark (161 chars)
Very well maintained home in a nice Sutherlin 55 and older park w/recreation facilities and a pool. Home features a nice floor plan & a low maintenance yard.
ⓘ Source: listings_history table (triggers on properties + properties_extension) + one-shot
backfill from property_details.listing_events for pre-trigger history.
Tax reassessment forecast OR · Resets to sale price
- Current annual tax
- $437 · $36/mo
- Projected year-2 tax
- $581 · $48/mo
- Expected delta
- +$144/yr (+$12/mo · 33.1%)
ⓘ Screening estimate from a state-policy table — verify with the county assessor before closing.
Climate risk First Street
- Flood 9/10 Extreme FEMA zone X (unshaded) · 99% chance over 30 yrs
- Wildfire 8/10 Severe
- Heat 5/10 Major 8 d/yr ≥92°F today · 17 d/yr by 30 yrs out
- Wind 1/10 Low
- Air quality 9/10 Extreme 12 unhealthy d/yr today · 12 by 30 yrs out
Nearby sold comps map
Loading sold comps map…
Walkable amenities ~0.75 mi
Loading nearby amenities…
Taxation est. · year 1
- Rental income
- $14,660
- − Mortgage interest
- −$3,355
- − Property taxes
- −$437
- − Insurance
- −$1,097
- − Repairs & maintenance
- −$1,173
- − Management
- −$1,173
- − Depreciation
- −$1,743
- Taxable income
- $5,683
- Est. tax owed @ 24.0%
- −$1,364
- After-tax cash flow
- $4,915/yr
For passive investors: Depreciation is non-cash, so a rental often shows a tax loss while cash-flowing — sheltering income. Rental losses are passive: they offset passive income freely, and up to $25,000/yr can offset ordinary (W-2) income if you actively participate and your MAGI is under $100k (phasing out to $0 by $150k); unused losses carry forward. On sale, claimed depreciation is recaptured at up to 25%, and gains may owe capital-gains tax (a 1031 exchange can defer both). Figures are a year-1 estimate at your 24.0% rate — not tax advice; consult a CPA.
Schools (NCES district)
- District
- Sutherlin SD 130
- NCES district ID
- 4111940
- Math proficiency
- 19% ▼ -19.00%
- Reading proficiency
- 40% ▼ -14.00%
- Median HH income
- $40,425
- Composite
- 24.79/100
- National rank
- #7598
- State rank
- #47 of 58 in OR
Livability — Sutherlin
- Score
- 70/100
- State rank
- #135
- US rank
- #7711
Category grades
Schools grade is shown separately in the Schools card above.
Census & demographics
- Census place
- Sutherlin, OR
- Population (ZIP)
- 10,479
Population outlook (Douglas County) Hauer SSP2
- Today (2025)
- 105,191 people
- By 2030
- 102,664 · -2.4%
- By 2040
- 96,668 · -8.1%
- By 2050
- 91,279 · -13.2%
- By 2075
- 79,395 · -24.5%
- By 2100
- 66,107 · -37.2%
Race, ethnicity, and origin ACS 2023
- Neighborhood character
- Predominantly White (91%)
- Race & ethnicity
- White 91% Two or more races 4% Hispanic / Latino 3% Black 1%
- Common ancestry
- Italian 3% Serbian 3% Slovak 3%
- Foreign-born
- 2%
- Languages at home
- 99% English-only · Spanish 1%
Political lean MEDSL · Douglas
- 2024 margin
- Solid R (+37.7) · D 29.9% · R 67.6% · Other 2.5%
- 2008→2024 swing
- -17.6pp toward R · 2008: -20.1pp · 2024: -37.7pp
- All cycles
- 2024: R+37.7 2020: R+37.5 2016: R+39.4 2012: R+27.6 2008: R+20.1
Not yet ingested
- Civics
- —
Market trends
- HPI YoY
- ▼ -78.34%
- Current HPI
- 328.8614
- Rent YoY
- —
- Metro
- —
- State GDP YoY
- ▲ 2.05%
- F500 in state
- 2
Industry mix (Fortune 500 HQ in OR)
| Industry | F500 HQs | Revenue |
|---|---|---|
| Consumer Goods | 1 | $51B |
|
||
Price history
+106.6% since first listed5 events — show timeline
- 2026-06-04 Pending — RMLS
- 2026-05-14 Listed $59,900 RMLS
- 2008-06-06 Sold (MLS) $25,000 RMLS
- 2008-05-22 Delisted — RMLS
- 2007-06-27 Listed $29,000 RMLS
Property tax history
+2.2%/yrLatest (2025): $437 · +2.2% YoY. Source: county tax records.
Cash-flow waterfall
monthlySold comps — $/sqft
last 12 mo · ≤1 miLoading sold comps…