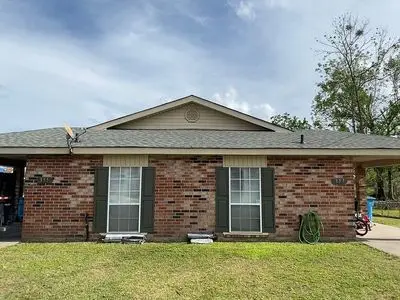
 Duplex
355 Woodland Dr · Boutte, LA
Flood risk No data
- FEMA flood zone
- —
- Chance of flooding over 30 yrs
- —
- Est. flood insurance / yr
- —
Fire risk No data
- Est. fire insurance / yr
- —
Heat risk No data
- Hot days now (above threshold)
- —
- Hot days in 30 yrs
- —
Wind risk No data
- Chance of severe wind over 30 yrs
- —
Air-quality risk No data
- Unhealthy air days now
- —
- Unhealthy air days in 30 yrs
- —
Risk factors via First Street. Map © Google.
Why this score? — see what drove the B- grade
The composite is a weighted blend of 9 inputs, each scored 0–100. Each bar is that input's sub-score; the figure is the points it added to the 100-point composite (weight × sub-score).
- Cash flow +27.1/30.0
- DSCR +9.4/10.0
- ARV discount +7.5/15.0
- Appreciation +6.5/10.0
- 1% rule +6.4/10.0
- Schools +4.0/10.0
- Livability +3.3/5.0
- Rent growth +2.5/5.0
- Condition / age +2.5/5.0
$229,000
🖨 Deal sheet 📄 Offer letter ✓ Due diligence
Multi-family units
County records classify this as Multi-Family (2-4 Unit). Listing-text estimate: 2 units. confirmed
Listing remarks
This duplex offers two 2-bedroom, 2-bath units, each with covered parking, private fenced backyards, and no carpet for easy maintenance. Unit 2 was totally renovated 3 years ago with modern finishes and is now occupied with tenants for 3 years, while Unit 1 is occupied by long-term tenants, providing stable rental income. Both units feature spacious living areas, functional kitchens, inside laundry rooms and separate primarys. The private fenced backyards with de-attached sheds offer a great space for storage and privacy for relaxation or play. With both units currently occupied, this duplex is a great investment opportunity, offering immediate income. Don & acirc; & euro; & tra
Key facts
- Totally renovated
- Covered parking
- No carpet
Tags
Neighborhood map
What this means for you Summary
Snapshot
- This is a 2 × 2-bed/2.0-bath units multifamily listed at $229k.
Deal economics
- At list price, monthly cash flow is $646 ($8k/yr) — positive. Per door: $323/mo.
- The deal already cash-flows at list — no discount required.
- Meets the 1% rule at list price ($3k rent vs $229k).
- Recommended offer: $226k (1.5% below list) — sets the bar for market timing.
Location & tenants
- Location reads 66/100 on livability (#124 in LA) — a middle-class / working-renter tenant base. Strengths: crime A+, housing A+, cost of living A-; Watch: amenities F, commute F, health & safety F.
- St. Charles Parish (suburban): math 40% / reading 51% proficiency, ranked #14 of 98 in LA (top 14%) — families likely to look elsewhere, expect single-tenant / working-renter base with shorter leases.
- Market conditions: 18 active listings in the ZIP; 1 comparable units currently listed for rent nearby; 74 units permitted in St. Charles Parish in 2024 (0 in 5+ unit buildings).
Forward outlook
- In year one you build about $9k of equity ($2k loan paydown + $7k appreciation (3.0% local appreciation)).
- St. Charles County population projected to shrink 7% by 2050 — rents likely to lag national; underwrite the cash flow, not the appreciation.
- At projected returns (3.0% appreciation + 3.0% rent growth), your $64k cash investment doubles in ~4 years — after that, you're playing with house money.
- By year 5, paydown + projected appreciation supports a ~$37k cash-out refi (75% LTV) — recoverable capital for the next deal without selling this one.
Negotiation context
- It's been on market 15 days — a 2% lower offer ($226k) is reasonable based on typical stale-listing flexibility.
Questions for the listing agent
- Can we see the unit-by-unit rent roll, current vacancy, and any below-market leases? What's the average tenancy length?
- What capital expenditures (roof, boiler, parking lot, exteriors) have been made in the last 5 years, and what's planned in the next 2?
- Is there a deadline driving the sale (1031 exchange, divorce, estate, relocation)? That informs how much negotiation room exists.
- Schools are B-rated — typically a magnet for longer-tenancy family renters. What's the average tenant stay here, and is there a school-zone premium baked into asking?
- What's the average days-on-market for RENTAL listings here right now (not sales)? A rising rental-DOM trend means longer vacancies and softer asking-rent achievability than the comps imply.
- What's the recent tenant-quality profile in this submarket — average credit score on applications, eviction rate, late-payment / NSF rate, and stable-employment percentage? A property-management company in the area should have these aggregated.
- How much new apartment / multifamily construction is in the pipeline within 1–3 miles? Heavy new supply (>2% of stock underway) typically softens rents 12–24 months out; light construction supports rent growth.
Investment metrics
- 1% rule
- 1.14% ✓
- Cap rate
- 9.68%
- Cash-on-cash
- 12.09%
- DSCR
- 1.54
- GRM
- 7.3
CMA / ARV
No comps found within radius.
Projected returns pro-forma
3.02% appreciation · 3.0% rent growth · sell at horizon
- IRR
- 18.9%
- Equity multiple
- 2.08×
- Total profit
- $68,941
- Equity at exit
- $103,252
- IRR
- 20.1%
- Equity multiple
- 3.92×
- Total profit
- $187,385
- Equity at exit
- $159,344
Cash invested: $64,120 (down + closing). Projections, not guarantees.
Landlord ↔ Tenant lean methodology
- Overall (STATE)
- 90 Strongly Landlord-Friendly
- State Louisiana
- 90 Strongly Landlord-Friendly · R+12
- County
- — inherits STATE
- City
- — inherits STATE
ZIP-level market 70039
- Home prices YoY
- 1.7%
- Active inventory
- 18
- Price-to-rent
- 14.6×
Monthly cashflow live
- Estimated rent
- $2,620 high interval (Pro) →
- Mortgage (P&I)
- −$1,201
- Tax from tax record
- −$127 /mo · $1,529/yr
- Insurance
- −$95
- HOA
- −$0
- Vacancy / Maint / Mgmt
- −$550
- Net cashflow
- $646
Break-even live
2-unit breakdown (identical units grouped — click to expand)
| Units | Beds | Baths | Est. rent |
|---|---|---|---|
| 2× units | 2 | 2 | $2,620 |
| #1 | 2 | 2 | $1,310 |
| #2 | 2 | 2 | $1,310 |
| Total (2 units) | $2,620 | ||
UW: 25.0% down · 7.5% · 30yr · 1.5% tax · 5.0% vac · 8.0% maint · 8.0% mgmt
Financing live
Cash to close
- Down payment
- $57,250
- Closing costs
- $6,870
- Reserves months
- —
- Total cash needed
- —
Loan-product check · same deal, 3 products live
Conventional
25% down · 7.5% · 30yr
- Down + closing
- —
- Monthly P&I
- —
- Monthly cashflow
- —
- DSCR
- —
- Eligible?
- —
Personal DTI + credit; lowest rate.
DSCR
20% down · 8.5% · 30yr
- Down + closing
- —
- Monthly P&I
- —
- Monthly cashflow
- —
- DSCR
- —
- Eligible?
- —
No personal income docs; deal must DSCR.
Hard money
10% down · 12.0% · 12mo
- Down + closing
- —
- Monthly P&I
- —
- Monthly cashflow
- —
- DSCR
- —
- Eligible?
- —
Short-term bridge; refi at stabilization.
Rent comps 1 comps
| Address | Beds | Baths | Sqft | Rent | $/sqft | DOM | Units | Dist |
|---|---|---|---|---|---|---|---|---|
| 324 River Oaks Dr Luling, LA | 3.0 | 2.0 | 1900 | $2,200 | $1.16 | 23d | 1 | 1.18mi |
Listing history 12 events
-
2026-06-18days on market $229,000 Active 15 DOM
-
2026-06-17days on market $229,000 Active 14 DOM
-
2026-06-16days on market $229,000 Active 13 DOM
-
2026-06-15days on market $229,000 Active 12 DOM
-
2026-06-13days on market $229,000 Active 10 DOM
-
2026-06-13days on market $229,000 Active 9 DOM
-
2026-06-10days on market $229,000 Active 7 DOM
-
2026-06-09days on market $229,000 Active 6 DOM
-
2026-06-08days on market $229,000 Active 5 DOM
-
2026-06-07days on market $229,000 Active 4 DOM
-
2026-06-05remarks 687-char remark
-
2026-06-05$229,000 Active 1 DOM
ⓘ Source: listings_history table (triggers on properties + properties_extension) + one-shot
backfill from property_details.listing_events for pre-trigger history.
Tax reassessment forecast LA · Resets to sale price
- Current annual tax
- $1,529 · $127/mo
- Projected year-2 tax
- $1,529 · $127/mo
- Expected delta
- $0/yr ($0/mo · 0.0%)
ⓘ Screening estimate from a state-policy table — verify with the county assessor before closing.
Nearby sold comps map
Loading sold comps map…
Walkable amenities ~0.75 mi
Loading nearby amenities…
Taxation est. · year 1
- Rental income
- $31,440
- − Mortgage interest
- −$12,828
- − Property taxes
- −$1,529
- − Insurance
- −$1,145
- − Repairs & maintenance
- −$2,515
- − Management
- −$2,515
- − Depreciation
- −$6,662
- Taxable income
- $4,246
- Est. tax owed @ 24.0%
- −$1,019
- After-tax cash flow
- $6,733/yr
For passive investors: Depreciation is non-cash, so a rental often shows a tax loss while cash-flowing — sheltering income. Rental losses are passive: they offset passive income freely, and up to $25,000/yr can offset ordinary (W-2) income if you actively participate and your MAGI is under $100k (phasing out to $0 by $150k); unused losses carry forward. On sale, claimed depreciation is recaptured at up to 25%, and gains may owe capital-gains tax (a 1031 exchange can defer both). Figures are a year-1 estimate at your 24.0% rate — not tax advice; consult a CPA.
Schools (NCES district)
- District
- St. Charles Parish
- NCES district ID
- 2201440
- Math proficiency
- 40% ▼ -38.00%
- Reading proficiency
- 51% ▼ -32.00%
- Median HH income
- $60,261
- Composite
- 40.0/100
- National rank
- #3830
- State rank
- #14 of 98 in LA
Livability — Boutte
- Score
- 66/100
- State rank
- #124
- US rank
- #11658
Category grades
Schools grade is shown separately in the Schools card above.
Census & demographics
- Census place
- Boutte, LA
- City population
- 2,248
- Population (ZIP)
- 2,248
Population outlook (St. Charles County) Hauer SSP2
- Today (2025)
- 53,296 people
- By 2030
- 53,030 · -0.5%
- By 2040
- 51,646 · -3.1%
- By 2050
- 49,771 · -6.6%
- By 2075
- 46,993 · -11.8%
- By 2100
- 44,473 · -16.6%
Race, ethnicity, and origin ACS 2023
- Neighborhood character
- Diverse neighborhood (Simpson 0.62)
- Race & ethnicity
- White 45% Black 41% Hispanic / Latino 11% Two or more races 10%
- Hispanic origin (detail)
- Mexican 5% Cuban 3%
- Common ancestry
- Lithuanian 14% Russian 2%
- Foreign-born
- 2% · Canada
- Languages at home
- 95% English-only · Spanish 5%
Political lean MEDSL · St. Charles
- 2024 margin
- Solid R (+32.4) · D 33.0% · R 65.4% · Other 1.6%
- 2008→2024 swing
- -1.1pp toward R · 2008: -31.2pp · 2024: -32.4pp
- All cycles
- 2024: R+32.4 2020: R+29.6 2016: R+30.8 2012: R+27.8 2008: R+31.2
Not yet ingested
- Civics
- —
Market trends
- HPI YoY
- ▲ 3.02%
- Current HPI
- 180.0443
- Rent YoY
- —
- Metro
- —
- State GDP YoY
- ▲ 3.29%
- F500 in state
- 10
Industry mix (Fortune 500 HQ in LA)
| Industry | F500 HQs | Revenue |
|---|---|---|
| Telecommunications | 2 | $23B |
|
||
| Utilities | 1 | $12B |
|
||
| Wholesale / Distribution | 1 | $5B |
|
||
| Advertising | 1 | $2B |
|
||
Price history
1 event — show timeline
- 2026-06-04 Listed $229,000 FSBO.com
Property tax history
+5.2%/yrLatest (2024): $1,529 · +40.3% YoY. Source: county tax records.
Cash-flow waterfall
monthlySold comps — $/sqft
last 12 mo · ≤1 miLoading sold comps…