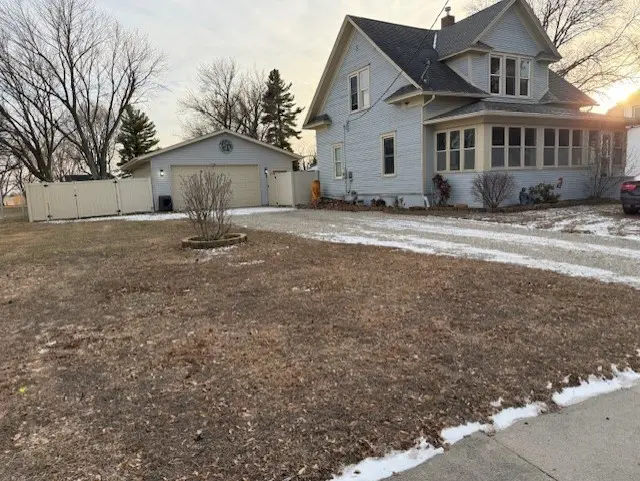
314 Main St · Hooppole, IL
Flood risk 1/10 · Minimal
- FEMA flood zone
- X (unshaded)
- Chance of flooding over 30 yrs
- 0.0%
- Est. flood insurance / yr
- $473 – $860
Fire risk 1/10 · Minimal
- Est. fire insurance / yr
- $804 – $1,492
Heat risk 3/10 · Minor
- Hot days now (above 103°F)
- 7 days/yr
- Hot days in 30 yrs
- 17 days/yr
Wind risk 2/10 · Minimal
- Chance of severe wind over 30 yrs
- —
Air-quality risk 3/10 · Minor
- Unhealthy air days now
- 2 days/yr
- Unhealthy air days in 30 yrs
- 3 days/yr
Risk factors via First Street. Map © Google.
Why this score? — see what drove the D+ grade
The composite is a weighted blend of 9 inputs, each scored 0–100. Each bar is that input's sub-score; the figure is the points it added to the 100-point composite (weight × sub-score).
- Cash flow +16.4/30.0
- DSCR +5.1/10.0
- Appreciation +5.0/10.0
- 1% rule +4.8/10.0
- ARV discount +4.6/15.0
- Schools +3.1/10.0
- Livability +2.9/5.0
- Rent growth +2.5/5.0
- Condition / age +2.5/5.0
$104,000
🖨 Deal sheet 📄 Offer letter ✓ Due diligence
Listing remarks MLS
Schedule your appointment today. Welcome to this 3-bedroom, 1.5-bathroom home, perfect for those looking to invest in a property with great potential. The open-concept living room and dining area provide a spacious feel, ideal for gatherings or entertaining guests. The kitchen is a nice sized, offering ample space for cooking and meal preparation. Situated on a nice lot, the property includes a detached 2-car garage, adding convenience and extra storage. While the home may need some care and updates, its layout present an excellent opportunity for customization and improvement. This is a great chance for buyers looking to make a space their own! Many improvements have be made per the seller including gas forced air heat, central air, duct work, lift station for the septic system, and patio
Key facts
- Patio
- Central air
- Gas forced air heat
Tags
Neighborhood map
What this means for you Summary
Snapshot
- This is a 2-bed/1.0-bath other listed at $104k.
Deal economics
- At list price, monthly cash flow is $59 ($711/yr) — positive.
- The deal already cash-flows at list — no discount required.
- To meet the 1% rule (rent ≥ 1% of price), the offer needs to be $102k (2.0% below list).
- Recommended offer: $92k (12.0% below list) — sets the bar for market timing.
Location & tenants
- Location reads 58/100 on livability (#1,133 in IL) — a working-class tenant base; expect higher turnover. Strengths: cost of living A+, housing A+; Watch: schools D, crime F, amenities F.
- Annawan CUSD 226 (rural): math 30% / reading 35% proficiency, ranked #429 of 919 in IL (top 47%) — families likely to look elsewhere, expect single-tenant / working-renter base with shorter leases.
- Market conditions: 2 active listings in the ZIP; 32 units permitted in Henry County in 2024 (0 in 5+ unit buildings).
Forward outlook
- In year one you build about $4k of equity ($719 loan paydown + $3k appreciation (3.0% local appreciation)).
- Henry County population projected at -16% by 2050 — secular population decline; favor cash flow + early exit over multi-decade hold.
- At projected returns (3.0% appreciation + 3.0% rent growth), your $29k cash investment doubles in ~6 years — after that, you're playing with house money.
- By year 9, paydown + projected appreciation supports a ~$33k cash-out refi (75% LTV) — recoverable capital for the next deal without selling this one.
Negotiation context
- It's been on market 133 days — a 12% lower offer ($92k) is reasonable based on typical stale-listing flexibility.
- 5 sale attempts since 16y ago; this cycle's ask has dropped $15k (13%) from the opening price — seller is motivated, your offer sets the floor, not the list.
- Current owner paid $72k; 43% above their basis — modest negotiation headroom, anchor on the comps not their cost.
Risks & watch-outs
- Watch-outs: built in 1905 — expect roof / HVAC / electrical / plumbing capex.
Questions for the listing agent
- It's been on market 133 days. Have you received any prior offers? Is the seller open to a 12% concession, seller financing, or rate buy-down credit?
- Built in 1905 — when were the roof, HVAC, electrical panel, plumbing, and water heater last replaced?
- Why hasn't it sold? Are there any deal-killer items the seller is aware of (foundation, flood, title, zoning, code violations)?
- Is there a deadline driving the sale (1031 exchange, divorce, estate, relocation)? That informs how much negotiation room exists.
- Schools are D-rated, which usually means shorter tenancies and higher turnover. Who's the typical renter profile here, and what's been the actual vacancy rate?
- Crime grade is F in this area — have there been break-ins, vandalism, or insurance claims at this property in the last 3 years? What carrier currently insures it and at what premium?
- The area grade is low — what's the realistic commute time and amenity access for the typical tenant pool here? Any planned neighborhood developments (good or bad) we should know about?
- What's the average days-on-market for RENTAL listings here right now (not sales)? A rising rental-DOM trend means longer vacancies and softer asking-rent achievability than the comps imply.
- What's the recent tenant-quality profile in this submarket — average credit score on applications, eviction rate, late-payment / NSF rate, and stable-employment percentage? A property-management company in the area should have these aggregated.
- How much new for-sale + rental construction is in the pipeline within 1–3 miles? Heavy new supply typically softens prices + rents 12–24 months out; constrained supply supports both.
Investment metrics
- 1% rule
- 0.98% ✗
- Cap rate
- 6.98%
- Cash-on-cash
- 2.44%
- DSCR
- 1.11
- GRM
- 8.5
CMA / ARV
- ARV (median comp)
- $97,693
- List price
- $104,000
- Delta
- 6.46%
- Verdict
- FAIR
- Comps
- 13 within 1.0 mi
Projected returns pro-forma
3.0% appreciation · 3.0% rent growth · sell at horizon
- IRR
- 9.8%
- Equity multiple
- 1.56×
- Total profit
- $16,332
- Equity at exit
- $46,763
- IRR
- 12.2%
- Equity multiple
- 2.82×
- Total profit
- $52,916
- Equity at exit
- $72,067
Cash invested: $29,120 (down + closing). Projections, not guarantees.
Landlord ↔ Tenant lean methodology
- Overall (STATE)
- 43 Moderately Tenant-Leaning
- State Illinois
- 43 Moderately Tenant-Leaning · D+7
- County
- — inherits STATE
- City
- — inherits STATE
ZIP-level market 61258
- Active inventory
- 2
- Price-to-rent
- 8.5×
Monthly cashflow live
- Estimated rent
- $1,019 medium interval (Pro) →
- Mortgage (P&I)
- −$545
- Tax from tax record
- −$157 /mo · $1,888/yr
- Insurance
- −$43
- HOA
- −$0
- Vacancy / Maint / Mgmt
- −$214
- Net cashflow
- $59
Break-even live
UW: 25.0% down · 7.5% · 30yr · 1.5% tax · 5.0% vac · 8.0% maint · 8.0% mgmt
Financing live
Cash to close
- Down payment
- $26,000
- Closing costs
- $3,120
- Reserves months
- —
- Total cash needed
- —
Loan-product check · same deal, 3 products live
Conventional
25% down · 7.5% · 30yr
- Down + closing
- —
- Monthly P&I
- —
- Monthly cashflow
- —
- DSCR
- —
- Eligible?
- —
Personal DTI + credit; lowest rate.
DSCR
20% down · 8.5% · 30yr
- Down + closing
- —
- Monthly P&I
- —
- Monthly cashflow
- —
- DSCR
- —
- Eligible?
- —
No personal income docs; deal must DSCR.
Hard money
10% down · 12.0% · 12mo
- Down + closing
- —
- Monthly P&I
- —
- Monthly cashflow
- —
- DSCR
- —
- Eligible?
- —
Short-term bridge; refi at stabilization.
Listing history 29 events
-
2026-06-18days on market $104,000 Active 133 DOM
-
2026-06-17days on market $104,000 Active 132 DOM
-
2026-06-16days on market $104,000 Active 131 DOM
-
2026-06-15days on market $104,000 Active 130 DOM
-
2026-06-13days on market $104,000 Active 128 DOM
-
2026-06-13pricedays on market $104,000 Active 127 DOM
-
2026-06-09days on market $119,000 Active 124 DOM
-
2026-06-08days on market $119,000 Active 123 DOM
-
2026-06-07days on market $119,000 Active 122 DOM
-
2026-06-05days on market $119,000 Active 119 DOM
-
2026-06-03days on market $119,000 Active 118 DOM
-
2026-06-02days on market $119,000 Active 117 DOM
-
2026-06-01days on market $119,000 Active 116 DOM
-
2026-05-31days on market $119,000 Active 115 DOM
-
2026-02-04$119,000 Active 805-char remark
Show marketing remark (805 chars)
Schedule your appointment today. Welcome to this 3-bedroom, 1.5-bathroom home, perfect for those looking to invest in a property with great potential. The open-concept living room and dining area provide a spacious feel, ideal for gatherings or entertaining guests. The kitchen is a nice sized, offering ample space for cooking and meal preparation. Situated on a nice lot, the property includes a detached 2-car garage, adding convenience and extra storage. While the home may need some care and updates, its layout present an excellent opportunity for customization and improvement. This is a great chance for buyers looking to make a space their own! Many improvements have be made per the seller including gas forced air heat, central air, duct work, lift station for the septic system, and patio
-
2022-05-29historical
-
2021-12-22historical
-
2021-08-06historical
-
2021-08-06historical
-
2018-05-29soldstatus $72,500
-
2012-01-17soldstatus $77,500
-
2012-01-13soldstatus $77,500
-
2012-01-13soldstatus $77,500
-
2011-09-26$87,900
-
2011-09-26$87,900
-
2010-12-13soldstatus $27,700
-
2010-12-13soldstatus $27,700
-
2010-10-08$27,500
-
2010-10-08$27,500
ⓘ Source: listings_history table (triggers on properties + properties_extension) + one-shot
backfill from property_details.listing_events for pre-trigger history.
Tax reassessment forecast IL · Partial reset (capped growth)
- Current annual tax
- $1,888 · $157/mo
- Projected year-2 tax
- $2,124 · $177/mo
- Expected delta
- +$237/yr (+$20/mo · 12.5%)
ⓘ Screening estimate from a state-policy table — verify with the county assessor before closing.
Climate risk First Street
- Flood 1/10 Low FEMA zone X (unshaded) · 0% chance over 30 yrs
- Wildfire 1/10 Low
- Heat 3/10 Moderate 7 d/yr ≥103°F today · 17 d/yr by 30 yrs out
- Wind 2/10 Low
- Air quality 3/10 Moderate 2 unhealthy d/yr today · 3 by 30 yrs out
Nearby sold comps map
Loading sold comps map…
Walkable amenities ~0.75 mi
Loading nearby amenities…
Taxation est. · year 1
- Rental income
- $12,232
- − Mortgage interest
- −$5,826
- − Property taxes
- −$1,888
- − Insurance
- −$520
- − Repairs & maintenance
- −$979
- − Management
- −$979
- − Depreciation
- −$3,025
- Taxable loss
- −$984
- Est. tax savings @ 24.0%
- +$236
- After-tax cash flow
- $947/yr
For passive investors: Depreciation is non-cash, so a rental often shows a tax loss while cash-flowing — sheltering income. Rental losses are passive: they offset passive income freely, and up to $25,000/yr can offset ordinary (W-2) income if you actively participate and your MAGI is under $100k (phasing out to $0 by $150k); unused losses carry forward. On sale, claimed depreciation is recaptured at up to 25%, and gains may owe capital-gains tax (a 1031 exchange can defer both). Figures are a year-1 estimate at your 24.0% rate — not tax advice; consult a CPA.
Schools (NCES district)
- District
- Annawan CUSD 226
- NCES district ID
- 1703810
- Math proficiency
- 30% ▲ 10.00%
- Reading proficiency
- 35% ▲ 10.00%
- Median HH income
- $53,191
- Composite
- 31.3/100
- National rank
- #11233
- State rank
- #429 of 919 in IL
Livability — Hooppole
- Score
- 58/100
- State rank
- #1133
- US rank
- #21383
Category grades
Schools grade is shown separately in the Schools card above.
Census & demographics
- Census place
- Hooppole, IL
- City population
- 174
- Population (ZIP)
- 174
Population outlook (Henry County) Hauer SSP2
- Today (2025)
- 47,376 people
- By 2030
- 45,920 · -3.1%
- By 2040
- 42,829 · -9.6%
- By 2050
- 39,606 · -16.4%
- By 2075
- 31,848 · -32.8%
- By 2100
- 23,503 · -50.4%
Race, ethnicity, and origin ACS 2023
- Neighborhood character
- Predominantly White (98%)
- Race & ethnicity
- White 98% Two or more races 2%
- Common ancestry
- Lithuanian 3% Portuguese 2% Iranian 1%
Political lean MEDSL · Henry
- 2024 margin
- Strong R (+24.5) · D 36.8% · R 61.3% · Other 1.9%
- 2008→2024 swing
- -32.2pp toward R · 2008: 7.7pp · 2024: -24.5pp
- All cycles
- 2024: R+24.5 2020: R+21.4 2016: R+21.2 2012: D+3.1 2008: D+7.7
Not yet ingested
- Civics
- —
Market trends
- HPI YoY
- —
- Current HPI
- —
- Rent YoY
- —
- Metro
- —
- State GDP YoY
- ▲ 1.59%
- F500 in state
- 60
Industry mix (Fortune 500 HQ in IL)
| Industry | F500 HQs | Revenue |
|---|---|---|
| Insurance | 4 | $201B |
|
||
| Consumer Goods | 4 | $87B |
|
||
| Industrial Machinery | 3 | $64B |
|
||
| Healthcare | 2 | $55B |
|
||
| Retail / Pharmacy | 1 | $148B |
|
||
| Agriculture / Food | 1 | $86B |
|
||
Price history
+332.7% since first listed15 events — show timeline
- 2026-02-04 Listed $119,000 MRED as Distributed by MLS Grid
- 2022-05-29 Listing Removed — MRED as Distributed by MLS Grid
- 2021-12-22 Listing Removed — RMLSA as Distributed by MLS Grid
- 2021-08-06 Listing Removed — RMLSA as Distributed by MLS Grid
- 2021-08-06 Listing Removed — RMLSA as Distributed by MLS Grid
- 2018-05-29 Sold (Public Records) $72,500 Public Records
- 2012-01-17 Sold (Public Records) $77,500 Public Records
- 2012-01-13 Sold (MLS) $77,500 MRED as Distributed by MLS Grid
- 2012-01-13 Sold (MLS) $77,500 RMLSA as Distributed by MLS Grid
- 2011-09-26 Listed $87,900 MRED as Distributed by MLS Grid
- 2011-09-26 Listed $87,900 RMLSA as Distributed by MLS Grid
- 2010-12-13 Sold (MLS) $27,700 RMLSA as Distributed by MLS Grid
- 2010-12-13 Sold (MLS) $27,700 MRED as Distributed by MLS Grid
- 2010-10-08 Listed $27,500 RMLSA as Distributed by MLS Grid
- 2010-10-08 Listed $27,500 MRED as Distributed by MLS Grid
Property tax history
+6.9%/yrLatest (2024): $1,888 · +8.3% YoY. Source: county tax records.
Cash-flow waterfall
monthlySold comps — $/sqft
last 12 mo · ≤1 miLoading sold comps…