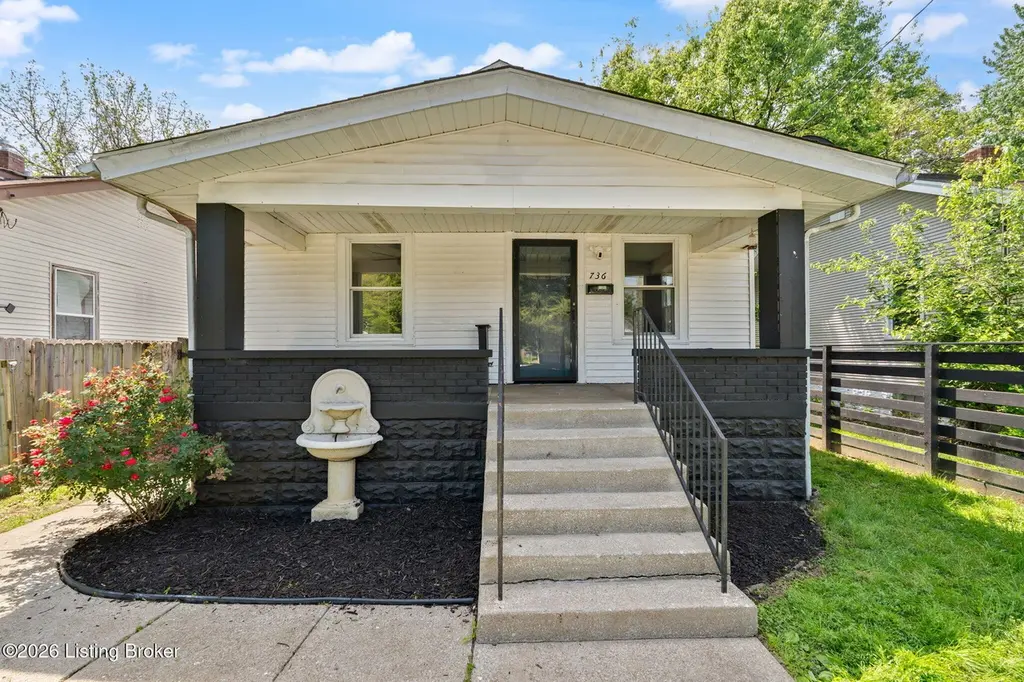
736 Iowa Ave · Louisville, KY
Flood risk 1/10 · Minimal
- FEMA flood zone
- X (unshaded)
- Chance of flooding over 30 yrs
- 0.0%
- Est. flood insurance / yr
- $473 – $860
Fire risk 1/10 · Minimal
- Est. fire insurance / yr
- $839 – $1,559
Heat risk 5/10 · Moderate
- Hot days now (above 104°F)
- 7 days/yr
- Hot days in 30 yrs
- 20 days/yr
Wind risk 2/10 · Minimal
- Chance of severe wind over 30 yrs
- 1.0%
Air-quality risk 2/10 · Minimal
- Unhealthy air days now
- 1 days/yr
- Unhealthy air days in 30 yrs
- 3 days/yr
Risk factors via First Street. Map © Google.
Why this score? — see what drove the C+ grade
The composite is a weighted blend of 9 inputs, each scored 0–100. Each bar is that input's sub-score; the figure is the points it added to the 100-point composite (weight × sub-score).
- Cash flow +21.5/30.0
- ARV discount +15.0/15.0
- DSCR +6.9/10.0
- 1% rule +4.8/10.0
- Rent growth +4.0/5.0
- Livability +3.2/5.0
- Condition / age +2.5/5.0
- Schools +2.3/10.0
- Appreciation +0.0/10.0
$115,000
🖨 Deal sheet 📄 Offer letter ✓ Due diligence
Listing remarks MLS
DRASTICALLY REDUCED!!!! Completely updated ranch...be careful you might just think it's new!! Plus this home sits on a beautiful flat home site with a back yard that's great for a game of kick ball or playing with the family dog. Great location...just minutes to U of L , Papa Johns Cardinal Stadium, shopping, downtown and expressways. Renovations include all new drywall and insulation, not only do your new walls and ceilings look beautiful but your LG&E bills will be so efficient in this home. New roof. New gas stove. New kitchen cabinets and counter top. New blinds throughout. Updated bathroom. All new flooring. Carpet. Marble. Vinyl. Lighting, fans and doors. UPDATES & FEATURES - Vinyl tilt-in windows * Two large windows * Two large bedrooms * HVAC * Hot water heater * R30 blown insulation * R19 Batt insulation * Cedar lined closets * Large storage shed w/ skylight * Full unfinished basement (dry)...QUICK CLOSING * Immediate Possession * Clean... Attention First Time Home Buyers Buy this home and receive $8000. back this year. call agent for details...MAKE OFFER...
Key facts
- Covered front porch
- Unfinished basement
- Large backyard
Tags
Neighborhood map
What this means for you Summary
Snapshot
- This is a 2-bed/1.0-bath single-family listed at $115k.
Deal economics
- At list price, monthly cash flow is $173 ($2k/yr) — positive.
- The deal already cash-flows at list — no discount required.
- To meet the 1% rule (rent ≥ 1% of price), the offer needs to be $112k (2.4% below list).
- Recommended offer: $112k (2.4% below list) — sets the bar for 1% rule.
- Cap rate 8.1% vs local median 5.0% in Louisville — top-decile yield for the area; either an underpriced asset or a hidden risk that comps aren't pricing in. Stress-test before assuming the spread holds.
Location & tenants
- Location reads 63/100 on livability (#333 in KY) — a middle-class / working-renter tenant base. Strengths: cost of living A+, housing A+; Watch: employment C-, health & safety D+, schools D-.
- Jefferson County (urban): math 19% / reading 35% proficiency, ranked #121 of 165 in KY (top 73%) — low school quality limits family demand, transient renter base, plan for 1-2y turnover.
- Market conditions: Rents rising fast (+6.1%/yr); 77 active listings in the ZIP; 40 comparable units currently listed for rent nearby; rentals at typical pace (median 17d on market — plan ~3-4 weeks tenant-placement turnaround); lower-income renter base — watch delinquency; 2,836 units permitted in Jefferson County in 2024 (1,558 in 5+ unit buildings).
- This rent runs 34% of the median local income ($40k/yr) — at the standard rent-burdened threshold; future hikes will face affordability resistance.
Forward outlook
- Local home prices are declining (-3.0%/yr); year-one equity from $795 of loan paydown is wiped out by about $3k of value loss. Plan a longer hold.
- Jefferson County population projected at +13% by 2050 — modest demand growth; plan on rents tracking national, not racing it.
- At projected returns (-3.0% appreciation + 6.1% rent growth), your $32k cash investment doubles in ~10 years — after that, you're playing with house money.
Negotiation context
- It's been on market 18 days — a 2% lower offer ($113k) is reasonable based on typical stale-listing flexibility.
- 2 sale attempts since 17y ago; this cycle's ask has dropped $10k (8%) from the opening price — seller is motivated, your offer sets the floor, not the list.
- Current owner paid $58k; list at $115k implies a 98% gain — meaningful room to come down on a strong offer.
Risks & watch-outs
- Watch-outs: built in 1925 — expect roof / HVAC / electrical / plumbing capex.
- Climate carrying-cost: extreme-heat days projected 7→20/yr by 2055 (HVAC capex compounding) — expect insurance premiums to compound above CPI over the hold.
Questions for the listing agent
- Built in 1925 — when were the roof, HVAC, electrical panel, plumbing, and water heater last replaced?
- Is there a deadline driving the sale (1031 exchange, divorce, estate, relocation)? That informs how much negotiation room exists.
- Schools are D-rated, which usually means shorter tenancies and higher turnover. Who's the typical renter profile here, and what's been the actual vacancy rate?
- Crime grade is F in this area — have there been break-ins, vandalism, or insurance claims at this property in the last 3 years? What carrier currently insures it and at what premium?
- What's the average days-on-market for RENTAL listings here right now (not sales)? A rising rental-DOM trend means longer vacancies and softer asking-rent achievability than the comps imply.
- What's the recent tenant-quality profile in this submarket — average credit score on applications, eviction rate, late-payment / NSF rate, and stable-employment percentage? A property-management company in the area should have these aggregated.
- How much new for-sale + rental construction is in the pipeline within 1–3 miles? Heavy new supply typically softens prices + rents 12–24 months out; constrained supply supports both.
Investment metrics
- 1% rule
- 0.98% ✗
- Cap rate
- 8.09%
- Cash-on-cash
- 6.43%
- DSCR
- 1.29
- GRM
- 8.5
CMA / ARV
- ARV (on-the-fly)
- $138,000
- Comps found
- 12
Show comp detail 12 sales within ~0.75 mi
| Address | Dist | Beds/Ba | Sqft | Sold | Price | $/sf | Match |
|---|---|---|---|---|---|---|---|
| 810 Weller Ave | 0.12mi | 2/1.0 | 840 (-9%) | 2mo | $124,000 | $148 | 78 |
| 528 M St | 0.23mi | 3/2.0 (+1) | 944 (+3%) | 1mo | $142,000 | $150 | 75 |
| 611 Colorado Ave | 0.51mi | 2/1.0 | 925 (+0%) | 1mo | $110,000 | $119 | 75 |
| 520 M St | 0.25mi | 2/1.0 | 986 (+7%) | 2mo | $57,500 | $58 | 74 |
| 914 Euclid Ave | 0.22mi | 2/1.0 | 804 (-13%) | 1mo | $128,000 | $159 | 68 |
| 1325 Lillian Ave | 0.37mi | 2/1.0 | 847 (-8%) | 3mo | $140,000 | $165 | 67 |
| 1200 Tennessee Ave | 0.59mi | 3/1.5 (+1) | 920 (0%) | 2mo | $145,000 | $158 | 63 |
| 1323 Thornberry Ave | 0.45mi | 2/1.0 | 823 (-10%) | 1mo | $140,000 | $170 | 60 |
| 1148 Euclid Ave | 0.62mi | 3/1.0 (+1) | 950 (+3%) | 2mo | $150,000 | $158 | 59 |
| 1315 Weller Ave | 0.63mi | 2/1.0 | 996 (+8%) | 3mo | $125,000 | $126 | 54 |
| 1332 Phyllis Ave | 0.54mi | 2/1.0 | 1,030 (+12%) | 2mo | $150,000 | $146 | 53 |
| 510 Longfield Ave | 0.70mi | 2/1.0 | 800 (-13%) | 2mo | $115,000 | $144 | 44 |
Match score weights: distance 35% · size 25% · config 20% · recency 20%. Top-matched comps best support the ARV.
Projected returns pro-forma
-3.0% appreciation · 6.06% rent growth · sell at horizon
- IRR
- -3.3%
- Equity multiple
- 0.87×
- Total profit
- $-4,118
- Equity at exit
- $17,147
- IRR
- 9.3%
- Equity multiple
- 1.81×
- Total profit
- $25,992
- Equity at exit
- $9,943
Cash invested: $32,200 (down + closing). Projections, not guarantees.
Landlord ↔ Tenant lean methodology
- Overall (STATE)
- 83 Strongly Landlord-Friendly
- State Kentucky
- 83 Strongly Landlord-Friendly · R+16
- County
- — inherits STATE
- City
- — inherits STATE
ZIP-level market 40208
- Home prices YoY
- -23.3%
- Rents YoY
- 6.1%
- Active inventory
- 77
- Price-to-rent
- 8.5×
Monthly cashflow live
- Estimated rent
- $1,122 high interval (Pro) →
- Mortgage (P&I)
- −$603
- Tax from tax record
- −$63 /mo · $756/yr
- Insurance
- −$48
- HOA
- −$0
- Vacancy / Maint / Mgmt
- −$236
- Net cashflow
- $173
Break-even live
UW: 25.0% down · 7.5% · 30yr · 1.5% tax · 5.0% vac · 8.0% maint · 8.0% mgmt
Financing live
Cash to close
- Down payment
- $28,750
- Closing costs
- $3,450
- Reserves months
- —
- Total cash needed
- —
Loan-product check · same deal, 3 products live
Conventional
25% down · 7.5% · 30yr
- Down + closing
- —
- Monthly P&I
- —
- Monthly cashflow
- —
- DSCR
- —
- Eligible?
- —
Personal DTI + credit; lowest rate.
DSCR
20% down · 8.5% · 30yr
- Down + closing
- —
- Monthly P&I
- —
- Monthly cashflow
- —
- DSCR
- —
- Eligible?
- —
No personal income docs; deal must DSCR.
Hard money
10% down · 12.0% · 12mo
- Down + closing
- —
- Monthly P&I
- —
- Monthly cashflow
- —
- DSCR
- —
- Eligible?
- —
Short-term bridge; refi at stabilization.
Rent comps 40 comps
| Address | Beds | Baths | Sqft | Rent | $/sqft | DOM | Units | Dist |
|---|---|---|---|---|---|---|---|---|
| 2826 Taylor Blvd Louisville, KY | 3.0 | 1.0 | 1044 | $1,345 | $1.29 | 23d | 1 | 0.10mi |
| 3107 Montana Ave Louisville, KY | 2.0 | 1.0 | 986 | $995 | $1.01 | 23d | 1 | 0.21mi |
| 1120 Weller Ave Louisville, KY | 2.0 | 1.0 | 912 | $1,500 | $1.64 | 3d | 1 | 0.22mi |
| 2716 S 6th St Louisville, KY | 1.0 | 1.0 | 881 | $950 | $1.08 | 16d | 1 | 0.24mi |
| 508 M St Louisville, KY | 2.0 | 1.5 | 1035 | $1,100 | $1.06 | 23d | 1 | 0.27mi |
| 1301 Lillian Ave Louisville, KY | 3.0 | 1.0 | 974 | $1,250 | $1.28 | 16d | 1 | 0.33mi |
| 1122 Larchmont Ave Unit B Louisville, KY | 2.0 | 1.0 | 864 | $750 | $0.87 | 23d | 1 | 0.36mi |
| 1122 Larchmont Ave Unit B Louisville, KY | 1.0 | 1.0 | 700 | $750 | $1.07 | 17d | 1 | 0.36mi |
| 1122 Larchmont Ave Louisville, KY | 2.0 | 1.0 | 864 | $750 | $0.87 | 16d | 1 | 0.36mi |
| 2805 S 4th St #1 Louisville, KY | 1.0 | 1.0 | 750 | $725 | $0.97 | 21d | 1 | 0.40mi |
| 1305 Larchmont Ave Louisville, KY | 2.0 | 1.0 | 1113 | $1,350 | $1.21 | 16d | 1 | 0.44mi |
| 1055 Euclid Ave Louisville, KY | 2.0 | 1.0 | 914 | $1,325 | $1.45 | 23d | 1 | 0.45mi |
| 2913 S 3rd St Louisville, KY | 2.0 | 1.0 | 1026 | $1,200 | $1.17 | 23d | 1 | 0.48mi |
| 2501 S 4th St Louisville, KY | 1.0–3.0 | 1.0–3.0 | 897 | $3,732 | $4.16 | 3d | 1 | 0.60mi |
| 2501 S 3rd St Louisville, KY | 1.0–2.0 | 1.0–2.0 | 1011 | $1,550 | $1.53 | 3d | 2 | 0.60mi |
| 623 Dresden Ave Louisville, KY | 2.0 | 1.0 | 750 | $975 | $1.30 | 16d | 1 | 0.70mi |
| 615 Dresden Ave Louisville, KY | 3.0 | 1.0 | 884 | $1,450 | $1.64 | 23d | 1 | 0.71mi |
| 1438 Lillian Ave Louisville, KY | 2.0 | 1.0 | 777 | $1,050 | $1.35 | 17d | 1 | 0.71mi |
| 1637 Thornberry Ave Louisville, KY | 2.0 | 1.0 | 700 | $1,250 | $1.79 | 3d | 1 | 0.71mi |
| 3860 Southern Pkwy Louisville, KY | 3.0 | 1.0 | 1064 | $1,250 | $1.17 | 23d | 1 | 0.71mi |
| 4600 South St Unit PARKWAYE1 Louisville, KY | 2.0 | 1.0 | 700 | $749 | $1.07 | 23d | 1 | 0.76mi |
| 3909 Southern Pkwy Unit 2 Louisville, KY | 3.0 | 1.0 | 1000 | $1,100 | $1.10 | 3d | 1 | 0.78mi |
| 4012 Southern Pkwy Unit 8 Louisville, KY | 1.0 | 1.0 | 600 | $795 | $1.32 | 14d | 1 | 0.86mi |
| 4012 Southern Pkwy Unit 5 Louisville, KY | 1.0 | 1.0 | 600 | $795 | $1.32 | 23d | 1 | 0.86mi |
| 1111 Dresden Ave Louisville, KY | 2.0 | 1.0 | 680 | $1,100 | $1.62 | 16d | 1 | 0.87mi |
| 309 W Whitney Ave Louisville, KY | 1.0 | 1.0 | 700 | $875 | $1.25 | 23d | 1 | 1.02mi |
| 554 Camden Ave Louisville, KY | 1.0 | 1.0 | 661 | $875 | $1.32 | 23d | 1 | 1.05mi |
| 1411 Sale Ave Louisville, KY | 2.0 | 1.0 | 936 | $1,000 | $1.07 | 16d | 1 | 1.09mi |
| 1118 W Whitney Ave Louisville, KY | 2.0 | 1.0 | 771 | $1,199 | $1.56 | 23d | 1 | 1.13mi |
| 1800 S 2nd St Louisville, KY | 1.0 | 1.0 | 575 | $950 | $1.65 | 16d | 7 | 1.14mi |
| 1606 Algonquin Pkwy Unit 22 Louisville, KY | 2.0 | 1.0 | 626 | $750 | $1.20 | 23d | 1 | 1.15mi |
| 1501 Bellamy Pl Louisville, KY | 2.0–4.0 | 2.0–4.0 | 1074 | $1,758 | $1.64 | 3d | 1 | 1.17mi |
| 1105 Beecher St Louisville, KY | 2.0 | 1.0 | 708 | $1,150 | $1.62 | 16d | 1 | 1.19mi |
| 3449 Powell Ave Louisville, KY | 2.0 | 1.0 | 800 | $1,000 | $1.25 | 23d | 1 | 1.22mi |
| 415 Atwood St Louisville, KY | 1.0 | 1.0 | 770 | $995 | $1.29 | 21d | 1 | 1.22mi |
| 218 W Florence Ave Unit 2 Louisville, KY | 1.0 | 1.0 | 800 | $765 | $0.96 | 3d | 1 | 1.23mi |
| 1702 S 2nd St Apt 1 Louisville, KY | 2.0 | 1.0 | 875 | $1,100 | $1.26 | 23d | 1 | 1.23mi |
| 1702 S 2nd St Apt 3 Louisville, KY | 1.0 | 1.0 | 625 | $875 | $1.40 | 23d | 1 | 1.23mi |
| 520 Wainwright Ave Louisville, KY | 2.0 | 1.0 | 1000 | $1,495 | $1.50 | 16d | 1 | 1.23mi |
| 533 Eastern Pkwy Louisville, KY | 1.0 | 1.0 | 784 | $1,200 | $1.53 | 16d | 1 | 1.24mi |
Listing history 14 events
-
2026-06-18pricestatus $115,000 Active 18 DOM
-
2026-06-10status $125,000 Pending 18 DOM
-
2026-06-09days on market $125,000 Active 18 DOM
-
2026-06-08days on market $125,000 Active 17 DOM
-
2026-06-07days on market $125,000 Active 16 DOM
-
2026-06-03days on market $125,000 Active 12 DOM
-
2026-06-02days on market $125,000 Active 11 DOM
-
2026-06-01days on market $125,000 Active 10 DOM
-
2026-05-31days on market $125,000 Active 9 DOM
-
2026-04-27status Pending
-
2026-04-23$125,000 Active
-
2009-11-16soldstatus $57,950
-
2009-11-13soldstatus $57,950 1091-char remark
Show marketing remark (1091 chars)
DRASTICALLY REDUCED!!!! Completely updated ranch...be careful you might just think it's new!! Plus this home sits on a beautiful flat home site with a back yard that's great for a game of kick ball or playing with the family dog. Great location...just minutes to U of L , Papa Johns Cardinal Stadium, shopping, downtown and expressways. Renovations include all new drywall and insulation, not only do your new walls and ceilings look beautiful but your LG&E bills will be so efficient in this home. New roof. New gas stove. New kitchen cabinets and counter top. New blinds throughout. Updated bathroom. All new flooring. Carpet. Marble. Vinyl. Lighting, fans and doors. UPDATES & FEATURES - Vinyl tilt-in windows * Two large windows * Two large bedrooms * HVAC * Hot water heater * R30 blown insulation * R19 Batt insulation * Cedar lined closets * Large storage shed w/ skylight * Full unfinished basement (dry)...QUICK CLOSING * Immediate Possession * Clean... Attention First Time Home Buyers Buy this home and receive $8000. back this year. call agent for details...MAKE OFFER...
-
2009-07-20$62,500 1091-char remark
Show marketing remark (1091 chars)
DRASTICALLY REDUCED!!!! Completely updated ranch...be careful you might just think it's new!! Plus this home sits on a beautiful flat home site with a back yard that's great for a game of kick ball or playing with the family dog. Great location...just minutes to U of L , Papa Johns Cardinal Stadium, shopping, downtown and expressways. Renovations include all new drywall and insulation, not only do your new walls and ceilings look beautiful but your LG&E bills will be so efficient in this home. New roof. New gas stove. New kitchen cabinets and counter top. New blinds throughout. Updated bathroom. All new flooring. Carpet. Marble. Vinyl. Lighting, fans and doors. UPDATES & FEATURES - Vinyl tilt-in windows * Two large windows * Two large bedrooms * HVAC * Hot water heater * R30 blown insulation * R19 Batt insulation * Cedar lined closets * Large storage shed w/ skylight * Full unfinished basement (dry)...QUICK CLOSING * Immediate Possession * Clean... Attention First Time Home Buyers Buy this home and receive $8000. back this year. call agent for details...MAKE OFFER...
ⓘ Source: listings_history table (triggers on properties + properties_extension) + one-shot
backfill from property_details.listing_events for pre-trigger history.
Tax reassessment forecast KY · Resets to sale price
- Current annual tax
- $756 · $63/mo
- Projected year-2 tax
- $989 · $82/mo
- Expected delta
- +$233/yr (+$19/mo · 30.8%)
ⓘ Screening estimate from a state-policy table — verify with the county assessor before closing.
Climate risk First Street
- Flood 1/10 Low FEMA zone X (unshaded) · 0% chance over 30 yrs
- Wildfire 1/10 Low
- Heat 5/10 Major 7 d/yr ≥104°F today · 20 d/yr by 30 yrs out
- Wind 2/10 Low 100% chance of damaging wind over 30 yrs
- Air quality 2/10 Low 1 unhealthy d/yr today · 3 by 30 yrs out
Nearby sold comps map
Loading sold comps map…
Walkable amenities ~0.75 mi
Loading nearby amenities…
Taxation est. · year 1
- Rental income
- $13,466
- − Mortgage interest
- −$6,442
- − Property taxes
- −$756
- − Insurance
- −$575
- − Repairs & maintenance
- −$1,077
- − Management
- −$1,077
- − Depreciation
- −$3,345
- Taxable income
- $193
- Est. tax owed @ 24.0%
- −$46
- After-tax cash flow
- $2,024/yr
For passive investors: Depreciation is non-cash, so a rental often shows a tax loss while cash-flowing — sheltering income. Rental losses are passive: they offset passive income freely, and up to $25,000/yr can offset ordinary (W-2) income if you actively participate and your MAGI is under $100k (phasing out to $0 by $150k); unused losses carry forward. On sale, claimed depreciation is recaptured at up to 25%, and gains may owe capital-gains tax (a 1031 exchange can defer both). Figures are a year-1 estimate at your 24.0% rate — not tax advice; consult a CPA.
Schools (NCES district)
- District
- Jefferson County
- NCES district ID
- 2102990
- Math proficiency
- 19% ▼ -17.00%
- Reading proficiency
- 35% ▼ -11.00%
- Median HH income
- $47,885
- Composite
- 23.45/100
- National rank
- #7884
- State rank
- #121 of 165 in KY
Livability — Louisville
- Score
- 63/100
- State rank
- #333
- US rank
- #15887
Category grades
Schools grade is shown separately in the Schools card above.
Census & demographics
- Census place
- Louisville, KY
- County
- Jefferson County · 790,184 people
- City population
- 769,292
- Metro
- Louisville/Jefferson County, KY-IN
- Population (ZIP)
- 15,605
- Household income
- $39,560
- Rent vs Own
- Severe rent burden
- 1136.0
Population outlook (Jefferson County) Hauer SSP2
- Today (2025)
- 823,112 people
- By 2030
- 849,343 · +3.2%
- By 2040
- 895,696 · +8.8%
- By 2050
- 933,630 · +13.4%
- By 2075
- 1,028,262 · +24.9%
- By 2100
- 1,072,675 · +30.3%
Race, ethnicity, and origin ACS 2023
- Neighborhood character
- Diverse neighborhood (Simpson 0.56)
- Race & ethnicity
- White 62% Black 22% Two or more races 9% Hispanic / Latino 6% Asian 1%
- Hispanic origin (detail)
- Mexican 4%
- Common ancestry
- Italian 3% Lithuanian 2% Slovak 2%
- Foreign-born
- 5% · Canada, China, South Korea
- Languages at home
- 90% English-only · Spanish 3% French/Haitian/Cajun 1%
Political lean MEDSL · Jefferson
- 2024 margin
- D (+16.6) · D 57.4% · R 40.9% · Other 1.7%
- 2008→2024 swing
- +4.5pp toward D · 2008: 12.0pp · 2024: 16.6pp
- All cycles
- 2024: D+16.6 2020: D+20.1 2016: D+13.3 2012: D+11.1 2008: D+12.0
Not yet ingested
- Civics
- —
Market trends
- HPI YoY
- ▼ -72.97%
- Current HPI
- 240.6261
- Rent YoY
- ▲ 6.06%
- Metro
- Louisville/Jefferson County, KY-IN
- State GDP YoY
- ▲ 1.81%
- F500 in state
- 4
Industry mix (Fortune 500 HQ in KY)
| Industry | F500 HQs | Revenue |
|---|---|---|
| Healthcare | 1 | $118B |
|
||
| Food / Beverage | 1 | $7B |
|
||
Price history
+100.0% since first listed5 events — show timeline
- 2026-04-27 Pending — Metro Search MLS
- 2026-04-23 Listed $125,000 Metro Search MLS
- 2009-11-16 Sold (Public Records) $57,950 Public Records
- 2009-11-13 Sold (MLS) $57,950 Metro Search MLS
- 2009-07-20 Listed $62,500 Metro Search MLS
Property tax history
+3.5%/yrLatest (2025): $756 · -1.9% YoY. Source: county tax records.
Cash-flow waterfall
monthlySold comps — $/sqft
last 12 mo · ≤1 miLoading sold comps…