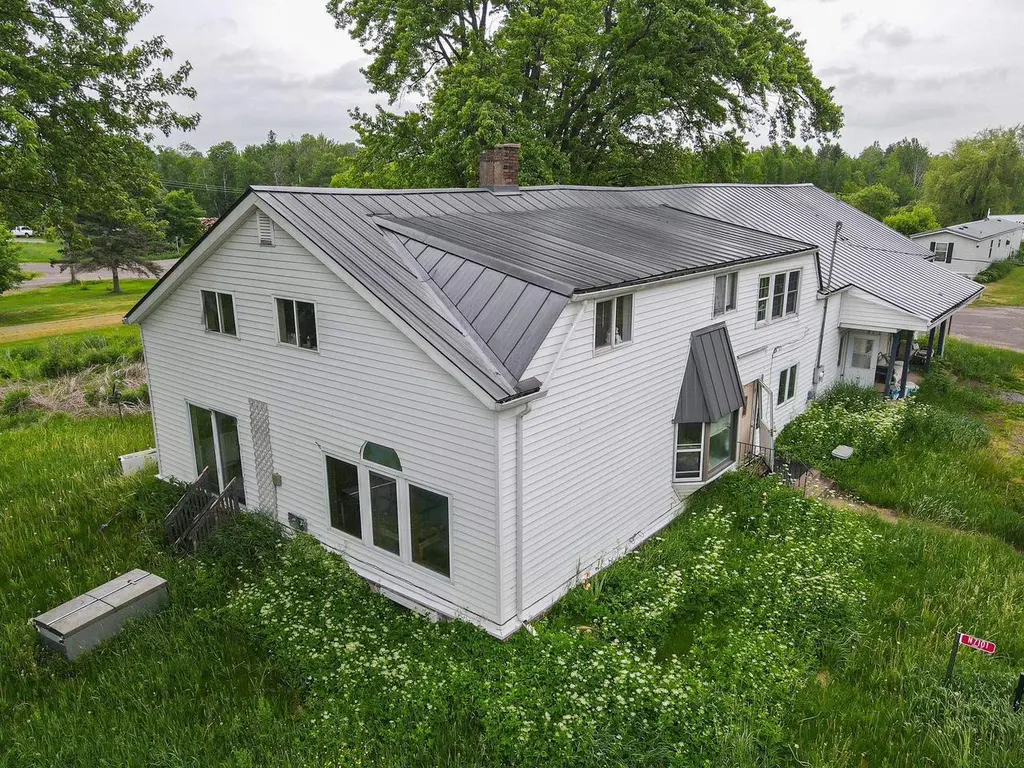
N7101 Front St · Chelsea, WI
Flood risk 1/10 · Minimal
- FEMA flood zone
- X
- Chance of flooding over 30 yrs
- 0.0%
- Est. flood insurance / yr
- $473 – $860
Fire risk 3/10 · Minor
- Est. fire insurance / yr
- $636 – $1,182
Heat risk 1/10 · Minimal
- Hot days now (above 92°F)
- 7 days/yr
- Hot days in 30 yrs
- 13 days/yr
Wind risk 1/10 · Minimal
- Chance of severe wind over 30 yrs
- —
Air-quality risk 1/10 · Minimal
- Unhealthy air days now
- 0 days/yr
- Unhealthy air days in 30 yrs
- 0 days/yr
Risk factors via First Street. Map © Google.
Why this score? — see what drove the B- grade
The composite is a weighted blend of 9 inputs, each scored 0–100. Each bar is that input's sub-score; the figure is the points it added to the 100-point composite (weight × sub-score).
- Cash flow +30.0/30.0
- 1% rule +10.0/10.0
- DSCR +10.0/10.0
- ARV discount +7.5/15.0
- Schools +3.2/10.0
- Livability +2.8/5.0
- Rent growth +2.5/5.0
- Condition / age +2.5/5.0
- Appreciation +0.0/10.0
$65,000
🖨 Deal sheet (PDF) 📄 Offer letter ✓ Due diligence
Listing remarks MLS
Spacious 1.5-story two-family home on Front St in Medford?full of potential and ready for your vision! Built in 1900, this property offers a total of 6 bedrooms and 2 baths, featuring a lower unit with 2 bedrooms and 1 bath and an upper unit with 4 bedrooms and 1 bath. Situated on a 0.14-acre lot, the home includes an unfinished basement, an attached 2-car garage, and an additional detached 2-car garage with loft. Additional features include a cozy fireplace, walk-in closets, carpet & hardwood flooring , an unpaved driveway, and more. The spacious yard provides room for outdoor enjoyment. With a flexible layout and ample space, this is a fantastic opportunity for investors or owner-occupants looking to customize a multi-family property in a central location.
Key facts
- Two kitchens
- Formal dining space
- Main floor laundry
Tags
Property features AI
Exterior
- Parking: Attached and detached garage space for 4+ cars (total 4 garage parking spaces)
- Utilities: Municipal sewer; Well water; Electric power; LP gas
- Home design: 1.5-story single-family home
- Construction: Metal roof
- Exterior features: Vinyl and other exterior finishes; Lot size approximately 0.14 acre
Interior
- Kitchen: Refrigerator; Range/Oven; Dishwasher; Microwave
- Bedrooms: Primary bedroom (14 x 13) on the main level; Bedroom 2 (11 x 12) on the main level; Bedroom 3 (11 x 12) on the main level; Bedroom 4 (14 x 16) on the upper level; Bedroom 5 (11 x 12) on the upper level
- Bathrooms: Two full bathrooms
- Heating & cooling: Electric and LP gas heating; No cooling
- Interior features: Full poured concrete basement with stone elements; Living room (18 x 16) on the main level; Dining room (16 x 13) on the main level; Kitchen (16 x 16) on the main level
- Laundry & utility: Washer; Dryer
Neighborhood map
What this means for you Summary
Snapshot
- This is a 6-bed/2.0-bath single-family listed at $65k.
Deal economics
- At list price, monthly cash flow is $589 ($7k/yr) — positive.
- The deal already cash-flows at list — no discount required.
- Meets the 1% rule at list price ($1k rent vs $65k).
Location & tenants
- Location reads 56/100 on livability (#764 in WI) — a working-class tenant base; expect higher turnover. Strengths: cost of living A+, housing B+; Watch: crime D+, health & safety D, schools F.
- Medford Area Public School District (town): math 38% / reading 36% proficiency, ranked #210 of 342 in WI (top 61%) — families likely to look elsewhere, expect single-tenant / working-renter base with shorter leases.
- Market conditions: 44 active listings in the ZIP; 109 units permitted in Taylor County in 2024 (55 in 5+ unit buildings).
Forward outlook
- Local home prices are declining (-3.0%/yr); year-one equity from $449 of loan paydown is wiped out by about $2k of value loss. Plan a longer hold.
- Taylor County population projected at -22% by 2050 — secular population decline; favor cash flow + early exit over multi-decade hold.
- At projected returns (-3.0% appreciation + 3.0% rent growth), your $18k cash investment doubles in ~4 years — after that, you're playing with house money.
Negotiation context
- Only 12 days on market — expect competitive offers; lowballing is unlikely to land.
- 2 sale attempts with the ask held roughly flat each time — persistent listings suggest the price (not the market) is what's stuck; bring a comps-based counter.
Risks & watch-outs
- Watch-outs: built in 1900 — expect roof / HVAC / electrical / plumbing capex.
Questions for the listing agent
- Built in 1900 — when were the roof, HVAC, electrical panel, plumbing, and water heater last replaced?
- Is there a deadline driving the sale (1031 exchange, divorce, estate, relocation)? That informs how much negotiation room exists.
- Schools are F-rated, which usually means shorter tenancies and higher turnover. Who's the typical renter profile here, and what's been the actual vacancy rate?
- Crime grade is D in this area — have there been break-ins, vandalism, or insurance claims at this property in the last 3 years? What carrier currently insures it and at what premium?
- What's the average days-on-market for RENTAL listings here right now (not sales)? A rising rental-DOM trend means longer vacancies and softer asking-rent achievability than the comps imply.
- What's the recent tenant-quality profile in this submarket — average credit score on applications, eviction rate, late-payment / NSF rate, and stable-employment percentage? A property-management company in the area should have these aggregated.
- How much new for-sale + rental construction is in the pipeline within 1–3 miles? Heavy new supply typically softens prices + rents 12–24 months out; constrained supply supports both.
Investment metrics
- 1% rule
- 2.02% ✓
- Cap rate
- 17.17%
- Cash-on-cash
- 38.85%
- DSCR
- 2.73
- GRM
- 4.1
CMA / ARV
No comps found within radius.
Projected returns pro-forma
-3.0% appreciation · 3.0% rent growth · sell at horizon
- IRR
- 35.0%
- Equity multiple
- 2.48×
- Total profit
- $27,012
- Equity at exit
- $9,692
- IRR
- 41.8%
- Equity multiple
- 4.95×
- Total profit
- $71,923
- Equity at exit
- $5,620
Cash invested: $18,200 (down + closing). Projections, not guarantees.
Landlord ↔ Tenant lean methodology
- Overall (STATE)
- 73 Landlord-Friendly
- State Wisconsin
- 73 Landlord-Friendly · R+2
- County
- — inherits STATE
- City
- — inherits STATE
ZIP-level market 54451
- Home prices YoY
- -33.1%
- Active inventory
- 44
- Price-to-rent
- 4.1×
Monthly cashflow live
- Estimated rent
- $1,314 medium interval (Pro) →
- Mortgage (P&I)
- −$341
- Tax est. 1.5%
- −$81 /mo · $975/yr
- Insurance
- −$27
- HOA
- −$0
- Vacancy / Maint / Mgmt
- −$276
- Net cashflow
- $589
Break-even live
Sensitivity live
| Price | -10% $634 | -5% $612 | +0% $589 | +5% $567 | +10% $544 |
|---|---|---|---|---|---|
| Rent | -10% $485 | -5% $537 | +0% $589 | +5% $641 | +10% $693 |
| Rate | -1.0pp $622 | -0.5pp $606 | base $589 | +0.5pp $572 | +1.0pp $555 |
UW: 25.0% down · 7.5% · 30yr · 1.5% tax · 5.0% vac · 8.0% maint · 8.0% mgmt
Financing live
Cash to close
- Down payment
- $16,250
- Closing costs
- $1,950
- Reserves months
- —
- Total cash needed
- —
Loan-product check · same deal, 3 products live
Conventional
25% down · 7.5% · 30yr
- Down + closing
- —
- Monthly P&I
- —
- Monthly cashflow
- —
- DSCR
- —
- Eligible?
- —
Personal DTI + credit; lowest rate.
DSCR
20% down · 8.5% · 30yr
- Down + closing
- —
- Monthly P&I
- —
- Monthly cashflow
- —
- DSCR
- —
- Eligible?
- —
No personal income docs; deal must DSCR.
Hard money
10% down · 12.0% · 12mo
- Down + closing
- —
- Monthly P&I
- —
- Monthly cashflow
- —
- DSCR
- —
- Eligible?
- —
Short-term bridge; refi at stabilization.
Listing history 10 events
-
2026-06-21days on market $65,000 Active 12 DOM
-
2026-06-21days on market $65,000 Active 11 DOM
-
2026-06-18days on market $65,000 Active 9 DOM
-
2026-06-17days on market $65,000 Active 8 DOM
-
2026-06-16days on market $65,000 Active 7 DOM
-
2026-06-15days on market $65,000 Active 6 DOM
-
2026-06-15days on market $65,000 Active 5 DOM
-
2026-06-13days on market $65,000 Active 4 DOM
-
2026-06-12remarks 699-char remark
-
2026-06-12$65,000 Active 3 DOM
ⓘ Source: listings_history table (triggers on properties + properties_extension) + one-shot
backfill from property_details.listing_events for pre-trigger history.
Climate risk First Street
- Flood 1/10 Low FEMA zone X · 0% chance over 30 yrs
- Wildfire 3/10 Moderate
- Heat 1/10 Low 7 d/yr ≥92°F today · 13 d/yr by 30 yrs out
- Wind 1/10 Low
- Air quality 1/10 Low 0 unhealthy d/yr today · 0 by 30 yrs out
Nearby sold comps map
Loading sold comps map…
Walkable amenities ~0.75 mi
Loading nearby amenities…
Taxation est. · year 1
- Rental income
- $15,773
- − Mortgage interest
- −$3,641
- − Property taxes
- −$975
- − Insurance
- −$325
- − Repairs & maintenance
- −$1,262
- − Management
- −$1,262
- − Depreciation
- −$1,891
- Taxable income
- $6,417
- Est. tax owed @ 24.0%
- −$1,540
- After-tax cash flow
- $5,530/yr
For passive investors: Depreciation is non-cash, so a rental often shows a tax loss while cash-flowing — sheltering income. Rental losses are passive: they offset passive income freely, and up to $25,000/yr can offset ordinary (W-2) income if you actively participate and your MAGI is under $100k (phasing out to $0 by $150k); unused losses carry forward. On sale, claimed depreciation is recaptured at up to 25%, and gains may owe capital-gains tax (a 1031 exchange can defer both). Figures are a year-1 estimate at your 24.0% rate — not tax advice; consult a CPA.
Schools (NCES district)
- District
- Medford Area Public School District
- NCES district ID
- 5508940
- Math proficiency
- 38% ▼ -5.00%
- Reading proficiency
- 36% ▼ -7.00%
- Median HH income
- $46,851
- Composite
- 31.72/100
- National rank
- #5912
- State rank
- #210 of 342 in WI
Livability — Chelsea
- Score
- 56/100
- State rank
- #764
- US rank
- #23003
Category grades
Schools grade is shown separately in the Schools card above.
Census & demographics
- Census place
- Chelsea, WI
- Population (ZIP)
- 11,051
Population outlook (Taylor County) Hauer SSP2
- Today (2025)
- 19,681 people
- By 2030
- 19,005 · -3.4%
- By 2040
- 17,386 · -11.7%
- By 2050
- 15,349 · -22.0%
- By 2075
- 11,894 · -39.6%
- By 2100
- 9,275 · -52.9%
Race, ethnicity, and origin ACS 2023
- Neighborhood character
- Predominantly White (95%)
- Race & ethnicity
- White 95% Two or more races 3% Hispanic / Latino 2%
- Common ancestry
- Romanian 9% Portuguese 8% Lithuanian 2%
- Foreign-born
- 1% · Canada
- Languages at home
- 97% English-only · German/W. Germanic 2% Spanish 1%
Political lean MEDSL · Taylor
- 2024 margin
- Solid R (+48.2) · D 25.3% · R 73.5% · Other 1.2%
- 2008→2024 swing
- -48.0pp toward R · 2008: -0.2pp · 2024: -48.2pp
- All cycles
- 2024: R+48.2 2020: R+46.5 2016: R+44.5 2012: R+19.4 2008: R+0.2
Not yet ingested
- Civics
- —
Market trends
- HPI YoY
- ▼ -94.46%
- Current HPI
- 190.8364
- Rent YoY
- —
- Metro
- —
- State GDP YoY
- ▲ 2.10%
- F500 in state
- 20
Industry mix (Fortune 500 HQ in WI)
| Industry | F500 HQs | Revenue |
|---|---|---|
| Industrial Machinery | 4 | $23B |
|
||
| Industrial Technology | 2 | $36B |
|
||
| Insurance | 1 | $36B |
|
||
| Professional Services | 1 | $19B |
|
||
| Utilities | 1 | $9B |
|
||
| Consumer Goods | 1 | $3B |
|
||
Price history
+18.2% since first listed8 events — show timeline
- 2026-06-09 Listed $65,000 CWMLS
- 2026-03-24 Listing Removed — CWMLS
- 2026-03-09 Price Changed $75,000 CWMLS
- 2026-02-16 Price Changed $84,900 CWMLS
- 2026-01-19 Listed $99,900 CWMLS
- 2023-06-30 Sold (Public Records) $100,000 Public Records
- 2021-07-01 Sold (Public Records) $47,500 Public Records
- 2017-12-18 Sold (Public Records) $55,000 Public Records
Property tax history
+9.0%/yrLatest (2025): $4,165 · +10.6% YoY. Source: county tax records.
Cash-flow waterfall
monthlySold comps — $/sqft
last 12 mo · ≤1 miLoading sold comps…