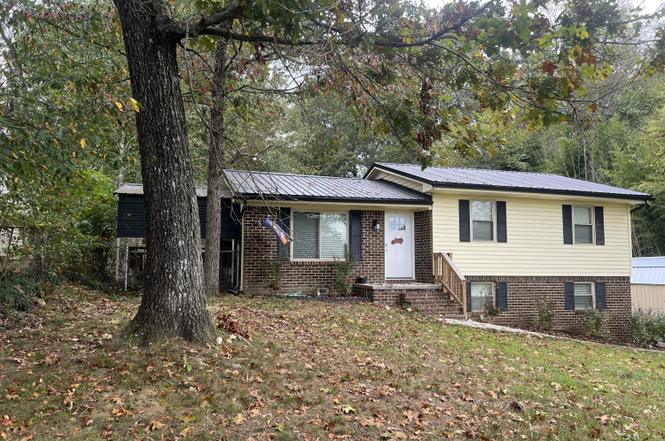
380 SE Oakland Trl · South Cleveland, TN
Flood risk 1/10 · Minimal
- FEMA flood zone
- X (unshaded)
- Chance of flooding over 30 yrs
- 0.0%
- Est. flood insurance / yr
- $473 – $860
Fire risk 3/10 · Minor
- Est. fire insurance / yr
- $949 – $1,763
Heat risk 6/10 · Moderate
- Hot days now (above 104°F)
- 7 days/yr
- Hot days in 30 yrs
- 19 days/yr
Wind risk 3/10 · Minor
- Chance of severe wind over 30 yrs
- 8.0%
Air-quality risk 3/10 · Minor
- Unhealthy air days now
- 2 days/yr
- Unhealthy air days in 30 yrs
- 2 days/yr
Risk factors via First Street. Map © Google.
Why this score? — see what drove the F grade
The composite is a weighted blend of 9 inputs, each scored 0–100. Each bar is that input's sub-score; the figure is the points it added to the 100-point composite (weight × sub-score).
- Cash flow +13.7/30.0
- DSCR +4.1/10.0
- Livability +3.2/5.0
- Schools +3.0/10.0
- 1% rule +2.6/10.0
- Rent growth +2.5/5.0
- Condition / age +2.5/5.0
- ARV discount +2.2/15.0
- Appreciation +0.0/10.0
$239,900
🖨 Deal sheet (PDF) 📄 Offer letter ✓ Due diligence
Listing remarks
Welcome to 380 Oakland Trail SE, a beautifully updated tri level home in the heart of Cleveland. With 4 bedrooms and 2 full bathrooms across 1,500 sq ft, this property blends modern updates with everyday comfort. Comprehensive renovations were completed in early 2024, including a new roof, gutters, siding, and soffit, along with a new HVAC system and ductwork. Inside, you'll find new flooring, cabinets, countertops, appliances, interior and exterior doors, updated plumbing, fixtures, and lighting throughout. In late 2024, the sellers added a second septic tank with pump and an all new drain field, providing long term peace of mind. The main level features an open living room, dining area, a
Key facts
- New flooring
- New cabinets
- New countertops
Tags
Neighborhood map
What this means for you Summary
Snapshot
- This is a 4-bed/2.0-bath single-family listed at $240k.
Deal economics
- At list price, monthly cash flow is $17 ($203/yr) — positive.
- The deal already cash-flows at list — no discount required.
- To meet the 1% rule (rent ≥ 1% of price), the offer needs to be $181k (24.4% below list).
- Recommended offer: $181k (24.4% below list) — sets the bar for 1% rule.
- Cap rate 6.4% vs local median 3.6% in South Cleveland — top-decile yield for the area; either an underpriced asset or a hidden risk that comps aren't pricing in. Stress-test before assuming the spread holds.
Location & tenants
- Location reads 63/100 on livability (#201 in TN) — a middle-class / working-renter tenant base. Strengths: cost of living A+, housing A+; Watch: health & safety C-, employment D, crime F.
- Bradley County (other): math 35% / reading 34% proficiency, ranked #33 of 139 in TN (top 24%) — families likely to look elsewhere, expect single-tenant / working-renter base with shorter leases.
- Zoned schools: Black Fox Elementary School (math 45% / reading 38%, grade F, #212 of 952 statewide, top 22%, 510 students, 0% FRL); Lake Forest Middle School (math 32% / reading 26%, grade F, #110 of 333 statewide, top 34%, 1,127 students, 0% FRL); Bradley Central High School (math 13% / reading 31%, grade F, #163 of 332 statewide, top 51%, 1,677 students, 0% FRL) — zoned schools average 0% FRL vs 46% district-wide (46 pts lower); this property's tenant base skews higher-income than the district average.
- Market conditions: 374 active listings in the ZIP; 768 units permitted in Bradley County in 2024 (0 in 5+ unit buildings).
- This rent runs 32% of the median local income ($69k/yr) — at the standard rent-burdened threshold; future hikes will face affordability resistance.
Forward outlook
- Local home prices are declining (-3.0%/yr); year-one equity from $2k of loan paydown is wiped out by about $7k of value loss. Plan a longer hold.
- Bradley County population projected at +21% by 2050 — long-run rental-demand tailwind backs the buy-and-hold thesis.
Negotiation context
- It's been on market 170 days — a 12% lower offer ($211k) is reasonable based on typical stale-listing flexibility.
- 9 sale attempts since 3y ago; this cycle's ask is 33% above the opening price — seller raised mid-cycle; expect resistance to lowballs.
Risks & watch-outs
- Climate carrying-cost: extreme-heat days projected 7→19/yr by 2055 (HVAC capex compounding) — expect insurance premiums to compound above CPI over the hold.
Questions for the listing agent
- It's been on market 170 days. Have you received any prior offers? Is the seller open to a 24% concession, seller financing, or rate buy-down credit?
- Built in 1970 — when were the roof, HVAC, electrical panel, plumbing, and water heater last replaced?
- Why hasn't it sold? Are there any deal-killer items the seller is aware of (foundation, flood, title, zoning, code violations)?
- Is there a deadline driving the sale (1031 exchange, divorce, estate, relocation)? That informs how much negotiation room exists.
- Schools are F-rated, which usually means shorter tenancies and higher turnover. Who's the typical renter profile here, and what's been the actual vacancy rate?
- Crime grade is F in this area — have there been break-ins, vandalism, or insurance claims at this property in the last 3 years? What carrier currently insures it and at what premium?
- The area grade is low — what's the realistic commute time and amenity access for the typical tenant pool here? Any planned neighborhood developments (good or bad) we should know about?
- What's the average days-on-market for RENTAL listings here right now (not sales)? A rising rental-DOM trend means longer vacancies and softer asking-rent achievability than the comps imply.
- What's the recent tenant-quality profile in this submarket — average credit score on applications, eviction rate, late-payment / NSF rate, and stable-employment percentage? A property-management company in the area should have these aggregated.
- How much new for-sale + rental construction is in the pipeline within 1–3 miles? Heavy new supply typically softens prices + rents 12–24 months out; constrained supply supports both.
Investment metrics
- 1% rule
- 0.76% ✗
- Cap rate
- 6.38%
- Cash-on-cash
- 0.30%
- DSCR
- 1.01
- GRM
- 11.0
CMA / ARV
- ARV (on-the-fly)
- $214,812
- Comps found
- 12
Show comp detail 12 sales within ~0.75 mi
| Address | Dist | Beds/Ba | Sqft | Sold | Price | $/sf | Match |
|---|---|---|---|---|---|---|---|
| 1435 Timber Hill Ln SE | 0.54mi | 3/1.0 (-1) | 972 (0%) | 2mo | $257,000 | $264 | 64 |
| 265 SE Oakland Trl | 0.16mi | 3/1.0 (-1) | 1,008 (+4%) | 20mo | $185,000 | $184 | 61 |
| 3477 Crawford Dr SE | 0.47mi | 3/1.0 (-1) | 1,014 (+4%) | 3mo | $215,500 | $213 | 60 |
| 3610 King Ct SE | 0.62mi | 3/1.0 (-1) | 950 (-2%) | 2mo | $210,000 | $221 | 56 |
| 3610 King Ct | 0.62mi | 3/1.0 (-1) | 950 (-2%) | 2mo | $210,000 | $221 | 56 |
| 3330 Archer Ln SE | 0.33mi | 3/1.0 (-1) | 1,050 (+8%) | 8mo | $140,000 | $133 | 55 |
| 2860 Mcdaris Cir SE | 0.22mi | 3/2.5 (-1) | 1,104 (+14%) | 8mo | $270,000 | $245 | 54 |
| 3476 Crawford Dr SE | 0.47mi | 3/1.0 (-1) | 1,008 (+4%) | 16mo | $224,900 | $223 | 49 |
| 2226 Buchanan Rd SE | 0.74mi | 3/2.0 (-1) | 950 (-2%) | 13mo | $190,000 | $200 | 46 |
| 3298 Trewhitt Rd SE | 0.72mi | 3/2.0 (-1) | 1,056 (+9%) | 12mo | $239,900 | $227 | 37 |
| 2230 Buchanan Rd SE | 0.74mi | 3/2.0 (-1) | 846 (-13%) | 14mo | $215,000 | $254 | 28 |
| 1980 Woodlawn St | 0.75mi | 3/1.0 (-1) | 1,100 (+13%) | 11mo | $241,000 | $219 | 25 |
Match score weights: distance 35% · size 25% · config 20% · recency 20%. Top-matched comps best support the ARV.
Projected returns pro-forma
-3.0% appreciation · 3.0% rent growth · sell at horizon
- IRR
- -15.9%
- Equity multiple
- 0.44×
- Total profit
- $-37,918
- Equity at exit
- $35,770
- IRR
- -7.6%
- Equity multiple
- 0.52×
- Total profit
- $-32,122
- Equity at exit
- $20,742
Cash invested: $67,172 (down + closing). Projections, not guarantees.
Landlord ↔ Tenant lean methodology
- Overall (STATE)
- 87 Strongly Landlord-Friendly
- State Tennessee
- 87 Strongly Landlord-Friendly · R+13
- County
- — inherits STATE
- City
- — inherits STATE
ZIP-level market 37323
- Home prices YoY
- -23.5%
- Active inventory
- 374
- Price-to-rent
- 11.0×
Monthly cashflow live
- Estimated rent
- $1,814 medium interval (Pro) →
- Mortgage (P&I)
- −$1,258
- Tax from tax record
- −$58 /mo · $701/yr
- Insurance
- −$100
- HOA
- −$0
- Vacancy / Maint / Mgmt
- −$381
- Net cashflow
- $17
Break-even live
Sensitivity live
| Price | -10% $153 | -5% $85 | +0% $17 | +5% $-51 | +10% $-119 |
|---|---|---|---|---|---|
| Rent | -10% $-126 | -5% $-55 | +0% $17 | +5% $89 | +10% $160 |
| Rate | -1.0pp $138 | -0.5pp $78 | base $17 | +0.5pp $-45 | +1.0pp $-108 |
UW: 25.0% down · 7.5% · 30yr · 1.5% tax · 5.0% vac · 8.0% maint · 8.0% mgmt
Financing live
Cash to close
- Down payment
- $59,975
- Closing costs
- $7,197
- Reserves months
- —
- Total cash needed
- —
Loan-product check · same deal, 3 products live
Conventional
25% down · 7.5% · 30yr
- Down + closing
- —
- Monthly P&I
- —
- Monthly cashflow
- —
- DSCR
- —
- Eligible?
- —
Personal DTI + credit; lowest rate.
DSCR
20% down · 8.5% · 30yr
- Down + closing
- —
- Monthly P&I
- —
- Monthly cashflow
- —
- DSCR
- —
- Eligible?
- —
No personal income docs; deal must DSCR.
Hard money
10% down · 12.0% · 12mo
- Down + closing
- —
- Monthly P&I
- —
- Monthly cashflow
- —
- DSCR
- —
- Eligible?
- —
Short-term bridge; refi at stabilization.
Listing history 29 events
-
2026-03-15status Pending
-
2026-01-17price $239,900
-
2025-12-03historical
-
2025-12-03$180,000
-
2025-12-01historical
-
2025-12-01$180,000
-
2025-12-01$119,900
-
2025-11-04price $245,000
-
2025-10-27price $263,500
-
2025-10-20price $270,000
-
2025-10-10price $275,000
-
2025-09-27$290,000 Active
-
2024-09-16soldstatus $259,000
-
2024-09-15$259,900
-
2024-06-21soldstatus $259,000 Closed
-
2024-06-21soldstatus $259,000
-
2024-06-21soldstatus $259,000
-
2024-05-03historical Active Under Contract
-
2024-04-22$259,900 Active
-
2024-02-02soldstatus $119,900
-
2024-02-02soldstatus $119,900 Closed
-
2024-02-02soldstatus $119,900 Closed
-
2024-02-02soldstatus $119,900
-
2024-01-24status Pending
-
2024-01-24status Pending
-
2024-01-24$119,900 Active
-
2024-01-24$119,900 Active
-
2023-10-23price $180,000
-
2023-10-16$180,000
ⓘ Source: listings_history table (triggers on properties + properties_extension) + one-shot
backfill from property_details.listing_events for pre-trigger history.
Tax reassessment forecast TN · Resets to sale price
- Current annual tax
- $701 · $58/mo
- Projected year-2 tax
- $1,703 · $142/mo
- Expected delta
- +$1,002/yr (+$84/mo · 143.0%)
ⓘ Screening estimate from a state-policy table — verify with the county assessor before closing.
Climate risk First Street
- Flood 1/10 Low FEMA zone X (unshaded) · 0% chance over 30 yrs
- Wildfire 3/10 Moderate
- Heat 6/10 Major 7 d/yr ≥104°F today · 19 d/yr by 30 yrs out
- Wind 3/10 Moderate 8% chance of damaging wind over 30 yrs
- Air quality 3/10 Moderate 2 unhealthy d/yr today · 2 by 30 yrs out
Nearby sold comps map
Loading sold comps map…
Walkable amenities ~0.75 mi
Loading nearby amenities…
Taxation est. · year 1
- Rental income
- $21,772
- − Mortgage interest
- −$13,438
- − Property taxes
- −$701
- − Insurance
- −$1,200
- − Repairs & maintenance
- −$1,742
- − Management
- −$1,742
- − Depreciation
- −$6,979
- Taxable loss
- −$4,029
- Est. tax savings @ 24.0%
- +$967
- After-tax cash flow
- $1,170/yr
For passive investors: Depreciation is non-cash, so a rental often shows a tax loss while cash-flowing — sheltering income. Rental losses are passive: they offset passive income freely, and up to $25,000/yr can offset ordinary (W-2) income if you actively participate and your MAGI is under $100k (phasing out to $0 by $150k); unused losses carry forward. On sale, claimed depreciation is recaptured at up to 25%, and gains may owe capital-gains tax (a 1031 exchange can defer both). Figures are a year-1 estimate at your 24.0% rate — not tax advice; consult a CPA.
Schools (NCES district)
- District
- Bradley County
- NCES district ID
- 4700330
- Math proficiency
- 35% ▼ -5.00%
- Reading proficiency
- 34% ▼ -2.00%
- Median HH income
- $45,807
- Composite
- 29.54/100
- National rank
- #6494
- State rank
- #33 of 139 in TN
Livability — South Cleveland
- Score
- 63/100
- State rank
- #201
- US rank
- #15753
Category grades
Schools grade is shown separately in the Schools card above.
Census & demographics
- Census place
- South Cleveland, TN
- County
- Bradley County · 99,337 people
- City population
- 31,043
- Metro
- Cleveland, TN
- Population (ZIP)
- 31,948
- Household income
- $68,768
- Rent vs Own
- Severe rent burden
- 371.0
Population outlook (Bradley County) Hauer SSP2
- Today (2025)
- 114,901 people
- By 2030
- 120,137 · +4.6%
- By 2040
- 130,125 · +13.2%
- By 2050
- 139,257 · +21.2%
- By 2075
- 161,664 · +40.7%
- By 2100
- 179,767 · +56.5%
Race, ethnicity, and origin ACS 2023
- Neighborhood character
- Predominantly White (88%)
- Race & ethnicity
- White 88% Hispanic / Latino 7% Two or more races 6% Black 1%
- Hispanic origin (detail)
- Mexican 4% Puerto Rican 1%
- Common ancestry
- Lithuanian 2% Subsaharan African 2% Italian 1%
- Foreign-born
- 4% · Canada
- Languages at home
- 93% English-only · Spanish 5% Russian/Polish/Slavic 2%
Political lean MEDSL · Bradley
- 2024 margin
- Solid R (+58.9) · D 20.0% · R 78.9% · Other 1.1%
- 2008→2024 swing
- -9.2pp toward R · 2008: -49.7pp · 2024: -58.9pp
- All cycles
- 2024: R+58.9 2020: R+55.3 2016: R+59.1 2012: R+53.9 2008: R+49.7
Not yet ingested
- Civics
- —
Market trends
- HPI YoY
- ▼ -88.38%
- Current HPI
- 287.3643
- Rent YoY
- —
- Metro
- Cleveland, TN
- State GDP YoY
- ▲ 2.78%
- F500 in state
- 22
Industry mix (Fortune 500 HQ in TN)
| Industry | F500 HQs | Revenue |
|---|---|---|
| Healthcare | 3 | $91B |
|
||
| Retail | 3 | $72B |
|
||
| Transportation / Logistics | 1 | $88B |
|
||
| Paper / Packaging | 1 | $19B |
|
||
| Insurance | 1 | $13B |
|
||
| Energy | 1 | $12B |
|
||
Price history
+33.3% since first listed29 events — show timeline
- 2026-03-15 Pending — GCAR
- 2026-01-17 Price Changed $239,900 GCAR
- 2025-12-03 Listing Removed — REALTRACS as Distributed by MLS Grid
- 2025-12-03 Listed $180,000 REALTRACS as Distributed by MLS Grid
- 2025-12-01 Listing Removed — REALTRACS as Distributed by MLS Grid
- 2025-12-01 Listed $180,000 REALTRACS as Distributed by MLS Grid
- 2025-12-01 Listed $119,900 REALTRACS as Distributed by MLS Grid
- 2025-11-04 Price Changed $245,000 GCAR
- 2025-10-27 Price Changed $263,500 GCAR
- 2025-10-20 Price Changed $270,000 GCAR
- 2025-10-10 Price Changed $275,000 GCAR
- 2025-09-27 Listed $290,000 GCAR
- 2024-09-16 Sold (MLS) $259,000 GCAR
- 2024-09-15 Listed $259,900 GCAR
- 2024-06-21 Sold (Public Records) $259,000 Public Records
- 2024-06-21 Sold (MLS) $259,000 REALTRACS as Distributed by MLS Grid
- 2024-06-21 Sold (MLS) $259,000 RCAOR
- 2024-05-03 Contingent — RCAOR
- 2024-04-22 Listed $259,900 RCAOR
- 2024-02-02 Sold (Public Records) $119,900 Public Records
- 2024-02-02 Sold (MLS) $119,900 RCAOR
- 2024-02-02 Sold (MLS) $119,900 GCAR
- 2024-02-02 Sold (MLS) $119,900 REALTRACS as Distributed by MLS Grid
- 2024-01-24 Pending — GCAR
- 2024-01-24 Pending — RCAOR
- 2024-01-24 Listed $119,900 GCAR
- 2024-01-24 Listed $119,900 RCAOR
- 2023-10-23 Price Changed $180,000 GCAR
- 2023-10-16 Listed $180,000 RCAOR
Property tax history
+3.8%/yrLatest (2025): $701 · +44.8% YoY. Source: county tax records.
Cash-flow waterfall
monthlySold comps — $/sqft
last 12 mo · ≤1 miLoading sold comps…