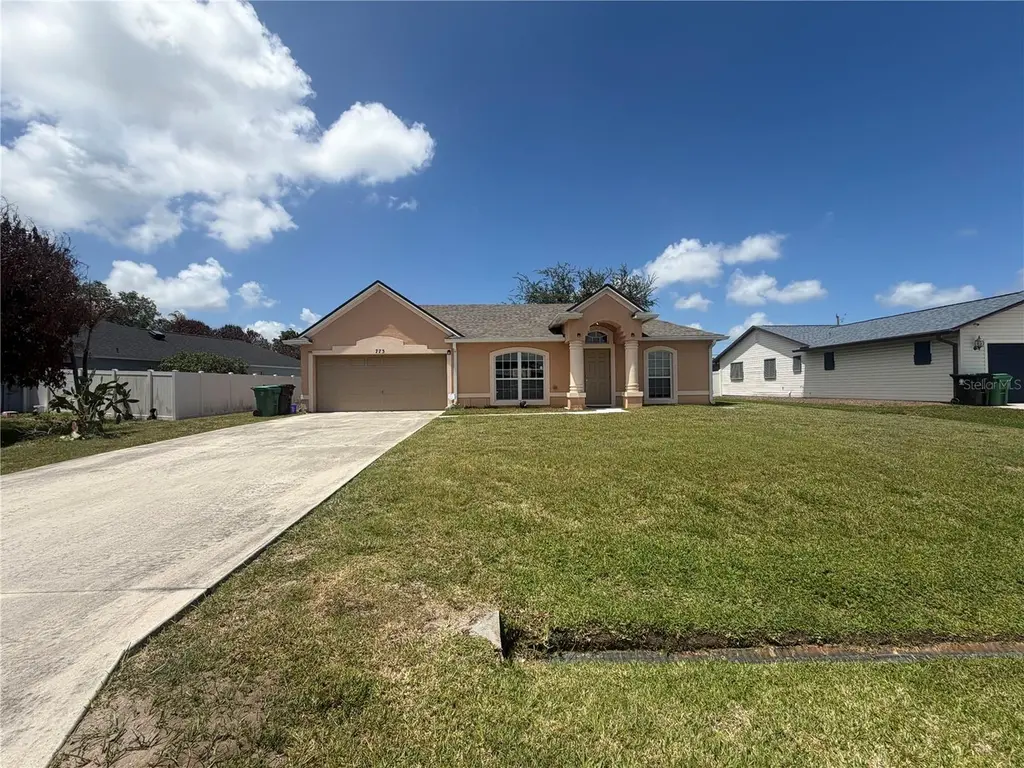
773 NW Biscayne Dr · Port St. Lucie, FL
Flood risk 1/10 · Minimal
- FEMA flood zone
- X (unshaded)
- Chance of flooding over 30 yrs
- 0.0%
- Est. flood insurance / yr
- $507 – $1,088
Fire risk 1/10 · Minimal
- Est. fire insurance / yr
- $947 – $1,759
Heat risk 10/10 · Severe
- Hot days now (above 106°F)
- 7 days/yr
- Hot days in 30 yrs
- 24 days/yr
Wind risk 10/10 · Severe
- Chance of severe wind over 30 yrs
- 99.0%
Air-quality risk 1/10 · Minimal
- Unhealthy air days now
- 0 days/yr
- Unhealthy air days in 30 yrs
- 0 days/yr
Risk factors via First Street. Map © Google.
Why this score? — see what drove the D grade
The composite is a weighted blend of 9 inputs, each scored 0–100. Each bar is that input's sub-score; the figure is the points it added to the 100-point composite (weight × sub-score).
- Cash flow +13.6/30.0
- ARV discount +9.5/15.0
- DSCR +4.1/10.0
- Schools +3.7/10.0
- Rent growth +2.9/5.0
- 1% rule +2.6/10.0
- Livability +2.5/5.0
- Condition / age +2.5/5.0
- Appreciation +0.0/10.0
$350,000
🖨 Deal sheet (PDF) 📄 Offer letter ✓ Due diligence
Listing remarks MLS
GREAT LOCATION NEAR NEW HOMES, BETWEEN ST. LUCIE WEST SHOPPING AND ST. JAMES AREA.
Key facts
- Expansive backyard
- Large living areas
- 0.23 acre lot
Tags
Property features AI
Finance
- Other: Property type: Residential; Property subtype: Single Family Residence; Zoning: RS-2 PSL; Living area reported as 1,420 sq ft (public records); Building area reported as 2,022 sq ft (public records)
- Financial info: No lease restrictions
- HOA & community: Street lights; Pets allowed (cats and dogs)
Exterior
- Parking: Driveway; Attached garage with automatic door opener; 2-car garage
- Security: Smoke detectors
- Utilities: Public sewer; Water available; Electricity available; Cable available; Additional water information: see remarks
- Home design: Single family residence; One story; Northwest facing; Completed condition; Homestead exempt
- Construction: Block and concrete construction; Shingle roof; Slab foundation; Built on lot of approximately 0.23 acres
- Exterior features: Covered patio; Patio; Porch; Screened porch; Side porch; Balcony; Hurricane shutters; Private mailbox; Sliding doors; Gentle sloping lot; Landscaped with trees; Asphalt road access
Interior
- Kitchen: Microwave; Range; Range hood; Refrigerator; Solid surface counters; Eat-in kitchen
- Bedrooms: 3 bedrooms
- Flooring: Carpet; Ceramic tile
- Bathrooms: 2 full bathrooms
- Heating & cooling: Electric heat; Central air conditioning
- Interior features: Cathedral ceilings; Eat-in kitchen; High ceilings; Living room / dining room combo; Solid surface counters; Thermostat; Walk-in closets; Great Room
- Laundry & utility: Washer hookup; Electric dryer hookup; Laundry in garage; Electric water heater; Generator
Neighborhood map
What this means for you Summary
Snapshot
- This is a 3-bed/2.0-bath single-family listed at $350k.
Deal economics
- At list price, monthly cash flow is $19 ($230/yr) — positive.
- The deal already cash-flows at list — no discount required.
- To meet the 1% rule (rent ≥ 1% of price), the offer needs to be $267k (23.6% below list).
- Recommended offer: $267k (23.6% below list) — sets the bar for 1% rule.
- Cap rate 6.4% vs local median 3.9% in Port St. Lucie — top-decile yield for the area; either an underpriced asset or a hidden risk that comps aren't pricing in. Stress-test before assuming the spread holds.
Location & tenants
- Location reads: area grade D — affects rentability + tenant quality, not the cash-flow math above.
- St. Lucie (urban): math 40% / reading 48% proficiency, ranked #51 of 73 in FL (top 70%) — families likely to look elsewhere, expect single-tenant / working-renter base with shorter leases.
- Zoned schools: Manatee Academy K-8 (math 53% / reading 51%, grade C-, #990 of 2,144 statewide, top 48%, 1,664 students, 65% FRL); Southern Oaks Middle School (math 39% / reading 43%, grade F, #353 of 571 statewide, top 63%, 894 students, 76% FRL); Fort Pierce Central High School (math 15% / reading 45%, grade F, #441 of 667 statewide, top 67%, 3,091 students, 62% FRL).
- Market conditions: Rents rising (+1.5%/yr); 359 active listings in the ZIP; 24 comparable units currently listed for rent nearby; rentals at typical pace (median 23d on market — plan ~3-4 weeks tenant-placement turnaround); solid renter incomes; 4,868 units permitted in St. Lucie County in 2024 (268 in 5+ unit buildings).
- This rent runs 43% of the median local income ($75k/yr) — at the standard rent-burdened threshold; future hikes will face affordability resistance.
Forward outlook
- Local home prices are declining (-3.0%/yr); year-one equity from $2k of loan paydown is wiped out by about $10k of value loss. Plan a longer hold.
- St. Lucie County population projected at +20% by 2050 — long-run rental-demand tailwind backs the buy-and-hold thesis.
Negotiation context
- Only 5 days on market — expect competitive offers; lowballing is unlikely to land.
- 8 sale attempts since 25y ago with the ask held roughly flat each time — persistent listings suggest the price (not the market) is what's stuck; bring a comps-based counter.
- Current owner paid $17k; list at $350k implies a 1959% gain — meaningful room to come down on a strong offer.
Risks & watch-outs
- Climate carrying-cost: severe wind risk, 99% chance of damaging wind over 30y; extreme-heat days projected 7→24/yr by 2055 (HVAC capex compounding) — expect insurance premiums to compound above CPI over the hold.
Questions for the listing agent
- Is there a deadline driving the sale (1031 exchange, divorce, estate, relocation)? That informs how much negotiation room exists.
- The area grade is low — what's the realistic commute time and amenity access for the typical tenant pool here? Any planned neighborhood developments (good or bad) we should know about?
- What's the average days-on-market for RENTAL listings here right now (not sales)? A rising rental-DOM trend means longer vacancies and softer asking-rent achievability than the comps imply.
- What's the recent tenant-quality profile in this submarket — average credit score on applications, eviction rate, late-payment / NSF rate, and stable-employment percentage? A property-management company in the area should have these aggregated.
- How much new for-sale + rental construction is in the pipeline within 1–3 miles? Heavy new supply typically softens prices + rents 12–24 months out; constrained supply supports both.
Investment metrics
- 1% rule
- 0.76% ✗
- Cap rate
- 6.36%
- Cash-on-cash
- 0.23%
- DSCR
- 1.01
- GRM
- 10.9
CMA / ARV
- ARV (on-the-fly)
- $366,360
- Comps found
- 12
Show comp detail 12 sales within ~0.75 mi
| Address | Dist | Beds/Ba | Sqft | Sold | Price | $/sf | Match |
|---|---|---|---|---|---|---|---|
| 331 NW Dearman St | 0.22mi | 3/2.0 | 1,480 (+4%) | 1mo | $359,000 | $243 | 82 |
| 397 NW Biltmore St | 0.11mi | 3/2.0 | 1,244 (-12%) | 4mo | $335,000 | $269 | 71 |
| 549 NW Portofino Ln | 0.45mi | 2/2.0 (-1) | 1,276 (-10%) | 1mo | $249,000 | $195 | 56 |
| 537 NW Biscayne Dr | 0.45mi | 3/2.0 | 1,607 (+13%) | 2mo | $310,000 | $193 | 56 |
| 533 NW Avon Ave | 0.63mi | 3/2.0 | 1,292 (-9%) | 1mo | $240,000 | $186 | 55 |
| 582 NW Cornell Ave | 0.51mi | 3/2.0 | 1,347 (-5%) | 17mo | $355,000 | $264 | 54 |
| 118 NW Carmelite St | 0.51mi | 3/2.0 | 1,290 (-9%) | 10mo | $350,000 | $271 | 53 |
| 333 NW Granadeer St | 0.53mi | 3/2.0 | 1,552 (+9%) | 10mo | $400,000 | $258 | 51 |
| 590 NW Cortina Ln | 0.63mi | 2/2.0 (-1) | 1,524 (+7%) | 12mo | $285,000 | $187 | 44 |
| 187 NW Willow Grove Ave | 0.46mi | 2/2.0 (-1) | 1,539 (+8%) | 21mo | $429,000 | $279 | 42 |
| 126 NW Carmelite St | 0.50mi | 3/2.0 | 1,236 (-13%) | 21mo | $360,000 | $291 | 38 |
| 865 NW Sorrento Ln | 0.73mi | 2/2.0 (-1) | 1,585 (+12%) | 18mo | $300,000 | $189 | 26 |
Match score weights: distance 35% · size 25% · config 20% · recency 20%. Top-matched comps best support the ARV.
Projected returns pro-forma
-3.0% appreciation · 1.53% rent growth · sell at horizon
- IRR
- -17.4%
- Equity multiple
- 0.39×
- Total profit
- $-59,552
- Equity at exit
- $52,186
- IRR
- -12.2%
- Equity multiple
- 0.32×
- Total profit
- $-66,466
- Equity at exit
- $30,262
Cash invested: $98,000 (down + closing). Projections, not guarantees.
Landlord ↔ Tenant lean methodology
- Overall (STATE)
- 87 Strongly Landlord-Friendly
- State Florida
- 87 Strongly Landlord-Friendly · R+3
- County
- — inherits STATE
- City
- — inherits STATE
ZIP-level market 34983
- Home prices YoY
- -33.9%
- Rents YoY
- 1.5%
- Active inventory
- 359
- Price-to-rent
- 10.9×
Monthly cashflow live
- Estimated rent
- $2,675 high interval (Pro) →
- Mortgage (P&I)
- −$1,835
- Tax from tax record
- −$113 /mo · $1,350/yr
- Insurance
- −$146
- HOA
- −$0
- Vacancy / Maint / Mgmt
- −$562
- Net cashflow
- $19
Break-even live
Sensitivity live
| Price | -10% $217 | -5% $118 | +0% $19 | +5% $-80 | +10% $-179 |
|---|---|---|---|---|---|
| Rent | -10% $-192 | -5% $-86 | +0% $19 | +5% $125 | +10% $230 |
| Rate | -1.0pp $195 | -0.5pp $108 | base $19 | +0.5pp $-72 | +1.0pp $-164 |
UW: 25.0% down · 7.5% · 30yr · 1.5% tax · 5.0% vac · 8.0% maint · 8.0% mgmt
Financing live
Cash to close
- Down payment
- $87,500
- Closing costs
- $10,500
- Reserves months
- —
- Total cash needed
- —
Loan-product check · same deal, 3 products live
Conventional
25% down · 7.5% · 30yr
- Down + closing
- —
- Monthly P&I
- —
- Monthly cashflow
- —
- DSCR
- —
- Eligible?
- —
Personal DTI + credit; lowest rate.
DSCR
20% down · 8.5% · 30yr
- Down + closing
- —
- Monthly P&I
- —
- Monthly cashflow
- —
- DSCR
- —
- Eligible?
- —
No personal income docs; deal must DSCR.
Hard money
10% down · 12.0% · 12mo
- Down + closing
- —
- Monthly P&I
- —
- Monthly cashflow
- —
- DSCR
- —
- Eligible?
- —
Short-term bridge; refi at stabilization.
Rent comps 24 comps
| Address | Beds | Baths | Sqft | Rent | $/sqft | DOM | Units | Dist |
|---|---|---|---|---|---|---|---|---|
| 367 NW Aurora St Port Saint Lucie, FL | 2.0 | 1.0 | 940 | $2,050 | $2.18 | 15d | 1 | 0.23mi |
| 574 NW Bayshore Blvd Port Saint Lucie, FL | 4.0 | 2.0 | 1806 | $2,850 | $1.58 | 25d | 1 | 0.32mi |
| 185 NW Willow Grove Ave Port Saint Lucie, FL | 2.0 | 2.0 | 1539 | $2,600 | $1.69 | 25d | 1 | 0.47mi |
| 134 NW Peach St Port Saint Lucie, FL | 3.0 | 2.0 | 1862 | $2,050 | $1.10 | 15d | 1 | 0.50mi |
| 581 NW Cornell Ave Port Saint Lucie, FL | 3.0 | 2.0 | 1035 | $2,600 | $2.51 | 25d | 1 | 0.53mi |
| 702 NW Orchid St Port Saint Lucie, FL | 3.0 | 2.0 | 1499 | $3,500 | $2.33 | 25d | 1 | 0.56mi |
| 365 NW Hibiscus St Port Saint Lucie, FL | 4.0 | 2.0 | 1714 | $4,000 | $2.33 | 25d | 1 | 0.64mi |
| 628 NW Venetto Ct Port Saint Lucie, FL | 2.0 | 2.0 | 1819 | $2,550 | $1.40 | 15d | 1 | 0.68mi |
| 628 NW Venetto Ct Port Saint Lucie, FL | 2.0 | 2.0 | 1819 | $2,650 | $1.46 | 25d | 1 | 0.68mi |
| 385 NW Broadview St Port Saint Lucie, FL | 2.0 | 2.0 | 1500 | $2,300 | $1.53 | 25d | 1 | 0.76mi |
| 507 NW Billiar Ave Port St Lucie, FL | 3.0 | 2.0 | 1249 | $2,350 | $1.88 | 22d | 1 | 0.80mi |
| 532 SW Buswell Ave Port Saint Lucie, FL | 4.0 | 2.5 | 1629 | $2,750 | $1.69 | 25d | 1 | 0.86mi |
| 360 NW Shoreline Cir Port Saint Lucie, FL | 2.0 | 2.0 | 1661 | $3,200 | $1.93 | 25d | 1 | 0.95mi |
| 325 NW Ferris Dr Port Saint Lucie, FL | 2.0 | 2.0 | 1100 | $1,900 | $1.73 | 15d | 1 | 0.99mi |
| 351 SW Buswell Ave Port Saint Lucie, FL | 2.0 | 2.0 | 1234 | $2,200 | $1.78 | 15d | 1 | 1.01mi |
| 632 SW Granadeer St Port Saint Lucie, FL | 3.0 | 2.0 | 1618 | $2,495 | $1.54 | 15d | 1 | 1.09mi |
| 6956 NW Jorgensen Rd Port Saint Lucie, FL | 3.0 | 2.0 | 1358 | $2,500 | $1.84 | 15d | 1 | 1.15mi |
| 271 SW Palm Dr #304 Port Saint Lucie, FL | 2.0 | 2.0 | 1033 | $2,000 | $1.94 | 15d | 1 | 1.30mi |
| 421 NW Sunview Way Port Saint Lucie, FL | 3.0 | 2.0 | 1719 | $2,500 | $1.45 | 25d | 1 | 1.33mi |
| 554 SW Lakehurst Dr Port Saint Lucie, FL | 3.0 | 2.0 | 1054 | $2,100 | $1.99 | 15d | 1 | 1.38mi |
| 221 SW Palm Dr #108 Port Saint Lucie, FL | 2.0 | 2.0 | 960 | $2,000 | $2.08 | 15d | 1 | 1.39mi |
| 456 SW Prado Ave Port Saint Lucie, FL | 3.0 | 2.0 | 1376 | $2,100 | $1.53 | 15d | 1 | 1.39mi |
| 216 NE Mainsail St Port Saint Lucie, FL | 3.0 | 2.0 | 1516 | $2,550 | $1.68 | 22d | 1 | 1.40mi |
| 430 NW Lismore Ln Port Saint Lucie, FL | 2.0 | 2.0 | 1650 | $2,000 | $1.21 | 25d | 1 | 1.45mi |
Listing history 7 events
-
2026-06-05status $350,000 Pending 5 DOM
-
2026-06-03days on market $350,000 Active 5 DOM
-
2026-06-02days on market $350,000 Active 4 DOM
-
2026-06-01days on market $350,000 Active 3 DOM
-
2026-05-31days on market $350,000 Active 2 DOM
-
2026-05-30remarks 699-char remark
-
2026-05-30$350,000 Active 1 DOM
ⓘ Source: listings_history table (triggers on properties + properties_extension) + one-shot
backfill from property_details.listing_events for pre-trigger history.
Tax reassessment forecast FL · Resets to sale price
- Current annual tax
- $1,350 · $113/mo
- Projected year-2 tax
- $2,905 · $242/mo
- Expected delta
- +$1,555/yr (+$130/mo · 115.1%)
ⓘ Screening estimate from a state-policy table — verify with the county assessor before closing.
Climate risk First Street
- Flood 1/10 Low FEMA zone X (unshaded) · 0% chance over 30 yrs
- Wildfire 1/10 Low
- Heat 10/10 Extreme 7 d/yr ≥106°F today · 24 d/yr by 30 yrs out
- Wind 10/10 Extreme 99% chance of damaging wind over 30 yrs
- Air quality 1/10 Low 0 unhealthy d/yr today · 0 by 30 yrs out
Nearby sold comps map
Loading sold comps map…
Walkable amenities ~0.75 mi
Loading nearby amenities…
Taxation est. · year 1
- Rental income
- $32,096
- − Mortgage interest
- −$19,605
- − Property taxes
- −$1,350
- − Insurance
- −$1,750
- − Repairs & maintenance
- −$2,568
- − Management
- −$2,568
- − Depreciation
- −$10,182
- Taxable loss
- −$5,927
- Est. tax savings @ 24.0%
- +$1,423
- After-tax cash flow
- $1,653/yr
For passive investors: Depreciation is non-cash, so a rental often shows a tax loss while cash-flowing — sheltering income. Rental losses are passive: they offset passive income freely, and up to $25,000/yr can offset ordinary (W-2) income if you actively participate and your MAGI is under $100k (phasing out to $0 by $150k); unused losses carry forward. On sale, claimed depreciation is recaptured at up to 25%, and gains may owe capital-gains tax (a 1031 exchange can defer both). Figures are a year-1 estimate at your 24.0% rate — not tax advice; consult a CPA.
Schools (NCES district)
- District
- St. Lucie
- NCES district ID
- 1201770
- Math proficiency
- 40% ▼ -11.00%
- Reading proficiency
- 48% ▼ -4.00%
- Median HH income
- $44,737
- Composite
- 37.28/100
- National rank
- #4449
- State rank
- #51 of 73 in FL
Livability — Port St. Lucie
No livability data for this city. (Only ~50 U.S. cities are tracked.)
Census & demographics
- Census place
- Port St. Lucie, FL
- County
- Saint Lucie County · 337,150 people
- City population
- 221,051
- Metro
- Port St. Lucie, FL
- Population (ZIP)
- 49,001
- Household income
- $75,489
- Rent vs Own
- Severe rent burden
- 843.0
Population outlook (St. Lucie County) Hauer SSP2
- Today (2025)
- 338,016 people
- By 2030
- 355,687 · +5.2%
- By 2040
- 385,521 · +14.1%
- By 2050
- 406,106 · +20.1%
- By 2075
- 441,054 · +30.5%
- By 2100
- 436,885 · +29.2%
Race, ethnicity, and origin ACS 2023
- Neighborhood character
- Diverse neighborhood (Simpson 0.65)
- Race & ethnicity
- White 51% Hispanic / Latino 23% Black 18% Two or more races 13% Asian 3%
- Hispanic origin (detail)
- Mexican 3% Puerto Rican 9% Cuban 3%
- Common ancestry
- Hispanic 3% Romanian 2% Italian 1%
- Foreign-born
- 19% · Canada, Guatemala, Jamaica
- Languages at home
- 74% English-only · Spanish 15% French/Haitian/Cajun 4% Other Indo-European 2%
Political lean MEDSL · St. Lucie
- 2024 margin
- Lean R (+9.1) · D 45.1% · R 54.2%
- 2008→2024 swing
- -21.2pp toward R · 2008: 12.1pp · 2024: -9.1pp
- All cycles
- 2024: R+9.1 2020: R+1.6 2016: R+2.5 2012: D+7.9 2008: D+12.1
Not yet ingested
- Civics
- —
Market trends
- HPI YoY
- ▼ -209.28%
- Current HPI
- 407.6341
- Rent YoY
- ▲ 1.53%
- Metro
- Port St. Lucie, FL
- State GDP YoY
- ▲ 3.28%
- F500 in state
- 36
Industry mix (Fortune 500 HQ in FL)
| Industry | F500 HQs | Revenue |
|---|---|---|
| Industrial Technology | 2 | $29B |
|
||
| Insurance | 2 | $17B |
|
||
| Retail | 1 | $60B |
|
||
| Technology Distribution | 1 | $58B |
|
||
| Homebuilding | 1 | $35B |
|
||
| Technology Manufacturing | 1 | $35B |
|
||
Price history
+6630.8% since first listed19 events — show timeline
- 2026-05-29 Listed $350,000 Stellar MLS as Distributed by MLS Grid
- 2014-10-06 Listing Removed — Beaches MLS
- 2014-06-02 Listing Removed — Beaches MLS
- 2013-09-22 Listing Removed — Beaches MLS
- 2013-09-21 Listing Removed — Beaches MLS
- 2013-09-21 Listing Removed — Beaches MLS
- 2008-09-27 Listed $129,990 Beaches MLS
- 2008-05-26 Listed $149,990 Beaches MLS
- 2008-03-24 Sold (Public Records) $17,000 Public Records
- 2007-10-04 Listed $36,000 Beaches MLS
- 2007-02-04 Listed $46,500 Beaches MLS
- 2004-07-23 Sold (Public Records) $42,000 Public Records
- 2003-09-20 Listed $48,000 Beaches MLS
- 2003-01-09 Sold (MLS) $11,000 Beaches MLS
- 2002-12-19 Listing Removed — Beaches MLS
- 2002-11-29 Listed $12,000 Beaches MLS
- 2002-06-14 Sold (MLS) $5,000 Beaches MLS
- 2002-06-03 Listing Removed — Beaches MLS
- 2001-01-25 Listed $5,200 Beaches MLS
Property tax history
+1.7%/yrLatest (2025): $1,350 · +5.5% YoY. Source: county tax records.
Cash-flow waterfall
monthlySold comps — $/sqft
last 12 mo · ≤1 miLoading sold comps…