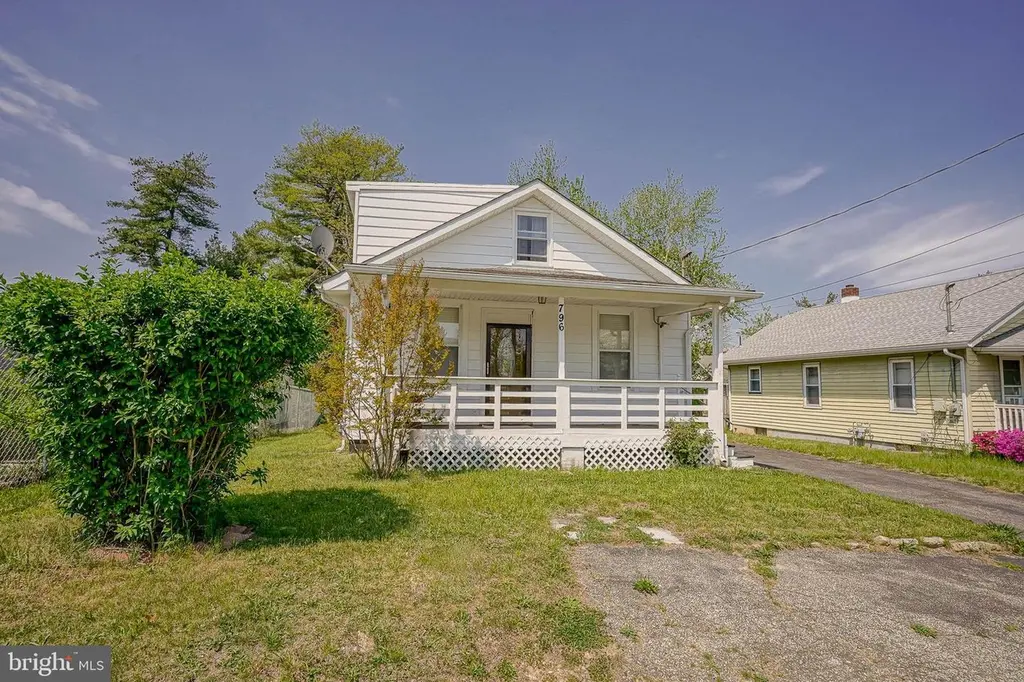
796 S 8th St · Vineland, NJ
Flood risk 1/10 · Minimal
- FEMA flood zone
- X (unshaded)
- Chance of flooding over 30 yrs
- 0.0%
- Est. flood insurance / yr
- $507 – $1,088
Fire risk 2/10 · Minimal
- Est. fire insurance / yr
- $526 – $976
Heat risk 7/10 · Major
- Hot days now (above 103°F)
- 7 days/yr
- Hot days in 30 yrs
- 15 days/yr
Wind risk 6/10 · Moderate
- Chance of severe wind over 30 yrs
- 71.0%
Air-quality risk 3/10 · Minor
- Unhealthy air days now
- 3 days/yr
- Unhealthy air days in 30 yrs
- 5 days/yr
Risk factors via First Street. Map © Google.
Why this score? — see what drove the D+ grade
The composite is a weighted blend of 9 inputs, each scored 0–100. Each bar is that input's sub-score; the figure is the points it added to the 100-point composite (weight × sub-score).
- Cash flow +17.1/30.0
- ARV discount +11.0/15.0
- DSCR +5.3/10.0
- 1% rule +4.3/10.0
- Livability +3.3/5.0
- Rent growth +2.5/5.0
- Condition / age +2.5/5.0
- Schools +1.9/10.0
- Appreciation +0.0/10.0
$249,900
🖨 Deal sheet (PDF) 📄 Offer letter ✓ Due diligence
Listing remarks MLS
Move in ready cape cod. Freshly painted. New flooring. Sold "as is" . Seller has already obtained the certificate of occupancy.
Key facts
- 5,001 sq ft lot
- Built 1935
- Listed 6 days
Property features AI
Exterior
- Parking: Asphalt driveway; Driveway parking
- Utilities: Public water; Public sewer; Natural gas service
- Home design: Detached house; Above-grade finished living space (estimated)
- Construction: Block foundation
- Exterior features: Detached property; No tidal water
Interior
- Kitchen: Kitchen
- Bedrooms: Three bedrooms on the upper level; One bedroom on the main level
- Bathrooms: One full bathroom on the main level; One half bathroom on the upper level
- Heating & cooling: Radiator heating; Window air conditioning units (electric); Natural gas hot water
- Interior features: Living room; Dining room; Den; Estimated living area; Full basement with interior access and sump pump
Neighborhood map
What this means for you Summary
Snapshot
- This is a 4-bed/1.5-bath single-family listed at $250k.
Deal economics
- At list price, monthly cash flow is $172 ($2k/yr) — positive.
- The deal already cash-flows at list — no discount required.
- To meet the 1% rule (rent ≥ 1% of price), the offer needs to be $233k (6.9% below list).
- Recommended offer: $233k (6.9% below list) — sets the bar for 1% rule.
- Cap rate 7.1% vs local median 4.6% in Vineland — top-decile yield for the area; either an underpriced asset or a hidden risk that comps aren't pricing in. Stress-test before assuming the spread holds.
Location & tenants
- Location reads 66/100 on livability (#363 in NJ) — a middle-class / working-renter tenant base. Strengths: housing A+, health & safety A+; Watch: employment D+, crime F, amenities F.
- Vineland Public School District (urban): math 9% / reading 34% proficiency, ranked #418 of 472 in NJ (top 89%) — low school quality limits family demand, transient renter base, plan for 1-2y turnover.
- Zoned schools: John H. Winslow Elementary School (math 10% / reading 35%, grade F, #934 of 1,303 statewide, top 72%, 458 students, 0% FRL); Anthony Rossi Elementary School (math 10% / reading 31%, grade F, #985 of 1,303 statewide, top 76%, 611 students, 0% FRL); Vineland Senior High School (math 10% / reading 34%, grade F, #346 of 399 statewide, top 88%, 2,780 students, 0% FRL) — zoned schools average 0% FRL vs 53% district-wide (53 pts lower); this property's tenant base skews higher-income than the district average.
- Market conditions: 176 active listings in the ZIP; 216 units permitted in Cumberland County in 2024 (73 in 5+ unit buildings).
- This rent runs 43% of the median local income ($65k/yr) — at the standard rent-burdened threshold; future hikes will face affordability resistance.
Forward outlook
- Local home prices are declining (-3.0%/yr); year-one equity from $2k of loan paydown is wiped out by about $7k of value loss. Plan a longer hold.
- Cumberland County population projected to shrink 7% by 2050 — rents likely to lag national; underwrite the cash flow, not the appreciation.
Negotiation context
- Only 6 days on market — expect competitive offers; lowballing is unlikely to land.
- 5 sale attempts since 2y ago with the ask held roughly flat each time — persistent listings suggest the price (not the market) is what's stuck; bring a comps-based counter.
Risks & watch-outs
- Watch-outs: built in 1935 — expect roof / HVAC / electrical / plumbing capex.
- Climate carrying-cost: major wind risk, 71% chance of damaging wind over 30y; extreme-heat days projected 7→15/yr by 2055 (HVAC capex compounding) — expect insurance premiums to compound above CPI over the hold.
Questions for the listing agent
- Built in 1935 — when were the roof, HVAC, electrical panel, plumbing, and water heater last replaced?
- Is there a deadline driving the sale (1031 exchange, divorce, estate, relocation)? That informs how much negotiation room exists.
- Schools are D-rated, which usually means shorter tenancies and higher turnover. Who's the typical renter profile here, and what's been the actual vacancy rate?
- Crime grade is F in this area — have there been break-ins, vandalism, or insurance claims at this property in the last 3 years? What carrier currently insures it and at what premium?
- The area grade is low — what's the realistic commute time and amenity access for the typical tenant pool here? Any planned neighborhood developments (good or bad) we should know about?
- What's the average days-on-market for RENTAL listings here right now (not sales)? A rising rental-DOM trend means longer vacancies and softer asking-rent achievability than the comps imply.
- What's the recent tenant-quality profile in this submarket — average credit score on applications, eviction rate, late-payment / NSF rate, and stable-employment percentage? A property-management company in the area should have these aggregated.
- How much new for-sale + rental construction is in the pipeline within 1–3 miles? Heavy new supply typically softens prices + rents 12–24 months out; constrained supply supports both.
Investment metrics
- 1% rule
- 0.93% ✗
- Cap rate
- 7.12%
- Cash-on-cash
- 2.95%
- DSCR
- 1.13
- GRM
- 8.9
CMA / ARV
- ARV (on-the-fly)
- $270,900
- Comps found
- 12
Show comp detail 12 sales within ~0.75 mi
| Address | Dist | Beds/Ba | Sqft | Sold | Price | $/sf | Match |
|---|---|---|---|---|---|---|---|
| 726 Allen Ave | 0.38mi | 3/1.5 (-1) | 1,248 (-3%) | 1mo | $269,000 | $216 | 71 |
| 426 Amanda Ct | 0.27mi | 3/2.5 (-1) | 1,238 (-4%) | 2mo | $375,000 | $303 | 70 |
| 176 Axtell Ave | 0.55mi | 3/1.0 (-1) | 1,286 (-0%) | 1mo | $299,900 | $233 | 66 |
| 814 Catherine St | 0.11mi | 3/2.5 (-1) | 1,437 (+11%) | 3mo | $349,999 | $244 | 65 |
| 708 E Chestnut Ave | 0.49mi | 3/1.5 (-1) | 1,228 (-5%) | 3mo | $180,000 | $147 | 61 |
| 736 S East Ave | 0.34mi | 3/1.0 (-1) | 1,188 (-8%) | 4mo | $250,000 | $210 | 61 |
| 510 S East Ave | 0.60mi | 4/2.0 | 1,344 (+4%) | 8mo | $225,000 | $167 | 57 |
| 810 Washington Ave | 0.35mi | 3/2.0 (-1) | 1,425 (+10%) | 7mo | $290,000 | $204 | 54 |
| 704 S Valley Ave | 0.73mi | 3/1.0 (-1) | 1,272 (-1%) | 7mo | $250,000 | $197 | 50 |
| 816 E Quince St | 0.63mi | 3/1.0 (-1) | 1,397 (+8%) | 2mo | $231,000 | $165 | 48 |
| 691 Fava Dr | 0.65mi | 3/2.0 (-1) | 1,180 (-8%) | 2mo | $289,000 | $245 | 47 |
| 73 S Myrtle St | 0.64mi | 3/2.0 (-1) | 1,445 (+12%) | 2mo | $193,000 | $134 | 42 |
Match score weights: distance 35% · size 25% · config 20% · recency 20%. Top-matched comps best support the ARV.
Projected returns pro-forma
-3.0% appreciation · 3.0% rent growth · sell at horizon
- IRR
- -11.6%
- Equity multiple
- 0.58×
- Total profit
- $-29,539
- Equity at exit
- $37,261
- IRR
- -2.5%
- Equity multiple
- 0.83×
- Total profit
- $-11,620
- Equity at exit
- $21,607
Cash invested: $69,972 (down + closing). Projections, not guarantees.
Landlord ↔ Tenant lean methodology
- Overall (STATE)
- 21 Tenant-Leaning
- State New Jersey
- 21 Tenant-Leaning · D+6
- County
- — inherits STATE
- City
- — inherits STATE
ZIP-level market 08360
- Active inventory
- 176
- Price-to-rent
- 8.9×
Monthly cashflow live
- Estimated rent
- $2,327 medium interval (Pro) →
- Mortgage (P&I)
- −$1,311
- Tax from tax record
- −$252 /mo · $3,024/yr
- Insurance
- −$104
- HOA
- −$0
- Lot rent
- −$0
- Vacancy / Maint / Mgmt
- −$489
- Net cashflow
- $172
Break-even live
Sensitivity live
| Price | -10% $314 | -5% $243 | +0% $172 | +5% $101 | +10% $31 |
|---|---|---|---|---|---|
| Rent | -10% $-12 | -5% $80 | +0% $172 | +5% $264 | +10% $356 |
| Rate | -1.0pp $298 | -0.5pp $236 | base $172 | +0.5pp $107 | +1.0pp $41 |
UW: 25.0% down · 7.5% · 30yr · 1.5% tax · 5.0% vac · 8.0% maint · 8.0% mgmt
Financing live
Cash to close
- Down payment
- $62,475
- Closing costs
- $7,497
- Reserves months
- —
- Total cash needed
- —
Loan-product check · same deal, 3 products live
Conventional
25% down · 7.5% · 30yr
- Down + closing
- —
- Monthly P&I
- —
- Monthly cashflow
- —
- DSCR
- —
- Eligible?
- —
Personal DTI + credit; lowest rate.
DSCR
20% down · 8.5% · 30yr
- Down + closing
- —
- Monthly P&I
- —
- Monthly cashflow
- —
- DSCR
- —
- Eligible?
- —
No personal income docs; deal must DSCR.
Hard money
10% down · 12.0% · 12mo
- Down + closing
- —
- Monthly P&I
- —
- Monthly cashflow
- —
- DSCR
- —
- Eligible?
- —
Short-term bridge; refi at stabilization.
Listing history 15 events
-
2026-05-01status Pending
-
2026-04-24$249,900 Active
-
2024-11-01soldstatus $228,000
-
2024-10-25soldstatus $228,000 Closed 137-char remark
Show marketing remark (137 chars)
Move in ready cape cod. Freshly painted. New flooring. Sold "as is" . Seller has already obtained the certificate of occupancy.
-
2024-10-02status Pending 137-char remark
Show marketing remark (137 chars)
Move in ready cape cod. Freshly painted. New flooring. Sold "as is" . Seller has already obtained the certificate of occupancy.
-
2024-09-24status Active 137-char remark
Show marketing remark (137 chars)
Move in ready cape cod. Freshly painted. New flooring. Sold "as is" . Seller has already obtained the certificate of occupancy.
-
2024-09-16status Pending 137-char remark
Show marketing remark (137 chars)
Move in ready cape cod. Freshly painted. New flooring. Sold "as is" . Seller has already obtained the certificate of occupancy.
-
2024-08-30price $225,000 137-char remark
Show marketing remark (137 chars)
Move in ready cape cod. Freshly painted. New flooring. Sold "as is" . Seller has already obtained the certificate of occupancy.
-
2024-08-30status Active 137-char remark
Show marketing remark (137 chars)
Move in ready cape cod. Freshly painted. New flooring. Sold "as is" . Seller has already obtained the certificate of occupancy.
-
2024-08-07historical 137-char remark
Show marketing remark (137 chars)
Move in ready cape cod. Freshly painted. New flooring. Sold "as is" . Seller has already obtained the certificate of occupancy.
-
2024-08-05status Active 137-char remark
Show marketing remark (137 chars)
Move in ready cape cod. Freshly painted. New flooring. Sold "as is" . Seller has already obtained the certificate of occupancy.
-
2024-06-03status Pending 137-char remark
Show marketing remark (137 chars)
Move in ready cape cod. Freshly painted. New flooring. Sold "as is" . Seller has already obtained the certificate of occupancy.
-
2024-05-14$215,000 Active 137-char remark
Show marketing remark (137 chars)
Move in ready cape cod. Freshly painted. New flooring. Sold "as is" . Seller has already obtained the certificate of occupancy.
-
1993-10-08soldstatus $20,500
-
1985-02-07soldstatus $36,250
ⓘ Source: listings_history table (triggers on properties + properties_extension) + one-shot
backfill from property_details.listing_events for pre-trigger history.
Tax reassessment forecast NJ · Partial reset (capped growth)
- Current annual tax
- $3,024 · $252/mo
- Projected year-2 tax
- $4,623 · $385/mo
- Expected delta
- +$1,599/yr (+$133/mo · 52.9%)
ⓘ Screening estimate from a state-policy table — verify with the county assessor before closing.
Climate risk First Street
- Flood 1/10 Low FEMA zone X (unshaded) · 0% chance over 30 yrs
- Wildfire 2/10 Low
- Heat 7/10 Severe 7 d/yr ≥103°F today · 15 d/yr by 30 yrs out
- Wind 6/10 Major 71% chance of damaging wind over 30 yrs
- Air quality 3/10 Moderate 3 unhealthy d/yr today · 5 by 30 yrs out
Nearby sold comps map
Loading sold comps map…
Walkable amenities ~0.75 mi
Loading nearby amenities…
Taxation est. · year 1
- Rental income
- $27,930
- − Mortgage interest
- −$13,998
- − Property taxes
- −$3,024
- − Insurance
- −$1,250
- − Repairs & maintenance
- −$2,234
- − Management
- −$2,234
- − Depreciation
- −$7,270
- Taxable loss
- −$2,081
- Est. tax savings @ 24.0%
- +$499
- After-tax cash flow
- $2,564/yr
For passive investors: Depreciation is non-cash, so a rental often shows a tax loss while cash-flowing — sheltering income. Rental losses are passive: they offset passive income freely, and up to $25,000/yr can offset ordinary (W-2) income if you actively participate and your MAGI is under $100k (phasing out to $0 by $150k); unused losses carry forward. On sale, claimed depreciation is recaptured at up to 25%, and gains may owe capital-gains tax (a 1031 exchange can defer both). Figures are a year-1 estimate at your 24.0% rate — not tax advice; consult a CPA.
Schools (NCES district)
- District
- Vineland Public School District
- NCES district ID
- 3416800
- Math proficiency
- 9% ▼ -17.00%
- Reading proficiency
- 34% ▬ 0.00%
- Median HH income
- $51,168
- Composite
- 19.17/100
- National rank
- #8819
- State rank
- #418 of 472 in NJ
Livability — Vineland
- Score
- 66/100
- State rank
- #363
- US rank
- #12180
Category grades
Schools grade is shown separately in the Schools card above.
Census & demographics
- Census place
- Vineland, NJ
- County
- Cumberland County · 80,266 people
- City population
- 45,038
- Metro
- Vineland-Bridgeton, NJ
- Population (ZIP)
- 45,038
- Household income
- $65,359
- Rent vs Own
- Severe rent burden
- 1328.0
Population outlook (Cumberland County) Hauer SSP2
- Today (2025)
- 152,743 people
- By 2030
- 150,373 · -1.6%
- By 2040
- 146,881 · -3.8%
- By 2050
- 142,653 · -6.6%
- By 2075
- 129,468 · -15.2%
- By 2100
- 107,456 · -29.6%
Race, ethnicity, and origin ACS 2023
- Neighborhood character
- Diverse neighborhood (Simpson 0.62)
- Race & ethnicity
- Hispanic / Latino 51% White 32% Two or more races 17% Black 11% Asian 1%
- Hispanic origin (detail)
- Mexican 11% Puerto Rican 33% Dominican 2%
- Common ancestry
- Romanian 2% Subsaharan African 1% Scotch-Irish 1%
- Foreign-born
- 14% · Canada, Jamaica
- Languages at home
- 59% English-only · Spanish 37% Russian/Polish/Slavic 2% Other Indo-European 1%
Political lean MEDSL · Cumberland
- 2024 margin
- Toss-up / Even · D 47.6% · R 51.3% · Other 1.1%
- 2008→2024 swing
- -25.4pp toward R · 2008: 21.6pp · 2024: -3.8pp
- All cycles
- 2024: R+3.8 2020: D+6.0 2016: D+5.3 2012: D+23.1 2008: D+21.6
Not yet ingested
- Civics
- —
Market trends
- HPI YoY
- ▼ -320.06%
- Current HPI
- 278.786
- Rent YoY
- —
- Metro
- Vineland-Bridgeton, NJ
- State GDP YoY
- ▲ 2.05%
- F500 in state
- 34
Industry mix (Fortune 500 HQ in NJ)
| Industry | F500 HQs | Revenue |
|---|---|---|
| Consumer Goods | 3 | $31B |
|
||
| Pharmaceuticals | 2 | $153B |
|
||
| Technology | 2 | $21B |
|
||
| Insurance | 2 | $20B |
|
||
| Healthcare | 2 | $19B |
|
||
| Financial Services | 1 | $70B |
|
||
Price history
+589.4% since first listed15 events — show timeline
- 2026-05-01 Pending — BRIGHT MLS
- 2026-04-24 Listed $249,900 BRIGHT MLS
- 2024-11-01 Sold (Public Records) $228,000 Public Records
- 2024-10-25 Sold (MLS) $228,000 BRIGHT MLS
- 2024-10-02 Pending — BRIGHT MLS
- 2024-09-24 Relisted — BRIGHT MLS
- 2024-09-16 Pending — BRIGHT MLS
- 2024-08-30 Price Changed $225,000 BRIGHT MLS
- 2024-08-30 Relisted — BRIGHT MLS
- 2024-08-07 Listing Removed — BRIGHT MLS
- 2024-08-05 Relisted — BRIGHT MLS
- 2024-06-03 Pending — BRIGHT MLS
- 2024-05-14 Listed $215,000 BRIGHT MLS
- 1993-10-08 Sold (Public Records) $20,500 Public Records
- 1985-02-07 Sold (Public Records) $36,250 Public Records
Property tax history
+2.1%/yrLatest (2025): $3,024 · +5.7% YoY. Source: county tax records.
Cash-flow waterfall
monthlySold comps — $/sqft
last 12 mo · ≤1 miLoading sold comps…