127 N 63rd Ave Ave W · Duluth, MN
Flood risk 1/10 · Minimal
- FEMA flood zone
- X
- Chance of flooding over 30 yrs
- 0.0%
- Est. flood insurance / yr
- $473 – $860
Fire risk 3/10 · Minor
- Est. fire insurance / yr
- $888 – $1,650
Heat risk 2/10 · Minimal
- Hot days now (above 90°F)
- 7 days/yr
- Hot days in 30 yrs
- 14 days/yr
Wind risk 1/10 · Minimal
- Chance of severe wind over 30 yrs
- —
Air-quality risk 1/10 · Minimal
- Unhealthy air days now
- 0 days/yr
- Unhealthy air days in 30 yrs
- 0 days/yr
Risk factors via First Street. Map © Google.
Why this score? — see what drove the D+ grade
The composite is a weighted blend of 9 inputs, each scored 0–100. Each bar is that input's sub-score; the figure is the points it added to the 100-point composite (weight × sub-score).
- ARV discount +15.0/15.0
- Cash flow +13.9/30.0
- DSCR +4.2/10.0
- Schools +4.2/10.0
- Livability +4.1/5.0
- 1% rule +3.3/10.0
- Rent growth +2.5/5.0
- Condition / age +2.5/5.0
- Appreciation +0.0/10.0
$179,900
🖨 Deal sheet 📄 Offer letter ✓ Due diligence
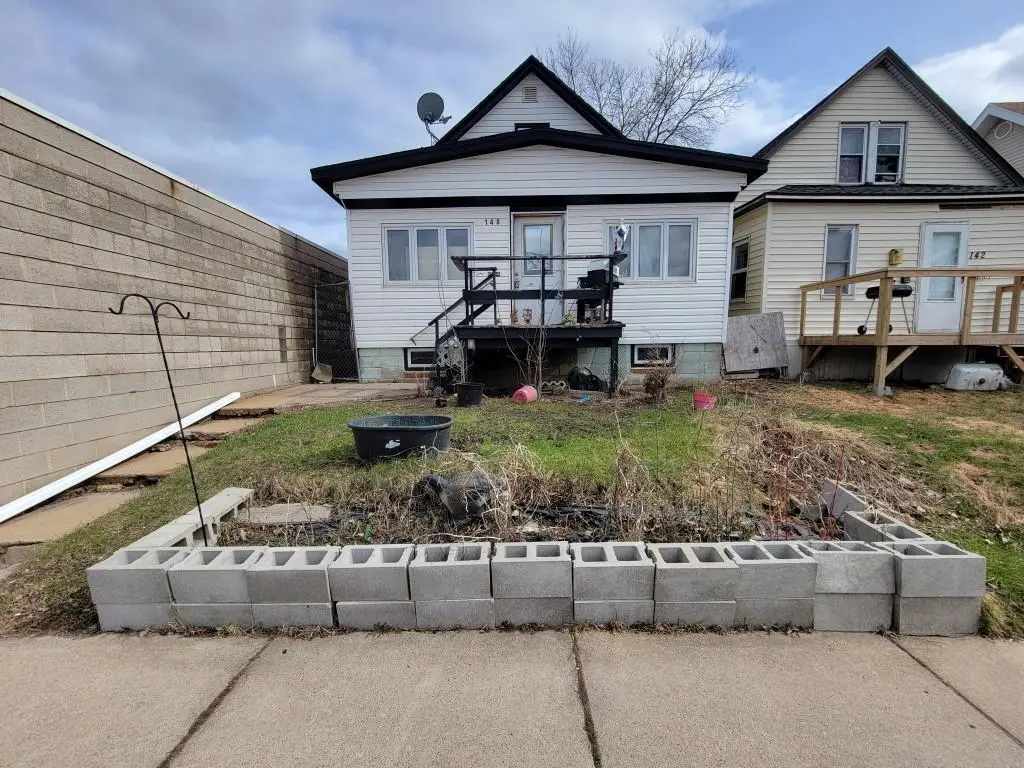
Listing remarks
It’s rare to find a home under $200,000, and this one is ready to welcome you! Whether you’re tired of renting, looking for your first home, or simply seeking something affordable, this could be the one. The three-bedroom layout offers flexibility, with two bedrooms upstairs and one conveniently located on the main floor. Inside, you’ll find a welcoming living room, a dining area, and an eat-in kitchen. Newer added mudroom, a one-car garage, and a flat backyard with plenty of off-street parking. Updates include a newer water heater, electrical upgrade, and a roof above the kitchen that was replaced in 2025. With all this value, this might be your perfect first home—s
Key facts
- Flat backyard
- Newer water heater
- Roof above kitchen
Tags
Property features AI
Exterior
- Parking: Detached 1-car garage
- Utilities: Public water; Public sewer
- Home design: Single-family detached residence; 2-story home
- Construction: Block construction
- Exterior features: Lot dimensions approximately 25 x 125; Lot size about 0.71 acre
Interior
- Bedrooms: Master on main level
- Bathrooms: 1 full bathroom
- Heating & cooling: Forced air heating
- Interior features: Master bedroom on the main level; Full basement
- Laundry & utility: Washer hookup
Neighborhood map
What this means for you Summary
Snapshot
- This is a 2-bed/1.0-bath single-family listed at $180k.
Deal economics
- At list price, monthly cash flow is $21 ($251/yr) — positive.
- The deal already cash-flows at list — no discount required.
- To meet the 1% rule (rent ≥ 1% of price), the offer needs to be $150k (16.6% below list).
- Recommended offer: $150k (16.6% below list) — sets the bar for 1% rule.
- Cap rate 6.4% vs local median 4.9% in Duluth — top-decile yield for the area; either an underpriced asset or a hidden risk that comps aren't pricing in. Stress-test before assuming the spread holds.
Location & tenants
- Location reads 82/100 on livability (#36 in MN, #1,060 nationally) — a professional / high-income tenant draw. Strengths: commute A+, cost of living A+, housing A+; Watch: amenities F.
- Duluth Public School District (urban): math 44% / reading 55% proficiency, ranked #132 of 301 in MN (top 44%) — families likely to look elsewhere, expect single-tenant / working-renter base with shorter leases.
- Market conditions: 50 active listings in the ZIP; 2 comparable units currently listed for rent nearby; 639 units permitted in St. Louis County in 2024 (338 in 5+ unit buildings).
Forward outlook
- Local home prices are declining (-3.0%/yr); year-one equity from $1k of loan paydown is wiped out by about $5k of value loss. Plan a longer hold.
Negotiation context
- Only 8 days on market — expect competitive offers; lowballing is unlikely to land.
- 2 sale attempts with the ask held roughly flat each time — persistent listings suggest the price (not the market) is what's stuck; bring a comps-based counter.
- Current owner paid $10k; list at $180k implies a 1699% gain — meaningful room to come down on a strong offer.
Risks & watch-outs
- Watch-outs: built in 1910 — expect roof / HVAC / electrical / plumbing capex.
Questions for the listing agent
- Built in 1910 — when were the roof, HVAC, electrical panel, plumbing, and water heater last replaced?
- Is there a deadline driving the sale (1031 exchange, divorce, estate, relocation)? That informs how much negotiation room exists.
- Schools are B-rated — typically a magnet for longer-tenancy family renters. What's the average tenant stay here, and is there a school-zone premium baked into asking?
- The area grade is low — what's the realistic commute time and amenity access for the typical tenant pool here? Any planned neighborhood developments (good or bad) we should know about?
- What's the average days-on-market for RENTAL listings here right now (not sales)? A rising rental-DOM trend means longer vacancies and softer asking-rent achievability than the comps imply.
- What's the recent tenant-quality profile in this submarket — average credit score on applications, eviction rate, late-payment / NSF rate, and stable-employment percentage? A property-management company in the area should have these aggregated.
- How much new for-sale + rental construction is in the pipeline within 1–3 miles? Heavy new supply typically softens prices + rents 12–24 months out; constrained supply supports both.
Investment metrics
- 1% rule
- 0.83% ✗
- Cap rate
- 6.43%
- Cash-on-cash
- 0.50%
- DSCR
- 1.02
- GRM
- 10.0
CMA / ARV
- ARV (median comp)
- $240,024
- List price
- $179,900
- Delta
- -18.80%
- Verdict
- UNDERPRICED
- Comps
- 5 within 2.0 mi
Show comp detail 12 sales within ~0.75 mi
| Address | Dist | Beds/Ba | Sqft | Sold | Price | $/sf | Match |
|---|---|---|---|---|---|---|---|
| 5811 Cody St | 0.49mi | 3/1.0 (+1) | 1,150 (0%) | 2mo | $200,000 | $174 | 70 |
| 10 N 59th Ave Ave W | 0.32mi | 3/1.0 (+1) | 1,205 (+5%) | 5mo | $215,000 | $178 | 68 |
| 116 S 59th Ave Ave W | 0.41mi | 3/1.0 (+1) | 1,133 (-2%) | 7mo | $200,000 | $177 | 68 |
| 6223 Tacony St | 0.67mi | 2/1.5 | 1,167 (+2%) | 1mo | $271,000 | $232 | 64 |
| 317 N 61st Ave Ave W | 0.20mi | 3/1.0 (+1) | 1,022 (-11%) | 5mo | $150,000 | $147 | 63 |
| 914 N 59th Ave Ave W | 0.70mi | 3/1.0 (+1) | 1,126 (-2%) | 2mo | $190,000 | $169 | 57 |
| 6202 Tacony St | 0.65mi | 2/1.0 | 1,086 (-6%) | 4mo | $285,000 | $262 | 57 |
| 6502 Roosevelt St | 0.13mi | 3/3.0 (+1) | 1,296 (+13%) | 6mo | $300,000 | $231 | 54 |
| 5914 Raleigh St | 0.42mi | 2/1.0 | 998 (-13%) | 5mo | $75,000 | $75 | 54 |
| 310 S 58th Ave Ave W | 0.57mi | 3/1.5 (+1) | 1,206 (+5%) | 5mo | $200,000 | $166 | 54 |
| 208 S 71st Ave Ave W | 0.59mi | 2/1.5 | 1,040 (-10%) | 7mo | $160,000 | $154 | 49 |
| 309 S 57th Ave Ave W | 0.60mi | 3/1.0 (+1) | 1,320 (+15%) | 6mo | $135,500 | $103 | 37 |
Match score weights: distance 35% · size 25% · config 20% · recency 20%. Top-matched comps best support the ARV.
Projected returns pro-forma
-3.0% appreciation · 3.0% rent growth · sell at horizon
- IRR
- -15.5%
- Equity multiple
- 0.45×
- Total profit
- $-27,845
- Equity at exit
- $26,824
- IRR
- -7.1%
- Equity multiple
- 0.55×
- Total profit
- $-22,638
- Equity at exit
- $15,554
Cash invested: $50,372 (down + closing). Projections, not guarantees.
Landlord ↔ Tenant lean methodology
- Overall (STATE)
- 46 Balanced
- State Minnesota
- 46 Balanced · D+2
- County
- — inherits STATE
- City
- — inherits STATE
ZIP-level market 55807
- Active inventory
- 50
- Price-to-rent
- 10.0×
Monthly cashflow live
- Estimated rent
- $1,500 medium interval (Pro) →
- Mortgage (P&I)
- −$943
- Tax from tax record
- −$145 /mo · $1,744/yr
- Insurance
- −$75
- HOA
- −$0
- Vacancy / Maint / Mgmt
- −$315
- Net cashflow
- $21
Break-even live
UW: 25.0% down · 7.5% · 30yr · 1.5% tax · 5.0% vac · 8.0% maint · 8.0% mgmt
Financing live
Cash to close
- Down payment
- $44,975
- Closing costs
- $5,397
- Reserves months
- —
- Total cash needed
- —
Loan-product check · same deal, 3 products live
Conventional
25% down · 7.5% · 30yr
- Down + closing
- —
- Monthly P&I
- —
- Monthly cashflow
- —
- DSCR
- —
- Eligible?
- —
Personal DTI + credit; lowest rate.
DSCR
20% down · 8.5% · 30yr
- Down + closing
- —
- Monthly P&I
- —
- Monthly cashflow
- —
- DSCR
- —
- Eligible?
- —
No personal income docs; deal must DSCR.
Hard money
10% down · 12.0% · 12mo
- Down + closing
- —
- Monthly P&I
- —
- Monthly cashflow
- —
- DSCR
- —
- Eligible?
- —
Short-term bridge; refi at stabilization.
Rent comps 2 comps
| Address | Beds | Baths | Sqft | Rent | $/sqft | DOM | Units | Dist |
|---|---|---|---|---|---|---|---|---|
| 509 N 53rd Ave W Duluth, MN | 2.0 | 1.0 | 931 | $1,250 | $1.34 | 43d | 1 | 0.73mi |
| 5725 W 8th St Unit 2 Duluth, MN | 3.0 | 1.0 | 1300 | $1,550 | $1.19 | 21d | 1 | 0.75mi |
Listing history 9 events
-
2026-06-13statusdays on market $179,900 Pending 8 DOM
-
2026-06-10days on market $179,900 Active 6 DOM
-
2026-06-09days on market $179,900 Active 5 DOM
-
2026-06-08days on market $179,900 Active 4 DOM
-
2026-06-07days on market $179,900 Active 3 DOM
-
2026-06-05remarks 675-char remark
-
2026-06-05pricestatusdays on market $179,900 Active 1 DOM
-
2026-05-11$194,900 Active
-
2002-01-28soldstatus $10,000
ⓘ Source: listings_history table (triggers on properties + properties_extension) + one-shot
backfill from property_details.listing_events for pre-trigger history.
Tax reassessment forecast MN · Partial reset (capped growth)
- Current annual tax
- $1,744 · $145/mo
- Projected year-2 tax
- $1,879 · $157/mo
- Expected delta
- +$135/yr (+$11/mo · 7.8%)
ⓘ Screening estimate from a state-policy table — verify with the county assessor before closing.
Climate risk First Street
- Flood 1/10 Low FEMA zone X · 0% chance over 30 yrs
- Wildfire 3/10 Moderate
- Heat 2/10 Low 7 d/yr ≥90°F today · 14 d/yr by 30 yrs out
- Wind 1/10 Low
- Air quality 1/10 Low 0 unhealthy d/yr today · 0 by 30 yrs out
Nearby sold comps map
Loading sold comps map…
Walkable amenities ~0.75 mi
Loading nearby amenities…
Taxation est. · year 1
- Rental income
- $17,994
- − Mortgage interest
- −$10,077
- − Property taxes
- −$1,744
- − Insurance
- −$900
- − Repairs & maintenance
- −$1,440
- − Management
- −$1,440
- − Depreciation
- −$5,233
- Taxable loss
- −$2,839
- Est. tax savings @ 24.0%
- +$681
- After-tax cash flow
- $932/yr
For passive investors: Depreciation is non-cash, so a rental often shows a tax loss while cash-flowing — sheltering income. Rental losses are passive: they offset passive income freely, and up to $25,000/yr can offset ordinary (W-2) income if you actively participate and your MAGI is under $100k (phasing out to $0 by $150k); unused losses carry forward. On sale, claimed depreciation is recaptured at up to 25%, and gains may owe capital-gains tax (a 1031 exchange can defer both). Figures are a year-1 estimate at your 24.0% rate — not tax advice; consult a CPA.
Schools (NCES district)
- District
- Duluth Public School District
- NCES district ID
- 2711040
- Math proficiency
- 44% ▼ -10.00%
- Reading proficiency
- 55% ▼ -6.00%
- Median HH income
- $45,692
- Composite
- 41.92/100
- National rank
- #3360
- State rank
- #132 of 301 in MN
Livability — Duluth
- Score
- 82/100
- State rank
- #36
- US rank
- #1060
Category grades
Schools grade is shown separately in the Schools card above.
Census & demographics
- Census place
- Duluth, MN
- County
- Saint Louis County · 115,152 people
- City population
- 71,097
- Metro
- Duluth, MN-WI
- Population (ZIP)
- 9,763
- Household income
- $62,067
- Rent vs Own
- Severe rent burden
- 407.0
Population outlook (St. Louis County) Hauer SSP2
- Today (2025)
- 202,411 people
- By 2030
- 203,234 · +0.4%
- By 2040
- 202,520 · +0.1%
- By 2050
- 200,853 · -0.8%
- By 2075
- 200,943 · -0.7%
- By 2100
- 192,058 · -5.1%
Race, ethnicity, and origin ACS 2023
- Neighborhood character
- Predominantly White (86%)
- Race & ethnicity
- White 86% Two or more races 8% Hispanic / Latino 4% Native American 1% Black 1%
- Common ancestry
- Portuguese 14% Romanian 6% Lithuanian 4%
- Foreign-born
- 3% · Canada, South Korea
- Languages at home
- 96% English-only · Spanish 2% Russian/Polish/Slavic 1%
Political lean MEDSL · St. Louis
- 2024 margin
- D (+13.7) · D 55.9% · R 42.2% · Other 1.8%
- 2008→2024 swing
- -18.8pp toward R · 2008: 32.5pp · 2024: 13.7pp
- All cycles
- 2024: D+13.7 2020: D+15.6 2016: D+11.8 2012: D+29.6 2008: D+32.5
Not yet ingested
- Civics
- —
Market trends
- HPI YoY
- ▼ -127.84%
- Current HPI
- 212.6883
- Rent YoY
- —
- Metro
- Duluth, MN-WI
- State GDP YoY
- ▲ 2.41%
- F500 in state
- 34
Industry mix (Fortune 500 HQ in MN)
| Industry | F500 HQs | Revenue |
|---|---|---|
| Healthcare | 2 | $407B |
|
||
| Retail | 2 | $150B |
|
||
| Consumer Goods | 2 | $32B |
|
||
| Industrial Machinery | 2 | $6B |
|
||
| Agriculture | 1 | $40B |
|
||
| Healthcare / Medical Devices | 1 | $32B |
|
||
Price history
+1699.0% since first listed5 events — show timeline
- 2026-06-12 Pending — LSAR
- 2026-06-04 Listed $179,900 LSAR
- 2026-05-19 Listing Removed — NORTHSTARMLS as Distributed by MLS Grid
- 2026-05-11 Listed $194,900 NORTHSTARMLS as Distributed by MLS Grid
- 2002-01-28 Sold (Public Records) $10,000 Public Records
Property tax history
+4.4%/yrLatest (2026): $1,744 · +8.6% YoY. Source: county tax records.
Cash-flow waterfall
monthlySold comps — $/sqft
last 12 mo · ≤1 miLoading sold comps…