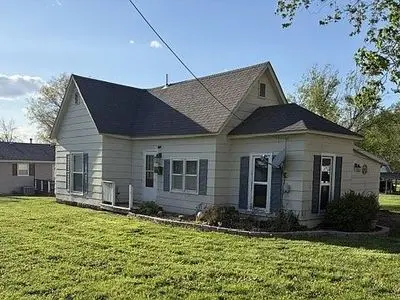
311 W Colbern St · La Plata, MO
Flood risk 1/10 · Minimal
- FEMA flood zone
- X (unshaded)
- Chance of flooding over 30 yrs
- 0.0%
- Est. flood insurance / yr
- $507 – $1,088
Fire risk 2/10 · Minimal
- Est. fire insurance / yr
- $1,054 – $1,958
Heat risk 3/10 · Minor
- Hot days now (above 105°F)
- 7 days/yr
- Hot days in 30 yrs
- 16 days/yr
Wind risk 2/10 · Minimal
- Chance of severe wind over 30 yrs
- —
Air-quality risk 2/10 · Minimal
- Unhealthy air days now
- 1 days/yr
- Unhealthy air days in 30 yrs
- 3 days/yr
Risk factors via First Street. Map © Google.
Why this score? — see what drove the B grade
The composite is a weighted blend of 9 inputs, each scored 0–100. Each bar is that input's sub-score; the figure is the points it added to the 100-point composite (weight × sub-score).
- Cash flow +29.6/30.0
- DSCR +10.0/10.0
- ARV discount +7.5/15.0
- 1% rule +7.4/10.0
- Appreciation +5.0/10.0
- Schools +4.0/10.0
- Livability +3.5/5.0
- Rent growth +2.5/5.0
- Condition / age +2.5/5.0
$90,000
🖨 Deal sheet 📄 Offer letter ✓ Due diligence
Listing remarks
3BR, 2 BA Home with family room, dining room and office space, located on large lot close to school, downtown area, train depot and city library. Features: Endless hot water with tankless water heater; central air and furnace less than 10 years old, Whirlpool stove about 1 year old, Samsung Slim Profile over stove microwave with Wi-Fi capabilities about 1 year old, Whirlpool dishwasher. Property has front and side entrances. Side entrance has washer dryer area and closet right off the entrance. Newer light fixtures installed, Blink Security cameras. Keyless locks for both front and side entrance. Side entrance has WIFI capabilities to allow you to unlock the door from another location if n
Key facts
- Whirlpool dishwasher
- Whirlpool stove
- Built 1920
Tags
Neighborhood map
What this means for you Summary
Snapshot
- This is a 3-bed/2.0-bath other listed at $90k.
Deal economics
- At list price, monthly cash flow is $324 ($4k/yr) — positive.
- The deal already cash-flows at list — no discount required.
- Meets the 1% rule at list price ($1k rent vs $90k).
- Recommended offer: $87k (3.0% below list) — sets the bar for market timing.
Location & tenants
- Location reads 69/100 on livability (#161 in MO) — a middle-class / working-renter tenant base. Strengths: crime A+, cost of living A+, housing A; Watch: schools C-, employment D+, amenities F.
- La Plata R-II (rural): math 45% / reading 45% proficiency, ranked #220 of 535 in MO (top 41%) — families likely to look elsewhere, expect single-tenant / working-renter base with shorter leases.
- Market conditions: 20 active listings in the ZIP; 26 units permitted in Macon County in 2024 (19 in 5+ unit buildings).
Forward outlook
- In year one you build about $3k of equity ($622 loan paydown + $3k appreciation (3.0% local appreciation)).
- Macon County population projected at -17% by 2050 — secular population decline; favor cash flow + early exit over multi-decade hold.
- At projected returns (3.0% appreciation + 3.0% rent growth), your $25k cash investment doubles in ~4 years — after that, you're playing with house money.
- By year 10, paydown + projected appreciation supports a ~$32k cash-out refi (75% LTV) — recoverable capital for the next deal without selling this one.
Negotiation context
- It's been on market 38 days — a 3% lower offer ($87k) is reasonable based on typical stale-listing flexibility.
Risks & watch-outs
- Watch-outs: built in 1920 — expect roof / HVAC / electrical / plumbing capex.
Questions for the listing agent
- It's been on market 38 days. Have you received any prior offers? Is the seller open to a 3% concession, seller financing, or rate buy-down credit?
- Built in 1920 — when were the roof, HVAC, electrical panel, plumbing, and water heater last replaced?
- Is there a deadline driving the sale (1031 exchange, divorce, estate, relocation)? That informs how much negotiation room exists.
- What's the average days-on-market for RENTAL listings here right now (not sales)? A rising rental-DOM trend means longer vacancies and softer asking-rent achievability than the comps imply.
- What's the recent tenant-quality profile in this submarket — average credit score on applications, eviction rate, late-payment / NSF rate, and stable-employment percentage? A property-management company in the area should have these aggregated.
- How much new for-sale + rental construction is in the pipeline within 1–3 miles? Heavy new supply typically softens prices + rents 12–24 months out; constrained supply supports both.
Investment metrics
- 1% rule
- 1.24% ✓
- Cap rate
- 10.61%
- Cash-on-cash
- 15.43%
- DSCR
- 1.69
- GRM
- 6.7
CMA / ARV
No comps found within radius.
Projected returns pro-forma
3.0% appreciation · 3.0% rent growth · sell at horizon
- IRR
- 22.0%
- Equity multiple
- 2.25×
- Total profit
- $31,452
- Equity at exit
- $40,468
- IRR
- 23.0%
- Equity multiple
- 4.29×
- Total profit
- $83,032
- Equity at exit
- $62,366
Cash invested: $25,200 (down + closing). Projections, not guarantees.
Landlord ↔ Tenant lean methodology
- Overall (STATE)
- 81 Strongly Landlord-Friendly
- State Missouri
- 81 Strongly Landlord-Friendly · R+10
- County
- — inherits STATE
- City
- — inherits STATE
ZIP-level market 63549
- Active inventory
- 20
- Price-to-rent
- 6.7×
Monthly cashflow live
- Estimated rent
- $1,115 medium interval (Pro) →
- Mortgage (P&I)
- −$472
- Tax from tax record
- −$47 /mo · $569/yr
- Insurance
- −$38
- HOA
- −$0
- Vacancy / Maint / Mgmt
- −$234
- Net cashflow
- $324
Break-even live
UW: 25.0% down · 7.5% · 30yr · 1.5% tax · 5.0% vac · 8.0% maint · 8.0% mgmt
Financing live
Cash to close
- Down payment
- $22,500
- Closing costs
- $2,700
- Reserves months
- —
- Total cash needed
- —
Loan-product check · same deal, 3 products live
Conventional
25% down · 7.5% · 30yr
- Down + closing
- —
- Monthly P&I
- —
- Monthly cashflow
- —
- DSCR
- —
- Eligible?
- —
Personal DTI + credit; lowest rate.
DSCR
20% down · 8.5% · 30yr
- Down + closing
- —
- Monthly P&I
- —
- Monthly cashflow
- —
- DSCR
- —
- Eligible?
- —
No personal income docs; deal must DSCR.
Hard money
10% down · 12.0% · 12mo
- Down + closing
- —
- Monthly P&I
- —
- Monthly cashflow
- —
- DSCR
- —
- Eligible?
- —
Short-term bridge; refi at stabilization.
Listing history 17 events
-
2026-06-19days on market $90,000 Active 38 DOM
-
2026-06-18days on market $90,000 Active 37 DOM
-
2026-06-17days on market $90,000 Active 36 DOM
-
2026-06-16days on market $90,000 Active 35 DOM
-
2026-06-15days on market $90,000 Active 34 DOM
-
2026-06-14days on market $90,000 Active 32 DOM
-
2026-06-12days on market $90,000 Active 31 DOM
-
2026-06-09days on market $90,000 Active 28 DOM
-
2026-06-08days on market $90,000 Active 27 DOM
-
2026-06-07days on market $90,000 Active 26 DOM
-
2026-06-07days on market $90,000 Active 25 DOM
-
2026-06-04days on market $90,000 Active 22 DOM
-
2026-06-02days on market $90,000 Active 21 DOM
-
2026-06-01days on market $90,000 Active 20 DOM
-
2026-05-31days on market $90,000 Active 19 DOM
-
2026-05-31days on market $90,000 Active 18 DOM
-
2026-05-12$90,000 Active 1848-char remark
ⓘ Source: listings_history table (triggers on properties + properties_extension) + one-shot
backfill from property_details.listing_events for pre-trigger history.
Tax reassessment forecast MO · Resets to sale price
- Current annual tax
- $569 · $47/mo
- Projected year-2 tax
- $873 · $73/mo
- Expected delta
- +$304/yr (+$25/mo · 53.4%)
ⓘ Screening estimate from a state-policy table — verify with the county assessor before closing.
Climate risk First Street
- Flood 1/10 Low FEMA zone X (unshaded) · 0% chance over 30 yrs
- Wildfire 2/10 Low
- Heat 3/10 Moderate 7 d/yr ≥105°F today · 16 d/yr by 30 yrs out
- Wind 2/10 Low
- Air quality 2/10 Low 1 unhealthy d/yr today · 3 by 30 yrs out
Nearby sold comps map
Loading sold comps map…
Walkable amenities ~0.75 mi
Loading nearby amenities…
Taxation est. · year 1
- Rental income
- $13,380
- − Mortgage interest
- −$5,041
- − Property taxes
- −$569
- − Insurance
- −$450
- − Repairs & maintenance
- −$1,070
- − Management
- −$1,070
- − Depreciation
- −$2,618
- Taxable income
- $2,561
- Est. tax owed @ 24.0%
- −$615
- After-tax cash flow
- $3,273/yr
For passive investors: Depreciation is non-cash, so a rental often shows a tax loss while cash-flowing — sheltering income. Rental losses are passive: they offset passive income freely, and up to $25,000/yr can offset ordinary (W-2) income if you actively participate and your MAGI is under $100k (phasing out to $0 by $150k); unused losses carry forward. On sale, claimed depreciation is recaptured at up to 25%, and gains may owe capital-gains tax (a 1031 exchange can defer both). Figures are a year-1 estimate at your 24.0% rate — not tax advice; consult a CPA.
Schools (NCES district)
- District
- La Plata R-II
- NCES district ID
- 2916950
- Math proficiency
- 45% ▼ -5.00%
- Reading proficiency
- 45% ▼ -10.00%
- Median HH income
- $36,265
- Composite
- 39.55/100
- National rank
- #8075
- State rank
- #220 of 535 in MO
Livability — La Plata
- Score
- 69/100
- State rank
- #161
- US rank
- #8872
Category grades
Schools grade is shown separately in the Schools card above.
Census & demographics
- Census place
- La Plata, MO
- City population
- 2,393
- Population (ZIP)
- 2,393
Population outlook (Macon County) Hauer SSP2
- Today (2025)
- 14,692 people
- By 2030
- 14,209 · -3.3%
- By 2040
- 13,197 · -10.2%
- By 2050
- 12,160 · -17.2%
- By 2075
- 9,745 · -33.7%
- By 2100
- 7,314 · -50.2%
Race, ethnicity, and origin ACS 2023
- Neighborhood character
- Predominantly White (97%)
- Race & ethnicity
- White 97% Two or more races 2% Asian 1%
- Common ancestry
- Slovak 2% Iranian 2% Italian 1%
- Foreign-born
- 2% · Canada
- Languages at home
- 92% English-only · German/W. Germanic 7% Other Indo-European 1%
Political lean MEDSL · Macon
- 2024 margin
- Solid R (+61.5) · D 18.9% · R 80.4%
- 2008→2024 swing
- -37.4pp toward R · 2008: -24.1pp · 2024: -61.5pp
- All cycles
- 2024: R+61.5 2020: R+56.3 2016: R+56.4 2012: R+33.4 2008: R+24.1
Not yet ingested
- Civics
- —
Market trends
- HPI YoY
- —
- Current HPI
- —
- Rent YoY
- —
- Metro
- —
- State GDP YoY
- ▲ 1.84%
- F500 in state
- 20
Industry mix (Fortune 500 HQ in MO)
| Industry | F500 HQs | Revenue |
|---|---|---|
| Healthcare | 1 | $163B |
|
||
| Insurance | 1 | $21B |
|
||
| Industrial Technology | 1 | $17B |
|
||
| Retail | 1 | $16B |
|
||
| Industrial Distribution | 1 | $10B |
|
||
| Utilities | 1 | $9B |
|
||
Price history
1 event — show timeline
- 2026-05-12 Listed $90,000 FSBO.com
Property tax history
+0.6%/yrLatest (2025): $569 · +15.9% YoY. Source: county tax records.
Cash-flow waterfall
monthlySold comps — $/sqft
last 12 mo · ≤1 miLoading sold comps…