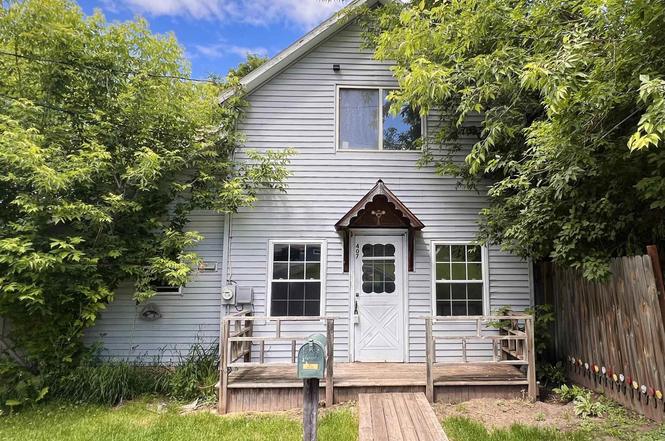
407 5th St · Iron Mountain, MI
Flood risk No data
- FEMA flood zone
- —
- Chance of flooding over 30 yrs
- —
- Est. flood insurance / yr
- —
Fire risk No data
- Est. fire insurance / yr
- —
Heat risk No data
- Hot days now (above threshold)
- —
- Hot days in 30 yrs
- —
Wind risk No data
- Chance of severe wind over 30 yrs
- —
Air-quality risk No data
- Unhealthy air days now
- —
- Unhealthy air days in 30 yrs
- —
Risk factors via First Street. Map © Google.
Why this score? — see what drove the B- grade
The composite is a weighted blend of 9 inputs, each scored 0–100. Each bar is that input's sub-score; the figure is the points it added to the 100-point composite (weight × sub-score).
- Cash flow +30.0/30.0
- 1% rule +10.0/10.0
- DSCR +10.0/10.0
- ARV discount +7.5/15.0
- Livability +3.7/5.0
- Schools +2.9/10.0
- Rent growth +2.5/5.0
- Condition / age +2.5/5.0
- Appreciation +0.0/10.0
$55,000
🖨 Deal sheet (PDF) 📄 Offer letter ✓ Due diligence
Listing remarks MLS
Investor Special with Big Potential in Iron Mountain! Located on the North side of Iron Mountain, just minutes from downtown, this 2-bedroom, 2-bath home is packed with opportunity for the right buyer. Whether you’re an investor, flipper, or someone looking to build equity, this property is ready for your vision. With a flexible layout and the potential to add a third bedroom, there’s plenty of room to increase value and make it your own. Convenient location, solid potential, and a chance to create real value can be found in this home. Bring your ideas and creativity—this property is being sold as-is and is ideal for those looking to take on a project and turn it into something special!
Key facts
- 3,484 sq ft lot
- Built 1900
- Listed 66 days
Property features AI
Finance
- Financial info: Probate listing
- HOA & community: No HOA information provided
Exterior
- Parking: No specific parking details provided
- Security: No security features listed
- Utilities: Electricity connected; Natural gas connected; Public water; Public sanitary sewer; Phone available; Internet (Spectrum)
- Home design: 1 1/2-story residential home; Built in 1900; Listed as fixer-upper / investment property
- Construction: Stone foundation; Basement (below-grade area recorded)
- Exterior features: Vinyl siding; Deck; Porch; Shed (outbuilding); Frontage on a paved, year-round city/county road; 113' frontage
Interior
- Kitchen: Kitchen on main level (approx. 14 x 12); Dishwasher, Range/Oven, Refrigerator
- Bedrooms: Two upper-level bedrooms (approx. 10 x 11 and 12 x 9)
- Flooring: Wood flooring in dining room and main bathroom; Vinyl flooring in kitchen and second bathroom; Carpet in living room
- Bathrooms: Two full bathrooms; Main-floor bathroom with wood flooring (approx. 10 x 12); Second-floor bathroom with vinyl flooring (approx. 5 x 14)
- Heating & cooling: Forced air heating; No central cooling indicated; LP/Propane fuel; Electric water heater
- Interior features: 7 total rooms; Basement (stone)
- Laundry & utility: Basement present (utility/laundry likely located in basement)
Neighborhood map
What this means for you Summary
Snapshot
- This is a 2-bed/1.0-bath single-family listed at $55k.
Deal economics
- At list price, monthly cash flow is $432 ($5k/yr) — positive.
- The deal already cash-flows at list — no discount required.
- Meets the 1% rule at list price ($1k rent vs $55k).
- Recommended offer: $52k (6.0% below list) — sets the bar for market timing.
- Cap rate 15.7% vs local median 3.8% in Iron Mountain — top-decile yield for the area; either an underpriced asset or a hidden risk that comps aren't pricing in. Stress-test before assuming the spread holds.
Location & tenants
- Location reads 73/100 on livability (#225 in MI) — a middle-class / working-renter tenant base. Strengths: cost of living A+, housing A+, health & safety A+; Watch: schools C-, crime C-, employment D.
- Iron Mountain Public Schools (town): math 24% / reading 44% proficiency, ranked #316 of 540 in MI (top 58%) — families likely to look elsewhere, expect single-tenant / working-renter base with shorter leases.
- Market conditions: 74 active listings in the ZIP; 42 units permitted in Dickinson County in 2024 (0 in 5+ unit buildings).
Forward outlook
- Local home prices are declining (-3.0%/yr); year-one equity from $380 of loan paydown is wiped out by about $2k of value loss. Plan a longer hold.
- Dickinson County population projected at -14% by 2050 — secular population decline; favor cash flow + early exit over multi-decade hold.
- At projected returns (-3.0% appreciation + 3.0% rent growth), your $15k cash investment doubles in ~4 years — after that, you're playing with house money.
Negotiation context
- It's been on market 66 days — a 6% lower offer ($52k) is reasonable based on typical stale-listing flexibility.
- 3 sale attempts with the ask held roughly flat each time — persistent listings suggest the price (not the market) is what's stuck; bring a comps-based counter.
- Current owner paid $22k; list at $55k implies a 149% gain — meaningful room to come down on a strong offer.
Risks & watch-outs
- Watch-outs: built in 1900 — expect roof / HVAC / electrical / plumbing capex.
Questions for the listing agent
- It's been on market 66 days. Have you received any prior offers? Is the seller open to a 6% concession, seller financing, or rate buy-down credit?
- Built in 1900 — when were the roof, HVAC, electrical panel, plumbing, and water heater last replaced?
- Why hasn't it sold? Are there any deal-killer items the seller is aware of (foundation, flood, title, zoning, code violations)?
- Is there a deadline driving the sale (1031 exchange, divorce, estate, relocation)? That informs how much negotiation room exists.
- What's the average days-on-market for RENTAL listings here right now (not sales)? A rising rental-DOM trend means longer vacancies and softer asking-rent achievability than the comps imply.
- What's the recent tenant-quality profile in this submarket — average credit score on applications, eviction rate, late-payment / NSF rate, and stable-employment percentage? A property-management company in the area should have these aggregated.
- How much new for-sale + rental construction is in the pipeline within 1–3 miles? Heavy new supply typically softens prices + rents 12–24 months out; constrained supply supports both.
Investment metrics
- 1% rule
- 1.84% ✓
- Cap rate
- 15.72%
- Cash-on-cash
- 33.65%
- DSCR
- 2.50
- GRM
- 4.5
CMA / ARV
- ARV (on-the-fly)
- $148,932
- Comps found
- 12
Show comp detail 12 sales within ~0.75 mi
| Address | Dist | Beds/Ba | Sqft | Sold | Price | $/sf | Match |
|---|---|---|---|---|---|---|---|
| 515 E Margaret St | 0.24mi | 2/1.0 | 1,232 (+4%) | 1mo | $87,500 | $71 | 81 |
| 903 E Margaret St | 0.46mi | 2/1.5 | 1,176 (-0%) | 7mo | $150,000 | $128 | 70 |
| 424 E Margaret St | 0.25mi | 3/2.0 (+1) | 1,200 (+2%) | 12mo | $50,000 | $42 | 67 |
| 605 Vulcan St | 0.12mi | 2/2.0 | 1,026 (-13%) | 8mo | $140,000 | $136 | 61 |
| 715 E Smith St | 0.39mi | 2/1.5 | 1,092 (-8%) | 11mo | $254,900 | $233 | 58 |
| 720 E Smith St | 0.40mi | 3/1.0 (+1) | 1,140 (-4%) | 16mo | $104,000 | $91 | 57 |
| 416 E Stanton St | 0.43mi | 3/1.5 (+1) | 1,279 (+8%) | 5mo | $45,000 | $35 | 55 |
| 508 East Grand Blvd | 0.55mi | 3/1.0 (+1) | 1,155 (-2%) | 15mo | $145,000 | $126 | 53 |
| 905 E Margaret St | 0.47mi | 3/2.0 (+1) | 1,296 (+10%) | 11mo | $250,000 | $193 | 44 |
| 734 E A St | 0.62mi | 3/1.0 (+1) | 1,056 (-11%) | 12mo | $105,000 | $99 | 39 |
| 921 E Grant St | 0.63mi | 3/1.5 (+1) | 1,288 (+9%) | 12mo | $197,000 | $153 | 38 |
| 501 E B St | 0.73mi | 3/1.5 (+1) | 1,339 (+13%) | 9mo | $115,000 | $86 | 30 |
Match score weights: distance 35% · size 25% · config 20% · recency 20%. Top-matched comps best support the ARV.
Projected returns pro-forma
-3.0% appreciation · 3.0% rent growth · sell at horizon
- IRR
- 28.9%
- Equity multiple
- 2.21×
- Total profit
- $18,601
- Equity at exit
- $8,201
- IRR
- 36.3%
- Equity multiple
- 4.35×
- Total profit
- $51,648
- Equity at exit
- $4,755
Cash invested: $15,400 (down + closing). Projections, not guarantees.
Landlord ↔ Tenant lean methodology
- Overall (STATE)
- 62 Landlord-Friendly
- State Michigan
- 62 Landlord-Friendly · EVEN
- County
- — inherits STATE
- City
- — inherits STATE
ZIP-level market 49801
- Home prices YoY
- -27.8%
- Active inventory
- 74
- Price-to-rent
- 4.5×
Monthly cashflow live
- Estimated rent
- $1,013 medium interval (Pro) →
- Mortgage (P&I)
- −$288
- Tax from tax record
- −$57 /mo · $688/yr
- Insurance
- −$23
- HOA
- −$0
- Vacancy / Maint / Mgmt
- −$213
- Net cashflow
- $432
Break-even live
Sensitivity live
| Price | -10% $463 | -5% $447 | +0% $432 | +5% $416 | +10% $401 |
|---|---|---|---|---|---|
| Rent | -10% $352 | -5% $392 | +0% $432 | +5% $472 | +10% $512 |
| Rate | -1.0pp $460 | -0.5pp $446 | base $432 | +0.5pp $418 | +1.0pp $403 |
UW: 25.0% down · 7.5% · 30yr · 1.5% tax · 5.0% vac · 8.0% maint · 8.0% mgmt
Financing live
Cash to close
- Down payment
- $13,750
- Closing costs
- $1,650
- Reserves months
- —
- Total cash needed
- —
Loan-product check · same deal, 3 products live
Conventional
25% down · 7.5% · 30yr
- Down + closing
- —
- Monthly P&I
- —
- Monthly cashflow
- —
- DSCR
- —
- Eligible?
- —
Personal DTI + credit; lowest rate.
DSCR
20% down · 8.5% · 30yr
- Down + closing
- —
- Monthly P&I
- —
- Monthly cashflow
- —
- DSCR
- —
- Eligible?
- —
No personal income docs; deal must DSCR.
Hard money
10% down · 12.0% · 12mo
- Down + closing
- —
- Monthly P&I
- —
- Monthly cashflow
- —
- DSCR
- —
- Eligible?
- —
Short-term bridge; refi at stabilization.
Listing history 21 events
-
2026-06-21days on market $55,000 Active 66 DOM
-
2026-06-18days on market $55,000 Active 64 DOM
-
2026-06-17days on market $55,000 Active 63 DOM
-
2026-06-16days on market $55,000 Active 62 DOM
-
2026-06-15days on market $55,000 Active 61 DOM
-
2026-06-13days on market $55,000 Active 59 DOM
-
2026-06-12days on market $55,000 Active 58 DOM
-
2026-06-09days on market $55,000 Active 55 DOM
-
2026-06-08days on market $55,000 Active 54 DOM
-
2026-06-07days on market $55,000 Active 53 DOM
-
2026-06-07days on market $55,000 Active 52 DOM
-
2026-06-04days on market $55,000 Active 49 DOM
-
2026-06-02days on market $55,000 Active 48 DOM
-
2026-06-01days on market $55,000 Active 47 DOM
-
2026-05-31days on market $55,000 Active 46 DOM
-
2026-05-31days on market $55,000 Active 45 DOM
-
2026-05-18status Active 713-char remark
Show marketing remark (713 chars)
Investor Special with Big Potential in Iron Mountain! Located on the North side of Iron Mountain, just minutes from downtown, this 2-bedroom, 2-bath home is packed with opportunity for the right buyer. Whether you’re an investor, flipper, or someone looking to build equity, this property is ready for your vision. With a flexible layout and the potential to add a third bedroom, there’s plenty of room to increase value and make it your own. Convenient location, solid potential, and a chance to create real value can be found in this home. Bring your ideas and creativity—this property is being sold as-is and is ideal for those looking to take on a project and turn it into something special!
-
2026-04-27historical Accepting Backup Offers 713-char remark
Show marketing remark (713 chars)
Investor Special with Big Potential in Iron Mountain! Located on the North side of Iron Mountain, just minutes from downtown, this 2-bedroom, 2-bath home is packed with opportunity for the right buyer. Whether you’re an investor, flipper, or someone looking to build equity, this property is ready for your vision. With a flexible layout and the potential to add a third bedroom, there’s plenty of room to increase value and make it your own. Convenient location, solid potential, and a chance to create real value can be found in this home. Bring your ideas and creativity—this property is being sold as-is and is ideal for those looking to take on a project and turn it into something special!
-
2026-04-16$55,000 Active 713-char remark
Show marketing remark (713 chars)
Investor Special with Big Potential in Iron Mountain! Located on the North side of Iron Mountain, just minutes from downtown, this 2-bedroom, 2-bath home is packed with opportunity for the right buyer. Whether you’re an investor, flipper, or someone looking to build equity, this property is ready for your vision. With a flexible layout and the potential to add a third bedroom, there’s plenty of room to increase value and make it your own. Convenient location, solid potential, and a chance to create real value can be found in this home. Bring your ideas and creativity—this property is being sold as-is and is ideal for those looking to take on a project and turn it into something special!
-
2026-04-15$55,000 Active 713-char remark
Show marketing remark (713 chars)
Investor Special with Big Potential in Iron Mountain! Located on the North side of Iron Mountain, just minutes from downtown, this 2-bedroom, 2-bath home is packed with opportunity for the right buyer. Whether you’re an investor, flipper, or someone looking to build equity, this property is ready for your vision. With a flexible layout and the potential to add a third bedroom, there’s plenty of room to increase value and make it your own. Convenient location, solid potential, and a chance to create real value can be found in this home. Bring your ideas and creativity—this property is being sold as-is and is ideal for those looking to take on a project and turn it into something special!
-
2002-07-31soldstatus $22,100
ⓘ Source: listings_history table (triggers on properties + properties_extension) + one-shot
backfill from property_details.listing_events for pre-trigger history.
Tax reassessment forecast MI · Partial reset (capped growth)
- Current annual tax
- $688 · $57/mo
- Projected year-2 tax
- $767 · $64/mo
- Expected delta
- +$80/yr (+$7/mo · 11.6%)
ⓘ Screening estimate from a state-policy table — verify with the county assessor before closing.
Nearby sold comps map
Loading sold comps map…
Walkable amenities ~0.75 mi
Loading nearby amenities…
Taxation est. · year 1
- Rental income
- $12,159
- − Mortgage interest
- −$3,081
- − Property taxes
- −$688
- − Insurance
- −$275
- − Repairs & maintenance
- −$973
- − Management
- −$973
- − Depreciation
- −$1,600
- Taxable income
- $4,570
- Est. tax owed @ 24.0%
- −$1,097
- After-tax cash flow
- $4,085/yr
For passive investors: Depreciation is non-cash, so a rental often shows a tax loss while cash-flowing — sheltering income. Rental losses are passive: they offset passive income freely, and up to $25,000/yr can offset ordinary (W-2) income if you actively participate and your MAGI is under $100k (phasing out to $0 by $150k); unused losses carry forward. On sale, claimed depreciation is recaptured at up to 25%, and gains may owe capital-gains tax (a 1031 exchange can defer both). Figures are a year-1 estimate at your 24.0% rate — not tax advice; consult a CPA.
Schools (NCES district)
- District
- Iron Mountain Public Schools
- NCES district ID
- 2619410
- Math proficiency
- 24% ▼ -7.00%
- Reading proficiency
- 44% ▼ -5.00%
- Median HH income
- $40,676
- Composite
- 28.55/100
- National rank
- #6729
- State rank
- #316 of 540 in MI
Livability — Iron Mountain
- Score
- 73/100
- State rank
- #225
- US rank
- #5664
Category grades
Schools grade is shown separately in the Schools card above.
Census & demographics
- Census place
- Iron Mountain, MI
- Population (ZIP)
- 11,606
Population outlook (Dickinson County) Hauer SSP2
- Today (2025)
- 25,175 people
- By 2030
- 24,647 · -2.1%
- By 2040
- 23,176 · -7.9%
- By 2050
- 21,605 · -14.2%
- By 2075
- 18,429 · -26.8%
- By 2100
- 14,394 · -42.8%
Race, ethnicity, and origin ACS 2023
- Neighborhood character
- Predominantly White (93%)
- Race & ethnicity
- White 93% Two or more races 3% Hispanic / Latino 2% Black 1% Native American 1%
- Common ancestry
- Lithuanian 8% Romanian 7% Portuguese 3%
- Foreign-born
- 2% · Canada
- Languages at home
- 98% English-only · Other Indo-European 1%
Political lean MEDSL · Dickinson
- 2024 margin
- Solid R (+36.3) · D 31.1% · R 67.4% · Other 1.5%
- 2008→2024 swing
- -28.4pp toward R · 2008: -7.9pp · 2024: -36.3pp
- All cycles
- 2024: R+36.3 2020: R+33.4 2016: R+35.4 2012: R+21.4 2008: R+7.9
Not yet ingested
- Civics
- —
Market trends
- HPI YoY
- ▼ -73.55%
- Current HPI
- 191.087
- Rent YoY
- —
- Metro
- —
- State GDP YoY
- ▲ 1.37%
- F500 in state
- 28
Industry mix (Fortune 500 HQ in MI)
| Industry | F500 HQs | Revenue |
|---|---|---|
| Automotive Parts | 3 | $48B |
|
||
| Automotive | 2 | $372B |
|
||
| Chemicals | 1 | $45B |
|
||
| Automotive Retail | 1 | $29B |
|
||
| Healthcare / Medical Devices | 1 | $23B |
|
||
| Automotive Technology | 1 | $20B |
|
||
Price history
+148.9% since first listed5 events — show timeline
- 2026-05-18 Relisted — MiRealSource-MiMLS
- 2026-04-27 Contingent — MiRealSource-MiMLS
- 2026-04-16 Listed $55,000 UPAR
- 2026-04-15 Listed $55,000 MiRealSource-MiMLS
- 2002-07-31 Sold (Public Records) $22,100 Public Records
Property tax history
+1.2%/yrLatest (2025): $688 · -10.5% YoY. Source: county tax records.
Cash-flow waterfall
monthlySold comps — $/sqft
last 12 mo · ≤1 miLoading sold comps…