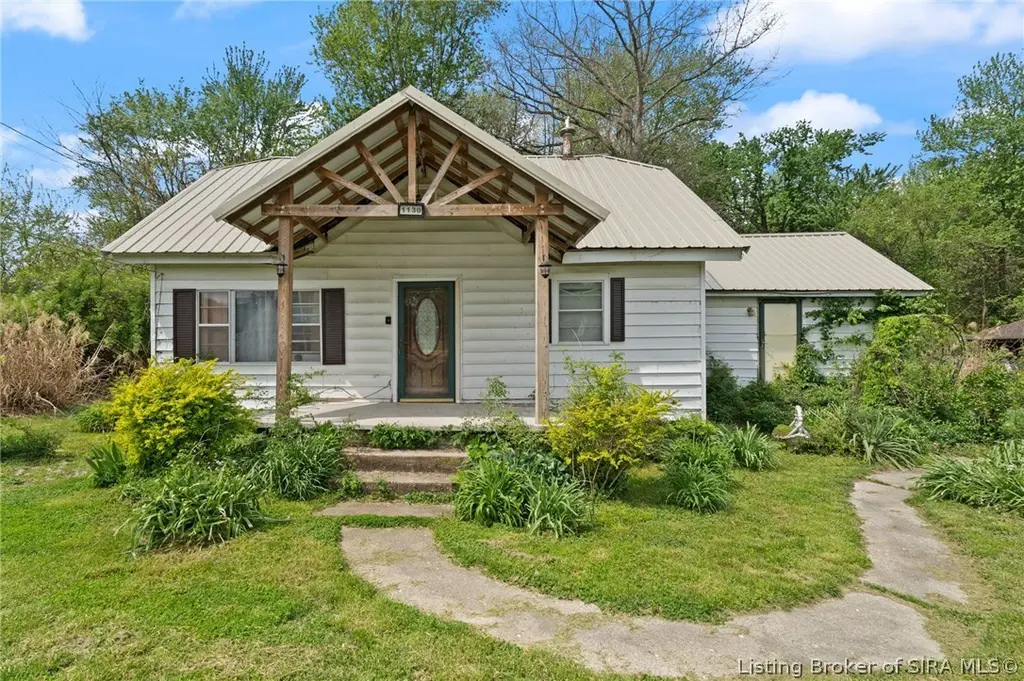
1130 N Church St · Austin, IN
Flood risk 1/10 · Minimal
- FEMA flood zone
- X (unshaded)
- Chance of flooding over 30 yrs
- 0.0%
- Est. flood insurance / yr
- $507 – $1,088
Fire risk 1/10 · Minimal
- Est. fire insurance / yr
- $717 – $1,331
Heat risk 4/10 · Minor
- Hot days now (above 104°F)
- 7 days/yr
- Hot days in 30 yrs
- 19 days/yr
Wind risk 2/10 · Minimal
- Chance of severe wind over 30 yrs
- 2.0%
Air-quality risk 2/10 · Minimal
- Unhealthy air days now
- 0 days/yr
- Unhealthy air days in 30 yrs
- 1 days/yr
Risk factors via First Street. Map © Google.
Why this score? — see what drove the D grade
The composite is a weighted blend of 9 inputs, each scored 0–100. Each bar is that input's sub-score; the figure is the points it added to the 100-point composite (weight × sub-score).
- ARV discount +15.0/15.0
- Cash flow +12.1/30.0
- DSCR +3.6/10.0
- Livability +3.0/5.0
- Rent growth +2.5/5.0
- Condition / age +2.5/5.0
- 1% rule +2.2/10.0
- Schools +1.7/10.0
- Appreciation +0.0/10.0
$129,500
🖨 Deal sheet (PDF) 📄 Offer letter ✓ Due diligence
Listing remarks MLS
AFFORABLE home with large yard AND a garage. CHEAPER THAN RENT!!! This home is a 1,564 sq ft home with 3 bedrooms, 1.5 baths ( * Steps to go upstairs are steep * ), & screened in porch. The property has a paved driveway with large oversized parking area large enough for 5 or 6 vehicles. Large garage which use to be a mom & pop grocery store several years ago that is a 1,326 square foot building. Home needs TLC but a great value. Also ideal for investors who may be looking for a residential rental. This is a GREAT investment opportunity as a renovation project/flip property. This 1.2 acre property has 239 feet of road frontage. The property is being sold "AS-IS". This home/property is a CASH or CONVENTIONAL loan only. It will not qualify for FHA or VA loan type.
Key facts
- Finished attic
- Screened-in porch
- Paved driveway
Tags
Neighborhood map
What this means for you Summary
Snapshot
- This is a 3-bed/1.5-bath single-family listed at $130k.
Deal economics
- At list price, monthly cash flow is $-28 ($-342/yr) — negative.
- To cash-flow at today's rent, offer at most $124k (3.9% below list).
- To meet the 1% rule (rent ≥ 1% of price), the offer needs to be $93k (28.4% below list).
- Recommended offer: $93k (28.4% below list) — sets the bar for 1% rule.
- Cap rate 6.0% vs local median 4.2% in Austin — top-decile yield for the area; either an underpriced asset or a hidden risk that comps aren't pricing in. Stress-test before assuming the spread holds.
Location & tenants
- Location reads 60/100 on livability (#523 in IN) — a middle-class / working-renter tenant base. Strengths: crime A+, cost of living A+; Watch: health & safety D, amenities F, commute F.
- Scott County School District 1 (town): math 16% / reading 26% proficiency, ranked #274 of 301 in IN (top 91%) — low school quality limits family demand, transient renter base, plan for 1-2y turnover; 63% free/reduced lunch — lower-income household profile, screen leases tightly.
- Zoned schools: Austin Elementary School (math 23% / reading 20%, grade F, #803 of 994 statewide, top 81%, 612 students, 64% FRL); Austin Middle School (math 10% / reading 26%, grade F, #279 of 330 statewide, top 86%, 275 students, 56% FRL); Austin High School (math 12% / reading 47%, grade F, #308 of 369 statewide, top 84%, 432 students, 52% FRL).
- Market conditions: 54 active listings in the ZIP; 2 comparable units currently listed for rent nearby; 73 units permitted in Scott County in 2024 (0 in 5+ unit buildings).
Forward outlook
- Local home prices are declining (-3.0%/yr); year-one equity from $895 of loan paydown is wiped out by about $4k of value loss. Plan a longer hold.
- Scott County population projected at -23% by 2050 — secular population decline; favor cash flow + early exit over multi-decade hold.
Negotiation context
- It's been on market 57 days — a 3% lower offer ($126k) is reasonable based on typical stale-listing flexibility.
- 2 sale attempts; this cycle's ask has dropped $39k (23%) from the opening price — seller is motivated, your offer sets the floor, not the list.
Risks & watch-outs
- Watch-outs: built in 1935 — expect roof / HVAC / electrical / plumbing capex.
Questions for the listing agent
- What do current leases actually rent for vs. the listed asking? Can we see a recent rent roll and the last 12 months of T-12 income?
- It's been on market 57 days. Have you received any prior offers? Is the seller open to a 28% concession, seller financing, or rate buy-down credit?
- Built in 1935 — when were the roof, HVAC, electrical panel, plumbing, and water heater last replaced?
- Is there a deadline driving the sale (1031 exchange, divorce, estate, relocation)? That informs how much negotiation room exists.
- Schools are F-rated, which usually means shorter tenancies and higher turnover. Who's the typical renter profile here, and what's been the actual vacancy rate?
- The area grade is low — what's the realistic commute time and amenity access for the typical tenant pool here? Any planned neighborhood developments (good or bad) we should know about?
- What's the average days-on-market for RENTAL listings here right now (not sales)? A rising rental-DOM trend means longer vacancies and softer asking-rent achievability than the comps imply.
- What's the recent tenant-quality profile in this submarket — average credit score on applications, eviction rate, late-payment / NSF rate, and stable-employment percentage? A property-management company in the area should have these aggregated.
- How much new for-sale + rental construction is in the pipeline within 1–3 miles? Heavy new supply typically softens prices + rents 12–24 months out; constrained supply supports both.
Investment metrics
- 1% rule
- 0.72% ✗
- Cap rate
- 6.03%
- Cash-on-cash
- -0.94%
- DSCR
- 0.96
- GRM
- 11.6
CMA / ARV
- ARV (median comp)
- $163,605
- List price
- $129,500
- Delta
- -20.85%
- Verdict
- UNDERPRICED
- Comps
- 20 within 1.0 mi
Show comp detail 12 sales within ~0.75 mi
| Address | Dist | Beds/Ba | Sqft | Sold | Price | $/sf | Match |
|---|---|---|---|---|---|---|---|
| 1116 Mann Ave | 0.16mi | 4/2.0 (+1) | 1,535 (-2%) | 0mo | $184,900 | $120 | 82 |
| 1154 Clay St | 0.11mi | 3/2.0 | 1,456 (-7%) | 4mo | $90,000 | $62 | 78 |
| 41 Rural St | 0.30mi | 2/1.0 (-1) | 1,608 (+3%) | 2mo | $130,000 | $81 | 72 |
| 137 Bowles Cir | 0.20mi | 3/2.5 | 1,404 (-10%) | 3mo | $185,000 | $132 | 67 |
| 982 N Third St | 0.16mi | 3/2.0 | 1,340 (-14%) | 1mo | $184,900 | $138 | 65 |
| 188 Paulanna Ave | 0.42mi | 3/2.0 | 1,470 (-6%) | 9mo | $179,900 | $122 | 61 |
| 821 N First St | 0.32mi | 4/2.0 (+1) | 1,475 (-6%) | 12mo | $149,900 | $102 | 59 |
| 255 Church St | 0.61mi | 3/2.0 | 1,483 (-5%) | 5mo | $167,000 | $113 | 56 |
| 385 Wilbur Ave | 0.21mi | 3/2.0 | 1,338 (-14%) | 11mo | $190,000 | $142 | 55 |
| 746 Goodin Dr | 0.44mi | 3/2.0 | 1,343 (-14%) | 5mo | $180,000 | $134 | 50 |
| 748 Goodin Dr | 0.43mi | 3/2.0 | 1,343 (-14%) | 6mo | $164,000 | $122 | 50 |
| 625 N Church St | 0.37mi | 4/2.0 (+1) | 1,350 (-14%) | 12mo | $170,000 | $126 | 43 |
Match score weights: distance 35% · size 25% · config 20% · recency 20%. Top-matched comps best support the ARV.
Projected returns pro-forma
-3.0% appreciation · 3.0% rent growth · sell at horizon
- IRR
- -17.9%
- Equity multiple
- 0.37×
- Total profit
- $-22,867
- Equity at exit
- $19,309
- IRR
- -10.2%
- Equity multiple
- 0.38×
- Total profit
- $-22,524
- Equity at exit
- $11,197
Cash invested: $36,260 (down + closing). Projections, not guarantees.
Landlord ↔ Tenant lean methodology
- Overall (STATE)
- 90 Strongly Landlord-Friendly
- State Indiana
- 90 Strongly Landlord-Friendly · R+11
- County
- — inherits STATE
- City
- — inherits STATE
ZIP-level market 47102
- Home prices YoY
- -8.9%
- Active inventory
- 54
- Price-to-rent
- 11.6×
Monthly cashflow live
- Estimated rent
- $928 medium interval (Pro) →
- Mortgage (P&I)
- −$679
- Tax from tax record
- −$28 /mo · $341/yr
- Insurance
- −$54
- HOA
- −$0
- Vacancy / Maint / Mgmt
- −$195
- Net cashflow
- $-28
Break-even live
Sensitivity live
| Price | -10% $45 | -5% $8 | +0% $-28 | +5% $-65 | +10% $-102 |
|---|---|---|---|---|---|
| Rent | -10% $-102 | -5% $-65 | +0% $-28 | +5% $8 | +10% $45 |
| Rate | -1.0pp $37 | -0.5pp $4 | base $-28 | +0.5pp $-62 | +1.0pp $-96 |
UW: 25.0% down · 7.5% · 30yr · 1.5% tax · 5.0% vac · 8.0% maint · 8.0% mgmt
Financing live
Cash to close
- Down payment
- $32,375
- Closing costs
- $3,885
- Reserves months
- —
- Total cash needed
- —
Loan-product check · same deal, 3 products live
Conventional
25% down · 7.5% · 30yr
- Down + closing
- —
- Monthly P&I
- —
- Monthly cashflow
- —
- DSCR
- —
- Eligible?
- —
Personal DTI + credit; lowest rate.
DSCR
20% down · 8.5% · 30yr
- Down + closing
- —
- Monthly P&I
- —
- Monthly cashflow
- —
- DSCR
- —
- Eligible?
- —
No personal income docs; deal must DSCR.
Hard money
10% down · 12.0% · 12mo
- Down + closing
- —
- Monthly P&I
- —
- Monthly cashflow
- —
- DSCR
- —
- Eligible?
- —
Short-term bridge; refi at stabilization.
Rent comps 2 comps
| Address | Beds | Baths | Sqft | Rent | $/sqft | DOM | Units | Dist |
|---|---|---|---|---|---|---|---|---|
| 20 Red Oak Way Austin, IN | 2.0 | 2.0 | 1080 | $929 | $0.86 | 45d | 1 | 0.43mi |
| 527 W Cherry St Austin, IN | 2.0 | 1.0 | 1080 | $925 | $0.86 | 45d | 1 | 1.03mi |
Listing history 12 events
-
2026-06-12pricedays on market $129,500 Active 57 DOM
-
2026-06-09days on market $153,500 Active 54 DOM
-
2026-06-08days on market $153,500 Active 53 DOM
-
2026-06-07days on market $153,500 Active 52 DOM
-
2026-06-05days on market $153,500 Active 50 DOM
-
2026-06-04days on market $153,500 Active 48 DOM
-
2026-06-02days on market $153,500 Active 47 DOM
-
2026-06-01days on market $153,500 Active 46 DOM
-
2026-05-31days on market $153,500 Active 45 DOM
-
2026-05-31days on market $153,500 Active 44 DOM
-
2026-04-16$134,500 Active 792-char remark
Show marketing remark (896 chars)
Are you looking for an affordable home and some land with space between you and the neighbors on each side of you? This one is it! This home is a 1,564 sq ft home with 3 bedrooms, 1.5 baths ( * Steps to go upstairs are steep * ), & screened in porch. The property has a paved driveway with large oversized parking area large enough for 5 or 6 vehicles. Large garage which use to be a mom & pop grocery store several years ago that is a 1,326 square foot building. Home needs TLC but a great value with a livable home, garage, AND a vacant lot. Also ideal for investors who may be looking for a residential rental. this is a GREAT investment opportunity as a renovation project/flip property. This 2.48-acre property with 389 feet of road frontage. The property is being sold "AS-IS". This home is a CASH or CONVENTIONAL loan only. It will not qualify for FHA or VA loan type.
-
2026-04-16$168,500 Active 896-char remark
Show marketing remark (896 chars)
Are you looking for an affordable home and some land with space between you and the neighbors on each side of you? This one is it! This home is a 1,564 sq ft home with 3 bedrooms, 1.5 baths ( * Steps to go upstairs are steep * ), & screened in porch. The property has a paved driveway with large oversized parking area large enough for 5 or 6 vehicles. Large garage which use to be a mom & pop grocery store several years ago that is a 1,326 square foot building. Home needs TLC but a great value with a livable home, garage, AND a vacant lot. Also ideal for investors who may be looking for a residential rental. this is a GREAT investment opportunity as a renovation project/flip property. This 2.48-acre property with 389 feet of road frontage. The property is being sold "AS-IS". This home is a CASH or CONVENTIONAL loan only. It will not qualify for FHA or VA loan type.
ⓘ Source: listings_history table (triggers on properties + properties_extension) + one-shot
backfill from property_details.listing_events for pre-trigger history.
Tax reassessment forecast IN · Partial reset (capped growth)
- Current annual tax
- $341 · $28/mo
- Projected year-2 tax
- $721 · $60/mo
- Expected delta
- +$380/yr (+$32/mo · 111.6%)
ⓘ Screening estimate from a state-policy table — verify with the county assessor before closing.
Climate risk First Street
- Flood 1/10 Low FEMA zone X (unshaded) · 0% chance over 30 yrs
- Wildfire 1/10 Low
- Heat 4/10 Moderate 7 d/yr ≥104°F today · 19 d/yr by 30 yrs out
- Wind 2/10 Low 2% chance of damaging wind over 30 yrs
- Air quality 2/10 Low 0 unhealthy d/yr today · 1 by 30 yrs out
Nearby sold comps map
Loading sold comps map…
Walkable amenities ~0.75 mi
Loading nearby amenities…
Taxation est. · year 1
- Rental income
- $11,134
- − Mortgage interest
- −$7,254
- − Property taxes
- −$341
- − Insurance
- −$648
- − Repairs & maintenance
- −$891
- − Management
- −$891
- − Depreciation
- −$3,767
- Taxable loss
- −$2,657
- Est. tax savings @ 24.0%
- +$638
- After-tax cash flow
- $296/yr
For passive investors: Depreciation is non-cash, so a rental often shows a tax loss while cash-flowing — sheltering income. Rental losses are passive: they offset passive income freely, and up to $25,000/yr can offset ordinary (W-2) income if you actively participate and your MAGI is under $100k (phasing out to $0 by $150k); unused losses carry forward. On sale, claimed depreciation is recaptured at up to 25%, and gains may owe capital-gains tax (a 1031 exchange can defer both). Figures are a year-1 estimate at your 24.0% rate — not tax advice; consult a CPA.
Schools (NCES district)
- District
- Scott County School District 1
- NCES district ID
- 1809990
- Math proficiency
- 16% ▼ -21.00%
- Reading proficiency
- 26% ▼ -10.00%
- Median HH income
- $36,972
- Composite
- 17.46/100
- National rank
- #9062
- State rank
- #274 of 301 in IN
Livability — Austin
- Score
- 60/100
- State rank
- #523
- US rank
- #18774
Category grades
Schools grade is shown separately in the Schools card above.
Census & demographics
- Census place
- Austin, IN
- City population
- 6,647
- Population (ZIP)
- 6,647
Population outlook (Scott County) Hauer SSP2
- Today (2025)
- 22,525 people
- By 2030
- 21,609 · -4.1%
- By 2040
- 19,536 · -13.3%
- By 2050
- 17,370 · -22.9%
- By 2075
- 12,862 · -42.9%
- By 2100
- 9,340 · -58.5%
Race, ethnicity, and origin ACS 2023
- Neighborhood character
- Predominantly White (96%)
- Race & ethnicity
- White 96% Hispanic / Latino 2% Two or more races 2%
- Common ancestry
- Slovak 2% Lithuanian 2% Italian 1%
- Foreign-born
- 1% · Canada
Political lean MEDSL · Scott
- 2024 margin
- Solid R (+51.5) · D 23.4% · R 74.9% · Other 1.6%
- 2008→2024 swing
- -49.5pp toward R · 2008: -2.0pp · 2024: -51.5pp
- All cycles
- 2024: R+51.5 2020: R+45.6 2016: R+37.9 2012: R+6.2 2008: R+2.0
Not yet ingested
- Civics
- —
Market trends
- HPI YoY
- ▼ -25.77%
- Current HPI
- 263.604
- Rent YoY
- —
- Metro
- —
- State GDP YoY
- ▲ 2.90%
- F500 in state
- 18
Industry mix (Fortune 500 HQ in IN)
| Industry | F500 HQs | Revenue |
|---|---|---|
| Industrial Machinery | 2 | $37B |
|
||
| Healthcare | 1 | $177B |
|
||
| Pharmaceuticals | 1 | $45B |
|
||
| Metals / Steel | 1 | $18B |
|
||
| Agriculture | 1 | $17B |
|
||
| Packaging | 1 | $12B |
|
||
Price history
+25.3% since first listed2 events — show timeline
- 2026-04-16 Listed $168,500 SIRA
- 2026-04-16 Listed $134,500 SIRA
Property tax history
-2.8%/yrLatest (2024): $341 · +2.9% YoY. Source: county tax records.
Cash-flow waterfall
monthlySold comps — $/sqft
last 12 mo · ≤1 miLoading sold comps…