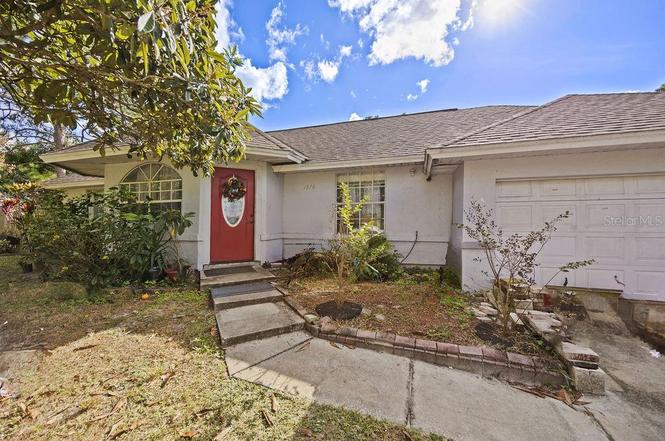
1376 Danbury St SW · Palm Bay, FL
Flood risk 3/10 · Minor
- FEMA flood zone
- X (unshaded)
- Chance of flooding over 30 yrs
- 0.2%
- Est. flood insurance / yr
- $507 – $1,088
Fire risk 3/10 · Minor
- Est. fire insurance / yr
- $947 – $1,759
Heat risk 9/10 · Severe
- Hot days now (above 106°F)
- 6 days/yr
- Hot days in 30 yrs
- 19 days/yr
Wind risk 10/10 · Severe
- Chance of severe wind over 30 yrs
- 99.0%
Air-quality risk 1/10 · Minimal
- Unhealthy air days now
- 0 days/yr
- Unhealthy air days in 30 yrs
- 0 days/yr
Risk factors via First Street. Map © Google.
Why this score? — see what drove the C- grade
The composite is a weighted blend of 9 inputs, each scored 0–100. Each bar is that input's sub-score; the figure is the points it added to the 100-point composite (weight × sub-score).
- Cash flow +21.0/30.0
- ARV discount +7.5/15.0
- DSCR +6.7/10.0
- 1% rule +4.7/10.0
- Schools +4.7/10.0
- Livability +3.6/5.0
- Rent growth +2.8/5.0
- Condition / age +2.5/5.0
- Appreciation +0.0/10.0
$219,900
🖨 Deal sheet 📄 Offer letter ✓ Due diligence
Listing remarks MLS
This home is also for rent, owner will consider lease/option. Easy to show. Current owner has extra lot fenced in back. Extra lot is NOT included in price, but owner will consider offer to purchase additional lot. (Shed does not stay. )(Rental MLS #488418.)
Key facts
- Close to schools
- New septic system
- New ac
Tags
Neighborhood map
What this means for you Summary
Snapshot
- This is a 3-bed/2.0-bath single-family listed at $220k.
Deal economics
- At list price, monthly cash flow is $311 ($4k/yr) — positive.
- The deal already cash-flows at list — no discount required.
- To meet the 1% rule (rent ≥ 1% of price), the offer needs to be $214k (2.9% below list).
- Recommended offer: $207k (6.0% below list) — sets the bar for market timing.
Location & tenants
- Location reads 72/100 on livability (#366 in FL) — a middle-class / working-renter tenant base. Strengths: cost of living A+, housing A+; Watch: schools C-, employment D+, amenities F.
- Brevard (suburban): math 53% / reading 57% proficiency, ranked #19 of 73 in FL (top 26%) — acceptable for families but not a draw, mixed tenant base, ~2y average lease.
- Market conditions: Rents rising (+1.3%/yr); 1020 active listings in the ZIP; 22 comparable units currently listed for rent nearby; rentals at typical pace (median 23d on market — plan ~3-4 weeks tenant-placement turnaround); solid renter incomes; 4,602 units permitted in Brevard County in 2024 (702 in 5+ unit buildings).
- This rent runs 32% of the median local income ($80k/yr) — at the standard rent-burdened threshold; future hikes will face affordability resistance.
Forward outlook
- Local home prices are declining (-3.0%/yr); year-one equity from $2k of loan paydown is wiped out by about $7k of value loss. Plan a longer hold.
- Brevard County population projected at +15% by 2050 — modest demand growth; plan on rents tracking national, not racing it.
Negotiation context
- It's been on market 75 days — a 6% lower offer ($207k) is reasonable based on typical stale-listing flexibility.
- 3 sale attempts since 19y ago; this cycle's ask has dropped $50k (19%) from the opening price — seller is motivated, your offer sets the floor, not the list.
- Current owner paid $57k; list at $220k implies a 286% gain — meaningful room to come down on a strong offer.
Risks & watch-outs
- Climate carrying-cost: severe wind risk, 99% chance of damaging wind over 30y; extreme-heat days projected 6→19/yr by 2055 (HVAC capex compounding) — expect insurance premiums to compound above CPI over the hold.
Questions for the listing agent
- It's been on market 75 days. Have you received any prior offers? Is the seller open to a 6% concession, seller financing, or rate buy-down credit?
- Why hasn't it sold? Are there any deal-killer items the seller is aware of (foundation, flood, title, zoning, code violations)?
- Is there a deadline driving the sale (1031 exchange, divorce, estate, relocation)? That informs how much negotiation room exists.
- What's the average days-on-market for RENTAL listings here right now (not sales)? A rising rental-DOM trend means longer vacancies and softer asking-rent achievability than the comps imply.
- What's the recent tenant-quality profile in this submarket — average credit score on applications, eviction rate, late-payment / NSF rate, and stable-employment percentage? A property-management company in the area should have these aggregated.
- How much new for-sale + rental construction is in the pipeline within 1–3 miles? Heavy new supply typically softens prices + rents 12–24 months out; constrained supply supports both.
Investment metrics
- 1% rule
- 0.97% ✗
- Cap rate
- 7.99%
- Cash-on-cash
- 6.07%
- DSCR
- 1.27
- GRM
- 8.6
CMA / ARV
No comps found within radius.
Projected returns pro-forma
-3.0% appreciation · 1.29% rent growth · sell at horizon
- IRR
- -8.8%
- Equity multiple
- 0.68×
- Total profit
- $-19,478
- Equity at exit
- $32,788
- IRR
- -1.5%
- Equity multiple
- 0.90×
- Total profit
- $-5,985
- Equity at exit
- $19,013
Cash invested: $61,572 (down + closing). Projections, not guarantees.
Landlord ↔ Tenant lean methodology
- Overall (STATE)
- 87 Strongly Landlord-Friendly
- State Florida
- 87 Strongly Landlord-Friendly · R+3
- County
- — inherits STATE
- City
- — inherits STATE
ZIP-level market 32908
- Home prices YoY
- -10.4%
- Rents YoY
- 1.3%
- Active inventory
- 1020
- Price-to-rent
- 8.6×
Monthly cashflow live
- Estimated rent
- $2,135 high interval (Pro) →
- Mortgage (P&I)
- −$1,153
- Tax from tax record
- −$131 /mo · $1,568/yr
- Insurance
- −$92
- HOA
- −$0
- Vacancy / Maint / Mgmt
- −$448
- Net cashflow
- $311
Break-even live
UW: 25.0% down · 7.5% · 30yr · 1.5% tax · 5.0% vac · 8.0% maint · 8.0% mgmt
Financing live
Cash to close
- Down payment
- $54,975
- Closing costs
- $6,597
- Reserves months
- —
- Total cash needed
- —
Loan-product check · same deal, 3 products live
Conventional
25% down · 7.5% · 30yr
- Down + closing
- —
- Monthly P&I
- —
- Monthly cashflow
- —
- DSCR
- —
- Eligible?
- —
Personal DTI + credit; lowest rate.
DSCR
20% down · 8.5% · 30yr
- Down + closing
- —
- Monthly P&I
- —
- Monthly cashflow
- —
- DSCR
- —
- Eligible?
- —
No personal income docs; deal must DSCR.
Hard money
10% down · 12.0% · 12mo
- Down + closing
- —
- Monthly P&I
- —
- Monthly cashflow
- —
- DSCR
- —
- Eligible?
- —
Short-term bridge; refi at stabilization.
Rent comps 22 comps
| Address | Beds | Baths | Sqft | Rent | $/sqft | DOM | Units | Dist |
|---|---|---|---|---|---|---|---|---|
| 271 Wendover Rd SW Palm Bay, FL | 3.0 | 2.0 | 1425 | $1,900 | $1.33 | 23d | 1 | 0.46mi |
| 1357 Mineral Loop Dr NW Palm Bay, FL | 3.0 | 2.0 | 1738 | $2,150 | $1.24 | 13d | 1 | 0.47mi |
| 465 Birch Ave SW Palm Bay, FL | 3.0 | 2.0 | 1252 | $2,000 | $1.60 | 23d | 1 | 0.64mi |
| 1357 Sequoia Rd NW Palm Bay, FL | 3.0 | 2.0 | 1874 | $2,200 | $1.17 | 23d | 1 | 0.70mi |
| 1388 Hazel St NW Palm Bay, FL | 3.0 | 2.0 | 1475 | $1,894 | $1.28 | 14d | 1 | 0.72mi |
| 1830 Diablo Cir SW Palm Bay, FL | 3.0 | 2.0 | 1451 | $1,995 | $1.37 | 14d | 1 | 0.76mi |
| 403 Tillman Ave SW Palm Bay, FL | 3.0 | 2.0 | 1056 | $1,750 | $1.66 | 21d | 1 | 0.78mi |
| 1975 Diablo Cir SW Palm Bay, FL | 4.0 | 2.0 | 1801 | $2,800 | $1.55 | 12d | 1 | 0.83mi |
| 1572 Holbrook Rd NW Palm Bay, FL | 3.0 | 2.0 | 1256 | $1,945 | $1.55 | 23d | 1 | 0.91mi |
| 308 Tamarind Cir NW Palm Bay, FL | 3.0 | 2.0 | 1350 | $2,100 | $1.56 | 23d | 1 | 0.93mi |
| 1215 Hastings Rd SW Palm Bay, FL | 3.0 | 2.0 | 1294 | $1,775 | $1.37 | 18d | 1 | 0.97mi |
| 1699 Givens Ct NW Palm Bay, FL | 3.0 | 2.0 | 1458 | $1,900 | $1.30 | 14d | 1 | 1.05mi |
| 496 Iroquois Ave NW Palm Bay, FL | 3.0 | 2.0 | 1128 | $1,950 | $1.73 | 23d | 1 | 1.10mi |
| 751 Winchell St SW Palm Bay, FL | 3.0 | 2.0 | 1160 | $1,960 | $1.69 | 18d | 1 | 1.13mi |
| Town Rd SW Palm Bay, FL | 3.0 | 2.0 | 1600 | $1,995 | $1.25 | 23d | 1 | 1.14mi |
| 191 Turk Rd SW Palm Bay, FL | 4.0 | 2.0 | 1604 | $2,485 | $1.55 | 23d | 1 | 1.14mi |
| 436 Wimpole Ln SW Palm Bay, FL | 4.0 | 2.0 | 1806 | $2,300 | $1.27 | 23d | 1 | 1.17mi |
| 1309 Gideon St SW Palm Bay, FL | 3.0 | 2.0 | 1350 | $1,800 | $1.33 | 23d | 1 | 1.21mi |
| 1309 Gideon St SW Palm Bay, FL | 3.0 | 2.0 | 1252 | $1,800 | $1.44 | 20d | 1 | 1.21mi |
| 1374 Jupiter Blvd NW Palm Bay, FL | 3.0 | 2.0 | 1500 | $1,895 | $1.26 | 23d | 1 | 1.22mi |
| 2127 Jupiter Blvd SW Palm Bay, FL | 3.0 | 2.0 | 1104 | $1,885 | $1.71 | 23d | 1 | 1.27mi |
| 983 Pyracantha St NW Palm Bay, FL | 4.0 | 2.0 | 1659 | $1,999 | $1.20 | 23d | 1 | 1.36mi |
Listing history 13 events
-
2026-03-10status Pending
-
2026-03-01historical
-
2026-02-17price $219,900
-
2026-02-03price $229,000
-
2026-01-29price $245,000
-
2026-01-19price $250,000
-
2026-01-06price $259,000
-
2025-12-16$270,000 Active
-
2016-08-16historical 257-char remark
Show marketing remark (257 chars)
This home is also for rent, owner will consider lease/option. Easy to show. Current owner has extra lot fenced in back. Extra lot is NOT included in price, but owner will consider offer to purchase additional lot. (Shed does not stay. )(Rental MLS #488418.)
-
2009-03-20soldstatus $57,000
-
2009-02-20soldstatus $57,000 47-char remark
Show marketing remark (47 chars)
Priced to sell - make an offer! Eat-in kitchen.
-
2008-11-24$57,000 47-char remark
Show marketing remark (47 chars)
Priced to sell - make an offer! Eat-in kitchen.
-
2007-10-22$199,900 257-char remark
Show marketing remark (257 chars)
This home is also for rent, owner will consider lease/option. Easy to show. Current owner has extra lot fenced in back. Extra lot is NOT included in price, but owner will consider offer to purchase additional lot. (Shed does not stay. )(Rental MLS #488418.)
ⓘ Source: listings_history table (triggers on properties + properties_extension) + one-shot
backfill from property_details.listing_events for pre-trigger history.
Tax reassessment forecast FL · Resets to sale price
- Current annual tax
- $1,568 · $131/mo
- Projected year-2 tax
- $1,825 · $152/mo
- Expected delta
- +$257/yr (+$21/mo · 16.4%)
ⓘ Screening estimate from a state-policy table — verify with the county assessor before closing.
Climate risk First Street
- Flood 3/10 Moderate FEMA zone X (unshaded) · 20% chance over 30 yrs
- Wildfire 3/10 Moderate
- Heat 9/10 Extreme 6 d/yr ≥106°F today · 19 d/yr by 30 yrs out
- Wind 10/10 Extreme 99% chance of damaging wind over 30 yrs
- Air quality 1/10 Low 0 unhealthy d/yr today · 0 by 30 yrs out
Nearby sold comps map
Loading sold comps map…
Walkable amenities ~0.75 mi
Loading nearby amenities…
Taxation est. · year 1
- Rental income
- $25,621
- − Mortgage interest
- −$12,318
- − Property taxes
- −$1,568
- − Insurance
- −$1,100
- − Repairs & maintenance
- −$2,050
- − Management
- −$2,050
- − Depreciation
- −$6,397
- Taxable income
- $139
- Est. tax owed @ 24.0%
- −$33
- After-tax cash flow
- $3,702/yr
For passive investors: Depreciation is non-cash, so a rental often shows a tax loss while cash-flowing — sheltering income. Rental losses are passive: they offset passive income freely, and up to $25,000/yr can offset ordinary (W-2) income if you actively participate and your MAGI is under $100k (phasing out to $0 by $150k); unused losses carry forward. On sale, claimed depreciation is recaptured at up to 25%, and gains may owe capital-gains tax (a 1031 exchange can defer both). Figures are a year-1 estimate at your 24.0% rate — not tax advice; consult a CPA.
Schools (NCES district)
- District
- Brevard
- NCES district ID
- 1200150
- Math proficiency
- 53% ▼ -9.00%
- Reading proficiency
- 57% ▼ -4.00%
- Median HH income
- $49,426
- Composite
- 46.86/100
- National rank
- #2370
- State rank
- #19 of 73 in FL
Livability — Palm Bay
- Score
- 72/100
- State rank
- #366
- US rank
- #6458
Category grades
Schools grade is shown separately in the Schools card above.
Census & demographics
- Census place
- Palm Bay, FL
- County
- Brevard County · 602,871 people
- City population
- 132,211
- Metro
- Palm Bay-Melbourne-Titusville, FL
- Population (ZIP)
- 16,535
- Household income
- $79,596
- Rent vs Own
- Severe rent burden
- 112.0
Population outlook (Brevard County) Hauer SSP2
- Today (2025)
- 623,254 people
- By 2030
- 648,420 · +4.0%
- By 2040
- 690,009 · +10.7%
- By 2050
- 715,669 · +14.8%
- By 2075
- 775,744 · +24.5%
- By 2100
- 776,687 · +24.6%
Race, ethnicity, and origin ACS 2023
- Neighborhood character
- Diverse neighborhood (Simpson 0.69)
- Race & ethnicity
- White 48% Hispanic / Latino 20% Black 20% Two or more races 19%
- Hispanic origin (detail)
- Mexican 1% Puerto Rican 8% Cuban 6% Dominican 3%
- Common ancestry
- Hispanic 3% Estonian 2% Romanian 1%
- Foreign-born
- 10% · Canada, Jamaica, South Korea
- Languages at home
- 87% English-only · Spanish 9% Other Indo-European 1% French/Haitian/Cajun 1%
Political lean MEDSL · Brevard
- 2024 margin
- Strong R (+20.8) · D 39.1% · R 59.9% · Other 1.0%
- 2008→2024 swing
- -10.4pp toward R · 2008: -10.4pp · 2024: -20.8pp
- All cycles
- 2024: R+20.8 2020: R+16.4 2016: R+19.8 2012: R+12.7 2008: R+10.4
Not yet ingested
- Civics
- —
Market trends
- HPI YoY
- ▼ -38.22%
- Current HPI
- 330.0399
- Rent YoY
- ▲ 1.29%
- Metro
- Palm Bay-Melbourne-Titusville, FL
- State GDP YoY
- ▲ 3.28%
- F500 in state
- 36
Industry mix (Fortune 500 HQ in FL)
| Industry | F500 HQs | Revenue |
|---|---|---|
| Industrial Technology | 2 | $29B |
|
||
| Insurance | 2 | $17B |
|
||
| Retail | 1 | $60B |
|
||
| Technology Distribution | 1 | $58B |
|
||
| Homebuilding | 1 | $35B |
|
||
| Technology Manufacturing | 1 | $35B |
|
||
Price history
+10.0% since first listed13 events — show timeline
- 2026-03-10 Pending — Stellar MLS as Distributed by MLS Grid
- 2026-03-01 Listing Removed — Stellar MLS as Distributed by MLS Grid
- 2026-02-17 Price Changed $219,900 Stellar MLS as Distributed by MLS Grid
- 2026-02-03 Price Changed $229,000 Stellar MLS as Distributed by MLS Grid
- 2026-01-29 Price Changed $245,000 Stellar MLS as Distributed by MLS Grid
- 2026-01-19 Price Changed $250,000 Stellar MLS as Distributed by MLS Grid
- 2026-01-06 Price Changed $259,000 Stellar MLS as Distributed by MLS Grid
- 2025-12-16 Listed $270,000 Stellar MLS as Distributed by MLS Grid
- 2016-08-16 Listing Removed — SCMLS
- 2009-03-20 Sold (Public Records) $57,000 Public Records
- 2009-02-20 Sold (MLS) $57,000 SCMLS
- 2008-11-24 Listed $57,000 SCMLS
- 2007-10-22 Listed $199,900 SCMLS
Property tax history
+1.8%/yrLatest (2025): $1,568 · +3.0% YoY. Source: county tax records.
Cash-flow waterfall
monthlySold comps — $/sqft
last 12 mo · ≤1 miLoading sold comps…