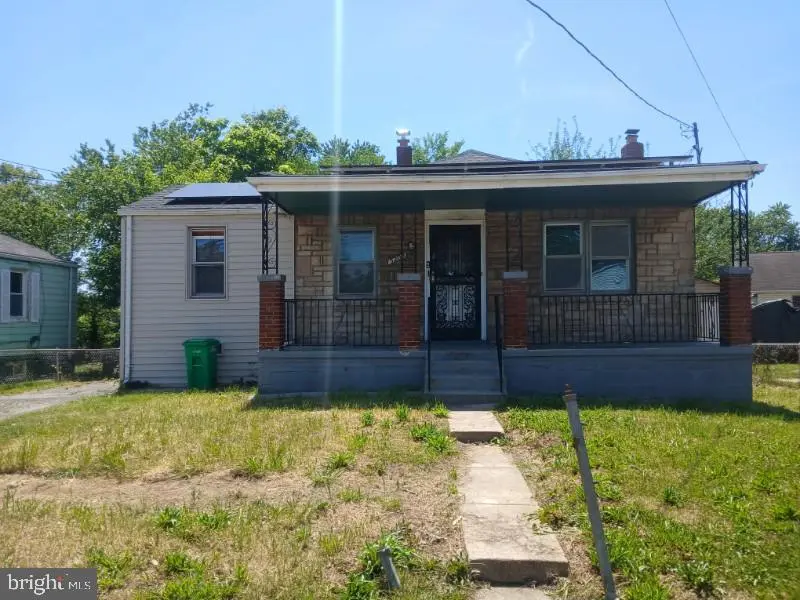
5203 Addison Rd · Fairmount Heights, MD
Flood risk 1/10 · Minimal
- FEMA flood zone
- X (unshaded)
- Chance of flooding over 30 yrs
- 0.0%
- Est. flood insurance / yr
- $473 – $860
Fire risk 1/10 · Minimal
- Est. fire insurance / yr
- $755 – $1,403
Heat risk 8/10 · Major
- Hot days now (above 104°F)
- 7 days/yr
- Hot days in 30 yrs
- 15 days/yr
Wind risk 5/10 · Moderate
- Chance of severe wind over 30 yrs
- 22.0%
Air-quality risk 4/10 · Minor
- Unhealthy air days now
- 4 days/yr
- Unhealthy air days in 30 yrs
- 5 days/yr
Risk factors via First Street. Map © Google.
Why this score? — see what drove the C+ grade
The composite is a weighted blend of 9 inputs, each scored 0–100. Each bar is that input's sub-score; the figure is the points it added to the 100-point composite (weight × sub-score).
- Cash flow +22.9/30.0
- ARV discount +15.0/15.0
- DSCR +7.4/10.0
- 1% rule +6.7/10.0
- Rent growth +4.0/5.0
- Livability +3.5/5.0
- Condition / age +2.5/5.0
- Schools +1.7/10.0
- Appreciation +0.0/10.0
$199,900
🖨 Deal sheet 📄 Offer letter ✓ Due diligence
Listing remarks MLS
the property is back on the market.
Key facts
- Private driveway
- Large kitchen
- Full basement
Tags
Property features AI
Finance
- Other: Ownership is fee simple; Above-grade finished area reported as 840 (assessor); Below-grade unfinished area reported as 700 (assessor); Total below-grade area reported as 700
Exterior
- Parking: Driveway parking for 2 vehicles (total 2 garage/parking spaces)
- Utilities: Public water; Public sewer
- Home design: Detached structure; Frame construction
- Construction: Permanent foundation; Above-grade and below-grade structures
- Exterior features: No tidal water
Interior
- Bedrooms: Two bedrooms on the main level; One bedroom on the lower level
- Bathrooms: One full bathroom on the main level; One full bathroom on the lower level (total 2 full bathrooms)
- Heating & cooling: Other heating; Other cooling; Other hot water
- Interior features: Full, fully finished basement
Neighborhood map
What this means for you Summary
Snapshot
- This is a 3-bed/2.0-bath single-family listed at $200k.
Deal economics
- At list price, monthly cash flow is $352 ($4k/yr) — positive.
- The deal already cash-flows at list — no discount required.
- Meets the 1% rule at list price ($2k rent vs $200k).
- Cap rate 8.4% vs local median 5.0% in Fairmount Heights — top-decile yield for the area; either an underpriced asset or a hidden risk that comps aren't pricing in. Stress-test before assuming the spread holds.
Location & tenants
- Location reads 69/100 on livability (#195 in MD) — a middle-class / working-renter tenant base. Strengths: commute A+, housing A+, employment A-; Watch: crime F, amenities F, cost of living F.
- Prince George'S County Public Schools (suburban): math 8% / reading 24% proficiency, ranked #21 of 24 in MD (top 88%) — low school quality limits family demand, transient renter base, plan for 1-2y turnover.
- Market conditions: Rents rising fast (+5.9%/yr); 217 active listings in the ZIP; 40 comparable units currently listed for rent nearby; rentals at typical pace (median 24d on market — plan ~3-4 weeks tenant-placement turnaround); solid renter incomes; 1,481 units permitted in Prince George's County in 2024 (0 in 5+ unit buildings).
- This rent runs 37% of the median local income ($76k/yr) — at the standard rent-burdened threshold; future hikes will face affordability resistance.
Forward outlook
- Local home prices are declining (-3.0%/yr); year-one equity from $1k of loan paydown is wiped out by about $6k of value loss. Plan a longer hold.
- Prince George's County population projected at +18% by 2050 — long-run rental-demand tailwind backs the buy-and-hold thesis.
- At projected returns (-3.0% appreciation + 5.9% rent growth), your $56k cash investment doubles in ~9 years — after that, you're playing with house money.
Negotiation context
- Only 7 days on market — expect competitive offers; lowballing is unlikely to land.
- 6 sale attempts since 13y ago with the ask held roughly flat each time — persistent listings suggest the price (not the market) is what's stuck; bring a comps-based counter.
Risks & watch-outs
- Watch-outs: built in 1944 — expect roof / HVAC / electrical / plumbing capex.
- Climate carrying-cost: moderate wind risk, 22% chance of damaging wind over 30y; extreme-heat days projected 7→15/yr by 2055 (HVAC capex compounding) — expect insurance premiums to compound above CPI over the hold.
Questions for the listing agent
- Built in 1944 — when were the roof, HVAC, electrical panel, plumbing, and water heater last replaced?
- Is there a deadline driving the sale (1031 exchange, divorce, estate, relocation)? That informs how much negotiation room exists.
- Schools are B-rated — typically a magnet for longer-tenancy family renters. What's the average tenant stay here, and is there a school-zone premium baked into asking?
- Crime grade is F in this area — have there been break-ins, vandalism, or insurance claims at this property in the last 3 years? What carrier currently insures it and at what premium?
- What's the average days-on-market for RENTAL listings here right now (not sales)? A rising rental-DOM trend means longer vacancies and softer asking-rent achievability than the comps imply.
- What's the recent tenant-quality profile in this submarket — average credit score on applications, eviction rate, late-payment / NSF rate, and stable-employment percentage? A property-management company in the area should have these aggregated.
- How much new for-sale + rental construction is in the pipeline within 1–3 miles? Heavy new supply typically softens prices + rents 12–24 months out; constrained supply supports both.
Investment metrics
- 1% rule
- 1.17% ✓
- Cap rate
- 8.40%
- Cash-on-cash
- 7.54%
- DSCR
- 1.34
- GRM
- 7.1
CMA / ARV
- ARV (on-the-fly)
- $342,720
- Comps found
- 12
Show comp detail 12 sales within ~0.75 mi
| Address | Dist | Beds/Ba | Sqft | Sold | Price | $/sf | Match |
|---|---|---|---|---|---|---|---|
| 1300 Nye St | 0.07mi | 4/2.0 (+1) | 880 (+5%) | 1mo | $405,000 | $460 | 83 |
| 1403 Farmingdale Ave | 0.27mi | 3/2.0 | 860 (+2%) | 8mo | $200,000 | $233 | 77 |
| 1315 Chapelwood Ln | 0.11mi | 4/2.0 (+1) | 900 (+7%) | 5mo | $367,500 | $408 | 74 |
| 1113 Booth Ln | 0.32mi | 3/2.0 | 816 (-3%) | 9mo | $360,000 | $441 | 73 |
| 1305 Oates St | 0.17mi | 4/2.0 (+1) | 860 (+2%) | 13mo | $382,000 | $444 | 72 |
| 5901 L St | 0.31mi | 2/1.0 (-1) | 792 (-6%) | 1mo | $210,000 | $265 | 66 |
| 5704 L | 0.21mi | 3/2.0 | 936 (+11%) | 6mo | $342,500 | $366 | 66 |
| 5505 Jefferson Heights Dr | 0.60mi | 3/1.0 | 798 (-5%) | 3mo | $145,000 | $182 | 57 |
| 5817 Sheriff Rd | 0.64mi | 4/2.0 (+1) | 864 (+3%) | 9mo | $420,000 | $486 | 53 |
| 1303 Eastern Ave | 0.52mi | 3/2.0 | 930 (+11%) | 13mo | $400,000 | $430 | 47 |
| 1007 Balsamtree Dr | 0.45mi | 2/1.5 (-1) | 714 (-15%) | 5mo | $175,000 | $245 | 43 |
| 709 62nd Ave | 0.66mi | 2/1.0 (-1) | 748 (-11%) | 5mo | $255,000 | $341 | 38 |
Match score weights: distance 35% · size 25% · config 20% · recency 20%. Top-matched comps best support the ARV.
Projected returns pro-forma
-3.0% appreciation · 5.9% rent growth · sell at horizon
- IRR
- -1.3%
- Equity multiple
- 0.95×
- Total profit
- $-2,903
- Equity at exit
- $29,806
- IRR
- 11.4%
- Equity multiple
- 2.02×
- Total profit
- $57,186
- Equity at exit
- $17,284
Cash invested: $55,972 (down + closing). Projections, not guarantees.
Landlord ↔ Tenant lean methodology
- Overall (STATE)
- 27 Tenant-Leaning
- State Maryland
- 27 Tenant-Leaning · D+14
- County
- — inherits STATE
- City
- — inherits STATE
ZIP-level market 20743
- Rents YoY
- 5.9%
- Active inventory
- 217
- Price-to-rent
- 7.1×
Monthly cashflow live
- Estimated rent
- $2,330 high interval (Pro) →
- Mortgage (P&I)
- −$1,048
- Tax from tax record
- −$358 /mo · $4,290/yr
- Insurance
- −$83
- HOA
- −$0
- Vacancy / Maint / Mgmt
- −$489
- Net cashflow
- $352
Break-even live
UW: 25.0% down · 7.5% · 30yr · 1.5% tax · 5.0% vac · 8.0% maint · 8.0% mgmt
Financing live
Cash to close
- Down payment
- $49,975
- Closing costs
- $5,997
- Reserves months
- —
- Total cash needed
- —
Loan-product check · same deal, 3 products live
Conventional
25% down · 7.5% · 30yr
- Down + closing
- —
- Monthly P&I
- —
- Monthly cashflow
- —
- DSCR
- —
- Eligible?
- —
Personal DTI + credit; lowest rate.
DSCR
20% down · 8.5% · 30yr
- Down + closing
- —
- Monthly P&I
- —
- Monthly cashflow
- —
- DSCR
- —
- Eligible?
- —
No personal income docs; deal must DSCR.
Hard money
10% down · 12.0% · 12mo
- Down + closing
- —
- Monthly P&I
- —
- Monthly cashflow
- —
- DSCR
- —
- Eligible?
- —
Short-term bridge; refi at stabilization.
Rent comps 40 comps
| Address | Beds | Baths | Sqft | Rent | $/sqft | DOM | Units | Dist |
|---|---|---|---|---|---|---|---|---|
| 805 Eastern Ave Fairmount Heights, MD | 4.0 | 2.0 | 936 | $2,400 | $2.56 | 5d | 1 | 0.40mi |
| 945 52nd St NE Washington, DC | 2.0–3.0 | 1.0 | 612 | $2,270 | $3.71 | 24d | 4 | 0.40mi |
| 5338 Jay St NE Washington, DC | 3.0 | 1.5 | 1000 | $2,795 | $2.79 | 24d | 1 | 0.41mi |
| 927 52nd St NE Unit 4 Washington, DC | 2.0 | 1.0 | 700 | $1,500 | $2.14 | 24d | 1 | 0.41mi |
| 5213 Just St NE Washington, DC | 3.0 | 2.0 | 1114 | $2,400 | $2.15 | 24d | 1 | 0.42mi |
| 4800 Addison Rd Capitol Heights, MD | 1.0–3.0 | 1.0–3.0 | 998 | $2,737 | $2.74 | 2d | 40 | 0.47mi |
| 716 55th St NE Unit 1 Washington, DC | 2.0 | 2.0 | 1100 | $2,200 | $2.00 | 20d | 1 | 0.53mi |
| 818 Balsamtree Pl Capitol Heights, MD | 4.0 | 1.5 | 1102 | $2,275 | $2.06 | 5d | 1 | 0.54mi |
| 5811 Field Pl NE Unit 304 Washington, DC | 3.0 | 1.0 | 779 | $2,922 | $3.75 | 24d | 1 | 0.57mi |
| 622 Eastern Ave NE #301 Washington, DC | 2.0 | 1.0 | 755 | $1,900 | $2.52 | 24d | 1 | 0.58mi |
| 4936 Nash St NE Unit 9 Washington, DC | 3.0 | 1.0 | 800 | $2,175 | $2.72 | 7d | 1 | 0.65mi |
| 4925 Just St NE Washington, DC | 2.0 | 2.0 | 864 | $2,299 | $2.66 | 24d | 1 | 0.71mi |
| 5000 Hunt St NE Washington, DC | 2.0 | 1.0 | 629 | $1,325 | $2.11 | 24d | 20 | 0.72mi |
| 4934 Just St NE Washington, DC | 2.0 | 1.0 | 966 | $2,200 | $2.28 | 24d | 1 | 0.76mi |
| 832 49th St NE Unit 1 Washington, DC | 3.0 | 1.0 | 1100 | $2,350 | $2.14 | 7d | 1 | 0.83mi |
| 832 49th St NE Washington, DC | 3.0 | 1.0 | 1100 | $2,425 | $2.20 | 16d | 1 | 0.83mi |
| 832 49th St NE Unit 1 Washington, DC | 3.0 | 1.0 | 1100 | $2,425 | $2.20 | 24d | 1 | 0.83mi |
| 405 Division Ave NE Unit 201 Washington, DC | 2.0 | 1.0 | 656 | $1,197 | $1.82 | 17d | 1 | 0.86mi |
| 324 61st St NE Unit 4 Washington, DC | 3.0 | 1.5 | 850 | $2,800 | $3.29 | 24d | 1 | 0.86mi |
| 5225 Dix St NE Washington, DC | 2.0 | 1.0 | 800 | $1,500 | $1.88 | 22d | 1 | 0.86mi |
| 599 50th St NE Washington, DC | 1.0–2.0 | 1.0–2.0 | 775 | $2,081 | $2.69 | 24d | 1 | 0.88mi |
| 323 62nd St NE Washington, DC | 1.0–3.0 | 1.0–2.0 | 908 | $2,435 | $2.68 | 24d | 1 | 0.90mi |
| 4629 Meade St NE Washington, DC | 3.0 | 1.5 | 960 | $2,300 | $2.40 | 24d | 1 | 0.91mi |
| 907 47th Pl NE Unit 1 Washington, DC | 2.0 | 1.0 | 950 | $1,575 | $1.66 | 15d | 1 | 0.93mi |
| 903 Glen Willow Dr Capitol Heights, MD | 2.0–3.0 | 1.0 | 885 | $2,115 | $2.39 | 2d | 4 | 0.95mi |
| 556 49th Pl NE Washington, DC | 3.0 | 3.0 | 894 | $3,475 | $3.89 | 24d | 1 | 0.99mi |
| 4930 Eads Pl NE Washington, DC | 3.0 | 1.5 | 1054 | $2,400 | $2.28 | 24d | 1 | 1.01mi |
| 4651 Nannie Helen Burroughs Ave NE Washington, DC | 1.0–2.0 | 1.0 | 663 | $1,749 | $2.64 | 5d | 3 | 1.01mi |
| 505 69th St Capitol Heights, MD | 3.0 | 2.0 | 1000 | $2,500 | $2.50 | 18d | 1 | 1.09mi |
| 4336 Polk St NE Washington, DC | 2.0 | 1.5 | 864 | $3,400 | $3.94 | 24d | 1 | 1.26mi |
| 4241 Foote St NE Apt 301 Washington, DC | 3.0 | 1.0 | 909 | $2,925 | $3.22 | 4d | 1 | 1.37mi |
| 4241 Foote St NE Unit 102 Washington, DC | 2.0 | 1.0 | 811 | $2,200 | $2.71 | 4d | 1 | 1.37mi |
| 4255 Eads St NE Unit 3 Washington, DC | 2.0 | 1.0 | 610 | $1,750 | $2.87 | 22d | 1 | 1.38mi |
| 22 Chamber Ave Capitol Heights, MD | 3.0 | 1.0 | 942 | $3,000 | $3.18 | 43d | 1 | 1.38mi |
| 4932 A St SE #302 Washington, DC | 2.0 | 2.0 | 1007 | $2,495 | $2.48 | 4d | 1 | 1.39mi |
| 5124 Astor Pl SE Washington, DC | 2.0 | 1.0 | 700 | $1,100 | $1.57 | 24d | 1 | 1.39mi |
| 44 49th St SE Unit A1 Washington, DC | 3.0 | 1.0 | 793 | $2,499 | $3.15 | 24d | 1 | 1.41mi |
| 4930 A St SE Unit 203 Washington, DC | 3.0 | 1.0 | 750 | $2,815 | $3.75 | 24d | 1 | 1.41mi |
| 4601 Blaine St NE Unit 1 Washington, DC | 2.0 | 1.0 | 750 | $1,500 | $2.00 | 24d | 1 | 1.41mi |
| 4919 A St SE Unit 202 Washington, DC | 2.0 | 1.0 | 625 | $1,900 | $3.04 | 24d | 1 | 1.43mi |
Listing history 6 events
-
2026-06-18days on market $199,900 Active 7 DOM
-
2026-06-17days on market $199,900 Active 6 DOM
-
2026-06-16days on market $199,900 Active 5 DOM
-
2026-06-15days on market $199,900 Active 4 DOM
-
2026-06-13remarks 699-char remark
-
2026-06-13$199,900 Active 2 DOM
ⓘ Source: listings_history table (triggers on properties + properties_extension) + one-shot
backfill from property_details.listing_events for pre-trigger history.
Tax reassessment forecast MD · Partial reset (capped growth)
- Current annual tax
- $4,290 · $358/mo
- Projected year-2 tax
- $4,290 · $358/mo
- Expected delta
- $0/yr ($0/mo · 0.0%)
ⓘ Screening estimate from a state-policy table — verify with the county assessor before closing.
Climate risk First Street
- Flood 1/10 Low FEMA zone X (unshaded) · 0% chance over 30 yrs
- Wildfire 1/10 Low
- Heat 8/10 Severe 7 d/yr ≥104°F today · 15 d/yr by 30 yrs out
- Wind 5/10 Major 22% chance of damaging wind over 30 yrs
- Air quality 4/10 Moderate 4 unhealthy d/yr today · 5 by 30 yrs out
Nearby sold comps map
Loading sold comps map…
Walkable amenities ~0.75 mi
Loading nearby amenities…
Taxation est. · year 1
- Rental income
- $27,960
- − Mortgage interest
- −$11,198
- − Property taxes
- −$4,290
- − Insurance
- −$1,000
- − Repairs & maintenance
- −$2,237
- − Management
- −$2,237
- − Depreciation
- −$5,815
- Taxable income
- $1,184
- Est. tax owed @ 24.0%
- −$284
- After-tax cash flow
- $3,935/yr
For passive investors: Depreciation is non-cash, so a rental often shows a tax loss while cash-flowing — sheltering income. Rental losses are passive: they offset passive income freely, and up to $25,000/yr can offset ordinary (W-2) income if you actively participate and your MAGI is under $100k (phasing out to $0 by $150k); unused losses carry forward. On sale, claimed depreciation is recaptured at up to 25%, and gains may owe capital-gains tax (a 1031 exchange can defer both). Figures are a year-1 estimate at your 24.0% rate — not tax advice; consult a CPA.
Schools (NCES district)
- District
- Prince George'S County Public Schools
- NCES district ID
- 2400510
- Math proficiency
- 8% ▼ -11.00%
- Reading proficiency
- 24% ▼ -9.00%
- Median HH income
- $73,967
- Composite
- 16.82/100
- National rank
- #9151
- State rank
- #21 of 24 in MD
Livability — Fairmount Heights
- Score
- 69/100
- State rank
- #195
- US rank
- #8961
Category grades
Schools grade is shown separately in the Schools card above.
Census & demographics
- County
- Prince Georges County · 919,866 people
- Metro
- Washington-Arlington-Alexandria, DC-VA-MD-WV
- Population (ZIP)
- 41,093
- Household income
- $76,466
- Rent vs Own
- Severe rent burden
- 1418.0
Population outlook (Prince George's County) Hauer SSP2
- Today (2025)
- 1,005,426 people
- By 2030
- 1,048,416 · +4.3%
- By 2040
- 1,123,425 · +11.7%
- By 2050
- 1,183,220 · +17.7%
- By 2075
- 1,306,202 · +29.9%
- By 2100
- 1,408,179 · +40.1%
Race, ethnicity, and origin ACS 2023
- Neighborhood character
- Predominantly Black (78%)
- Race & ethnicity
- Black 78% Hispanic / Latino 16% Two or more races 4% White 3% Asian 1%
- Hispanic origin (detail)
- Mexican 2% Puerto Rican 2%
- Foreign-born
- 16% · Canada
- Languages at home
- 81% English-only · Spanish 13% French/Haitian/Cajun 1%
Political lean MEDSL · Prince George's
- 2024 margin
- Solid D (+75.2) · D 86.3% · R 11.2% · Other 2.5%
- 2008→2024 swing
- -3.3pp toward R · 2008: 78.5pp · 2024: 75.2pp
- All cycles
- 2024: D+75.2 2020: D+80.5 2016: D+81.0 2012: D+80.9 2008: D+78.5
Not yet ingested
- Civics
- —
Market trends
- HPI YoY
- ▼ -311.97%
- Current HPI
- 335.5152
- Rent YoY
- ▲ 5.90%
- Metro
- Washington-Arlington-Alexandria, DC-VA-MD-WV
- State GDP YoY
- ▲ 2.97%
- F500 in state
- 12
Industry mix (Fortune 500 HQ in MD)
| Industry | F500 HQs | Revenue |
|---|---|---|
| Aerospace / Defense | 1 | $71B |
|
||
| Utilities | 1 | $25B |
|
||
| Hotels | 1 | $24B |
|
||
| Consumer Goods | 1 | $7B |
|
||
| Real Estate | 1 | $6B |
|
||
| Chemicals | 1 | $2B |
|
||
Price history
+166.5% since first listed18 events — show timeline
- 2026-06-11 Listed $199,900 BRIGHT MLS
- 2024-07-10 Listing Removed — BRIGHT MLS
- 2024-06-29 Listed $220,000 BRIGHT MLS
- 2018-04-23 Sold (Public Records) $210,000 Public Records
- 2018-03-16 Sold (MLS) $210,000 BRIGHT MLS
- 2018-03-16 Sold (MLS) $210,000 MRIS
- 2018-02-03 Listing Removed — BRIGHT MLS
- 2018-02-02 Delisted — MRIS
- 2018-01-29 Listed $210,000 BRIGHT MLS
- 2018-01-29 Listed $210,000 MRIS
- 2013-06-28 Sold (Public Records) $79,000 Public Records
- 2013-06-28 Sold (Public Records) $65,500 Public Records
- 2013-06-21 Sold (MLS) $65,500 MRIS
- 2013-06-21 Sold (MLS) $65,500 BRIGHT MLS
- 2013-06-11 Pending — MRIS
- 2013-06-11 Listing Removed — BRIGHT MLS
- 2013-06-01 Listed $75,000 MRIS
- 2013-05-31 Listed $75,000 BRIGHT MLS
Property tax history
+8.7%/yrLatest (2025): $4,290 · +7.9% YoY. Source: county tax records.
Cash-flow waterfall
monthlySold comps — $/sqft
last 12 mo · ≤1 miLoading sold comps…