 6-Plex
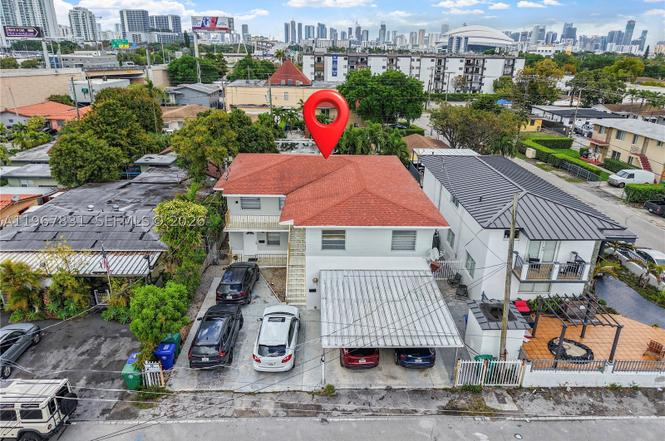
911 NW 22nd Pl · Miami, FL
Flood risk 3/10 · Minor
- FEMA flood zone
- X (unshaded)
- Chance of flooding over 30 yrs
- 0.12%
- Est. flood insurance / yr
- $507 – $1,088
Fire risk 1/10 · Minimal
- Est. fire insurance / yr
- $947 – $1,759
Heat risk 10/10 · Severe
- Hot days now (above 104°F)
- 7 days/yr
- Hot days in 30 yrs
- 29 days/yr
Wind risk 10/10 · Severe
- Chance of severe wind over 30 yrs
- 99.0%
Air-quality risk 2/10 · Minimal
- Unhealthy air days now
- 1 days/yr
- Unhealthy air days in 30 yrs
- 1 days/yr
Risk factors via First Street. Map © Google.
Why this score? — see what drove the B grade
The composite is a weighted blend of 9 inputs, each scored 0–100. Each bar is that input's sub-score; the figure is the points it added to the 100-point composite (weight × sub-score).
- Cash flow +30.0/30.0
- 1% rule +10.0/10.0
- DSCR +10.0/10.0
- ARV discount +7.5/15.0
- Schools +4.2/10.0
- Livability +3.9/5.0
- Condition / age +2.5/5.0
- Rent growth +2.2/5.0
- Appreciation +0.0/10.0
$975,000
🖨 Deal sheet 📄 Offer letter ✓ Due diligence
Multi-family units
County records classify this as Multi-Family (2-4 Unit). Listing-text estimate: 6 units. estimate disagrees with records
Listing remarks
Your next investment in the center of Miami is here! Minutes from The Miami International Airport, Freedom Park, Loan Depot Park, Brickell, Downtown, Magic City Casino and major highways. The roof was replaced in 2017 and the 2 A/C units with one mini-split are from 2015. The property boasts a 4 bedroom, 2 bathroom with a new kitchen and washer/dryer in unit. A 3 bedroom, 2 bathroom completely renovated with washer/dryer in unit. A 1 bedroom, 1 bathroom with a new bathroom. There are 5 parking spaces on the property. All tenants are month to month. SHOWINGS ARE SCHEDULED FOR SUNDAYS ONLY. Schedule your showing ASAP to tour this amazing investment opportunity.
Key facts
- New kitchen
- New bathroom
- Completely renovated
Tags
Property features AI
Finance
- Financial info: Multiple income-producing units with reported rents: one unit at $2,900, two units at $2,600, and one efficiency at $1,300; Units reported as month-to-month
Exterior
- Parking: Total of 5 parking spaces; Other/unspecified parking types
- Utilities: Public water; Public sewer; Cable service available
- Home design: Two-story building; Barrel roof; Block construction; Effective year built reported
- Construction: Block construction; Barrel roof
- Exterior features: Less than quarter-acre lot
Interior
- Kitchen: Kitchens with range, microwave, and refrigerator; Dishwasher (in some units)
- Bedrooms: Three 3-bedroom units and one 1-bedroom efficiency unit (total 4 bedrooms listed per Unit Type 1 and 2; one efficiency unit with 1 bedroom)
- Flooring: Terrazzo flooring; Tile flooring
- Bathrooms: Units include full bathrooms (units reported with 2 full baths and 1 full bath)
- Heating & cooling: Central heating; Central air conditioning; Individual air conditioning units noted for some units
- Interior features: Terrazzo and tile flooring
- Laundry & utility: Washer and dryer in some units; Electric meter present
Neighborhood map
What this means for you Summary
Snapshot
- This is a 6 × 3-bed/1.8-bath units multifamily listed at $975k.
Deal economics
- At list price, monthly cash flow is $12k ($146k/yr) — positive. Per door: $2k/mo.
- The deal already cash-flows at list — no discount required.
- Meets the 1% rule at list price ($23k rent vs $975k).
- Recommended offer: $887k (9.0% below list) — sets the bar for market timing.
- Cap rate 21.3% vs local median 1.9% in Miami — top-decile yield for the area; either an underpriced asset or a hidden risk that comps aren't pricing in. Stress-test before assuming the spread holds.
Location & tenants
- Location reads 78/100 on livability (#177 in FL, #2,724 nationally) — a middle-class / working-renter tenant base. Strengths: amenities A+, commute A+, health & safety A+; Watch: employment C-, crime F, cost of living F.
- Miami-Dade (suburban): math 45% / reading 54% proficiency, ranked #40 of 73 in FL (top 55%) — families likely to look elsewhere, expect single-tenant / working-renter base with shorter leases; 64% free/reduced lunch — lower-income household profile, screen leases tightly.
- Market conditions: Rents soft (-1.4%/yr); 239 active listings in the ZIP; 1 comparable units currently listed for rent nearby; lower-income renter base — watch delinquency; 10,051 units permitted in Miami-Dade County in 2024 (7,758 in 5+ unit buildings).
- At $23,444/mo this rent would consume 625% of the median local household income ($45k/yr) (locally 5223% of renters already pay >50% of income on rent) — very limited rent-growth headroom before tenants either downsize or default.
Forward outlook
- Local home prices are declining (-3.0%/yr); year-one equity from $7k of loan paydown is wiped out by about $29k of value loss. Plan a longer hold.
- Miami-Dade County population projected at +28% by 2050 — long-run rental-demand tailwind backs the buy-and-hold thesis.
- At projected returns (-3.0% appreciation + 0.0% rent growth), your $273k cash investment doubles in ~3 years — after that, you're playing with house money.
Negotiation context
- It's been on market 98 days — a 9% lower offer ($887k) is reasonable based on typical stale-listing flexibility.
- 2 sale attempts with the ask held roughly flat each time — persistent listings suggest the price (not the market) is what's stuck; bring a comps-based counter.
Risks & watch-outs
- Climate carrying-cost: severe wind risk, 99% chance of damaging wind over 30y; extreme-heat days projected 7→29/yr by 2055 (HVAC capex compounding) — expect insurance premiums to compound above CPI over the hold.
Questions for the listing agent
- It's been on market 98 days. Have you received any prior offers? Is the seller open to a 9% concession, seller financing, or rate buy-down credit?
- Can we see the unit-by-unit rent roll, current vacancy, and any below-market leases? What's the average tenancy length?
- What capital expenditures (roof, boiler, parking lot, exteriors) have been made in the last 5 years, and what's planned in the next 2?
- Built in 1970 — when were the roof, HVAC, electrical panel, plumbing, and water heater last replaced?
- Why hasn't it sold? Are there any deal-killer items the seller is aware of (foundation, flood, title, zoning, code violations)?
- Is there a deadline driving the sale (1031 exchange, divorce, estate, relocation)? That informs how much negotiation room exists.
- Schools are B-rated — typically a magnet for longer-tenancy family renters. What's the average tenant stay here, and is there a school-zone premium baked into asking?
- Crime grade is F in this area — have there been break-ins, vandalism, or insurance claims at this property in the last 3 years? What carrier currently insures it and at what premium?
- What's the average days-on-market for RENTAL listings here right now (not sales)? A rising rental-DOM trend means longer vacancies and softer asking-rent achievability than the comps imply.
- What's the recent tenant-quality profile in this submarket — average credit score on applications, eviction rate, late-payment / NSF rate, and stable-employment percentage? A property-management company in the area should have these aggregated.
- How much new apartment / multifamily construction is in the pipeline within 1–3 miles? Heavy new supply (>2% of stock underway) typically softens rents 12–24 months out; light construction supports rent growth.
Investment metrics
- 1% rule
- 2.40% ✓
- Cap rate
- 21.28%
- Cash-on-cash
- 53.52%
- DSCR
- 3.38
- GRM
- 3.5
CMA / ARV
No comps found within radius.
Projected returns pro-forma
-3.0% appreciation · 0.0% rent growth · sell at horizon
- IRR
- 48.2%
- Equity multiple
- 3.01×
- Total profit
- $548,875
- Equity at exit
- $145,376
- IRR
- 52.6%
- Equity multiple
- 5.44×
- Total profit
- $1,211,417
- Equity at exit
- $84,300
Cash invested: $273,000 (down + closing). Projections, not guarantees.
Landlord ↔ Tenant lean methodology
- Overall (STATE)
- 87 Strongly Landlord-Friendly
- State Florida
- 87 Strongly Landlord-Friendly · R+3
- County
- — inherits STATE
- City
- — inherits STATE
ZIP-level market 33125
- Rents YoY
- -1.4%
- Active inventory
- 239
- Price-to-rent
- 20.8×
Monthly cashflow live
- Estimated rent
- $23,444 medium interval (Pro) →
- Mortgage (P&I)
- −$5,113
- Tax from tax record
- −$826 /mo · $9,913/yr
- Insurance
- −$406
- HOA
- −$0
- Vacancy / Maint / Mgmt
- −$4,923
- Net cashflow
- $12,175
Break-even live
6-unit breakdown (identical units grouped — click to expand)
| Units | Beds | Baths | Est. rent |
|---|---|---|---|
| 6× units | 3 | 1.8 | $23,442 |
| #1 | 3 | 1.8 | $3,907 |
| #2 | 3 | 1.8 | $3,907 |
| #3 | 3 | 1.8 | $3,907 |
| #4 | 3 | 1.8 | $3,907 |
| #5 | 3 | 1.8 | $3,907 |
| #6 | 3 | 1.8 | $3,907 |
| Total (6 units) | $23,444 | ||
UW: 25.0% down · 7.5% · 30yr · 1.5% tax · 5.0% vac · 8.0% maint · 8.0% mgmt
Financing live
Cash to close
- Down payment
- $243,750
- Closing costs
- $29,250
- Reserves months
- —
- Total cash needed
- —
Loan-product check · same deal, 3 products live
Conventional
25% down · 7.5% · 30yr
- Down + closing
- —
- Monthly P&I
- —
- Monthly cashflow
- —
- DSCR
- —
- Eligible?
- —
Personal DTI + credit; lowest rate.
DSCR
20% down · 8.5% · 30yr
- Down + closing
- —
- Monthly P&I
- —
- Monthly cashflow
- —
- DSCR
- —
- Eligible?
- —
No personal income docs; deal must DSCR.
Hard money
10% down · 12.0% · 12mo
- Down + closing
- —
- Monthly P&I
- —
- Monthly cashflow
- —
- DSCR
- —
- Eligible?
- —
Short-term bridge; refi at stabilization.
Rent comps 1 comps
| Address | Beds | Baths | Sqft | Rent | $/sqft | DOM | Units | Dist |
|---|---|---|---|---|---|---|---|---|
| 2951 NW 13th St Unit 1399868P Miami, FL | 4.0–8.0 | 3.5–6.0 | 3745 | $14,816 | $3.96 | 7d | 2 | 0.74mi |
Listing history 4 events
-
2026-05-05historical Active Under Contract
-
2026-04-15status Active
-
2026-04-15historical Active Under Contract
-
2026-02-19$975,000 Active
ⓘ Source: listings_history table (triggers on properties + properties_extension) + one-shot
backfill from property_details.listing_events for pre-trigger history.
Tax reassessment forecast FL · Resets to sale price
- Current annual tax
- $9,913 · $826/mo
- Projected year-2 tax
- $9,913 · $826/mo
- Expected delta
- $0/yr ($0/mo · 0.0%)
ⓘ Screening estimate from a state-policy table — verify with the county assessor before closing.
Climate risk First Street
- Flood 3/10 Moderate FEMA zone X (unshaded) · 12% chance over 30 yrs
- Wildfire 1/10 Low
- Heat 10/10 Extreme 7 d/yr ≥104°F today · 29 d/yr by 30 yrs out
- Wind 10/10 Extreme 99% chance of damaging wind over 30 yrs
- Air quality 2/10 Low 1 unhealthy d/yr today · 1 by 30 yrs out
Nearby sold comps map
Loading sold comps map…
Walkable amenities ~0.75 mi
Loading nearby amenities…
Taxation est. · year 1
- Rental income
- $281,328
- − Mortgage interest
- −$54,615
- − Property taxes
- −$9,913
- − Insurance
- −$4,875
- − Repairs & maintenance
- −$22,506
- − Management
- −$22,506
- − Depreciation
- −$28,364
- Taxable income
- $138,549
- Est. tax owed @ 24.0%
- −$33,252
- After-tax cash flow
- $112,853/yr
For passive investors: Depreciation is non-cash, so a rental often shows a tax loss while cash-flowing — sheltering income. Rental losses are passive: they offset passive income freely, and up to $25,000/yr can offset ordinary (W-2) income if you actively participate and your MAGI is under $100k (phasing out to $0 by $150k); unused losses carry forward. On sale, claimed depreciation is recaptured at up to 25%, and gains may owe capital-gains tax (a 1031 exchange can defer both). Figures are a year-1 estimate at your 24.0% rate — not tax advice; consult a CPA.
Schools (NCES district)
- District
- Miami-Dade
- NCES district ID
- 1200390
- Math proficiency
- 45% ▼ -16.00%
- Reading proficiency
- 54% ▼ -5.00%
- Median HH income
- $43,928
- Composite
- 41.76/100
- National rank
- #3397
- State rank
- #40 of 73 in FL
Livability — Miami
- Score
- 78/100
- State rank
- #177
- US rank
- #2724
Category grades
Schools grade is shown separately in the Schools card above.
Census & demographics
- Census place
- Miami, FL
- County
- Miami-Dade County · 2,697,751 people
- City population
- 827,308
- Metro
- Miami-Fort Lauderdale-Pompano Beach, FL
- Population (ZIP)
- 56,897
- Household income
- $44,979
- Rent vs Own
- Severe rent burden
- 5223.0
Population outlook (Miami-Dade County) Hauer SSP2
- Today (2025)
- 3,126,439 people
- By 2030
- 3,325,765 · +6.4%
- By 2040
- 3,697,561 · +18.3%
- By 2050
- 4,012,134 · +28.3%
- By 2075
- 4,605,612 · +47.3%
- By 2100
- 4,866,598 · +55.7%
Race, ethnicity, and origin ACS 2023
- Neighborhood character
- Predominantly Hispanic (92%)
- Race & ethnicity
- Hispanic / Latino 92% Two or more races 52% White 4% Black 4%
- Hispanic origin (detail)
- Mexican 2% Puerto Rican 3% Cuban 46% Dominican 3% Salvadoran 1%
- Common ancestry
- Hispanic 1%
- Foreign-born
- 68% · Canada, Jamaica, Dominican Republic
- Languages at home
- 9% English-only · Spanish 90%
Political lean MEDSL · Miami-Dade
- 2024 margin
- R (+11.4) · D 43.9% · R 55.4%
- 2008→2024 swing
- -27.6pp toward R · 2008: 16.1pp · 2024: -11.4pp
- All cycles
- 2024: R+11.4 2020: D+7.3 2016: D+29.6 2012: D+23.7 2008: D+16.1
Not yet ingested
- Civics
- —
Market trends
- HPI YoY
- ▼ -402.98%
- Current HPI
- 476.1631
- Rent YoY
- ▼ -1.39%
- Metro
- Miami-Fort Lauderdale-Pompano Beach, FL
- State GDP YoY
- ▲ 3.28%
- F500 in state
- 36
Industry mix (Fortune 500 HQ in FL)
| Industry | F500 HQs | Revenue |
|---|---|---|
| Industrial Technology | 2 | $29B |
|
||
| Insurance | 2 | $17B |
|
||
| Retail | 1 | $60B |
|
||
| Technology Distribution | 1 | $58B |
|
||
| Homebuilding | 1 | $35B |
|
||
| Technology Manufacturing | 1 | $35B |
|
||
Price history
4 events — show timeline
- 2026-05-05 Contingent — MARMLS
- 2026-04-15 Relisted — MARMLS
- 2026-04-15 Contingent — MARMLS
- 2026-02-19 Listed $975,000 MARMLS
Property tax history
+8.1%/yrLatest (2025): $9,913 · +1.6% YoY. Source: county tax records.
Cash-flow waterfall
monthlySold comps — $/sqft
last 12 mo · ≤1 miLoading sold comps…