 🏷️ Likely Rental
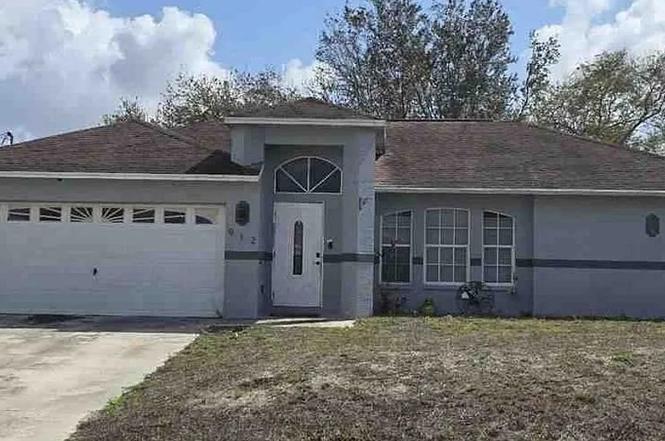
912 Apple Ave · Lehigh Acres, FL
Flood risk 1/10 · Minimal
- FEMA flood zone
- X (unshaded)
- Chance of flooding over 30 yrs
- 0.0%
- Est. flood insurance / yr
- $507 – $1,088
Fire risk 4/10 · Minor
- Est. fire insurance / yr
- $947 – $1,759
Heat risk 10/10 · Severe
- Hot days now (above 107°F)
- 7 days/yr
- Hot days in 30 yrs
- 29 days/yr
Wind risk 10/10 · Severe
- Chance of severe wind over 30 yrs
- 99.0%
Air-quality risk 2/10 · Minimal
- Unhealthy air days now
- 1 days/yr
- Unhealthy air days in 30 yrs
- 1 days/yr
Risk factors via First Street. Map © Google.
Why this score? — see what drove the D grade
The composite is a weighted blend of 9 inputs, each scored 0–100. Each bar is that input's sub-score; the figure is the points it added to the 100-point composite (weight × sub-score).
- Cash flow +15.0/30.0
- ARV discount +7.5/15.0
- 1% rule +5.0/10.0
- DSCR +5.0/10.0
- Schools +4.1/10.0
- Livability +3.0/5.0
- Condition / age +2.5/5.0
- Rent growth +1.3/5.0
- Appreciation +0.0/10.0
$5,000
🖨 Deal sheet 📄 Offer letter ✓ Due diligence
Listing remarks MLS
HUGE PRICE DECREASE!!!! SELLERS WANT THIS PROPERTY SOLD!!! Incredible update just completed!! NEW INTERIOR PAINT, NEW GRANITE COUNTERS, NEW TUB /SHOWER SURFACES, NEW CARPET!!! Fabulous POOL home located in the FRONT of Lehigh Acres, CLOSE to Ft Myers! This is a MUST SEE property!!! NEW ROOF in 2018!! This gorgeous property is well maintained and features a lanai, pool and a pool path. Call now to schedule your private showing now.
Key facts
- 2 garage spots
- Listed 2 days
Property features AI
Finance
- Other: Directions: Veterans Blvd E, left on Alvin Ave, right on Barth St, left on Apple Ave; property is on the right
Exterior
- Parking: 2-car garage
- Home design: Residential property
- Exterior features: Quarter-acre lot; Zoned RS-1
Interior
- Bathrooms: 2 full bathrooms
- Interior features: Single-story layout
Neighborhood map
What this means for you Summary
Snapshot
- This is a 3-bed/2.0-bath single-family listed at $5k.
Deal economics
- At list price, monthly cash flow is $2k ($19k/yr) — positive.
- The deal already cash-flows at list — no discount required.
- Meets the 1% rule at list price ($2k rent vs $5k).
- Cap rate 386.9% vs local median 4.7% in Lehigh Acres — top-decile yield for the area; either an underpriced asset or a hidden risk that comps aren't pricing in. Stress-test before assuming the spread holds.
Location & tenants
- Location reads 59/100 on livability (#826 in FL) — a working-class tenant base; expect higher turnover. Strengths: cost of living A+, housing A+; Watch: crime C-, employment D+, schools D-.
- Lee (suburban): math 47% / reading 50% proficiency, ranked #42 of 73 in FL (top 58%) — families likely to look elsewhere, expect single-tenant / working-renter base with shorter leases.
- Market conditions: Rents falling (-4.7%/yr); 1335 active listings in the ZIP; 40 comparable units currently listed for rent nearby; rentals at typical pace (median 24d on market — plan ~3-4 weeks tenant-placement turnaround); solid renter incomes; 15,411 units permitted in Lee County in 2024 (4,686 in 5+ unit buildings).
- This rent runs 32% of the median local income ($78k/yr) — at the standard rent-burdened threshold; future hikes will face affordability resistance.
Forward outlook
- Local home prices are declining (-3.0%/yr); year-one equity from $35 of loan paydown is wiped out by about $150 of value loss. Plan a longer hold.
- Lee County population projected at +44% by 2050 — long-run rental-demand tailwind backs the buy-and-hold thesis.
- At projected returns (-3.0% appreciation + 0.0% rent growth), your $1k cash investment doubles in ~1 year — after that, you're playing with house money.
Negotiation context
- Only 2 days on market — expect competitive offers; lowballing is unlikely to land.
- 2 sale attempts since 8y ago with the ask held roughly flat each time — persistent listings suggest the price (not the market) is what's stuck; bring a comps-based counter.
Risks & watch-outs
- Climate carrying-cost: severe wind risk, 99% chance of damaging wind over 30y; extreme-heat days projected 7→29/yr by 2055 (HVAC capex compounding) — expect insurance premiums to compound above CPI over the hold.
Questions for the listing agent
- Is there a deadline driving the sale (1031 exchange, divorce, estate, relocation)? That informs how much negotiation room exists.
- Schools are D-rated, which usually means shorter tenancies and higher turnover. Who's the typical renter profile here, and what's been the actual vacancy rate?
- The area grade is low — what's the realistic commute time and amenity access for the typical tenant pool here? Any planned neighborhood developments (good or bad) we should know about?
- What's the average days-on-market for RENTAL listings here right now (not sales)? A rising rental-DOM trend means longer vacancies and softer asking-rent achievability than the comps imply.
- What's the recent tenant-quality profile in this submarket — average credit score on applications, eviction rate, late-payment / NSF rate, and stable-employment percentage? A property-management company in the area should have these aggregated.
- How much new for-sale + rental construction is in the pipeline within 1–3 miles? Heavy new supply typically softens prices + rents 12–24 months out; constrained supply supports both.
Investment metrics
- 1% rule
- 41.02% ✓
- Cap rate
- 386.91%
- Cash-on-cash
- 1359.34%
- DSCR
- 61.48
- GRM
- 0.2
CMA / ARV
- ARV (on-the-fly)
- $321,300
- Comps found
- 8
Show comp detail 8 sales within ~0.75 mi
| Address | Dist | Beds/Ba | Sqft | Sold | Price | $/sf | Match |
|---|---|---|---|---|---|---|---|
| 900 Alaska Ave | 0.11mi | 4/2.0 (+1) | 1,696 (+8%) | 1mo | $345,000 | $203 | 76 |
| 906 Angelo Ave | 0.44mi | 3/2.0 | 1,527 (-3%) | 9mo | $300,000 | $196 | 67 |
| 904 Agnes Ave | 0.32mi | 3/2.0 | 1,458 (-7%) | 10mo | $240,000 | $165 | 64 |
| 1024 Alaska Ave | 0.32mi | 4/2.0 (+1) | 1,696 (+8%) | 5mo | $346,000 | $204 | 62 |
| 5518 Brookfield St | 0.27mi | 3/2.0 | 1,357 (-14%) | 14mo | $310,000 | $228 | 52 |
| 5321 Bywood St | 0.31mi | 4/2.0 (+1) | 1,757 (+12%) | 23mo | $345,000 | $196 | 42 |
| 5548 Burr St | 0.43mi | 4/2.0 (+1) | 1,696 (+8%) | 24mo | $397,000 | $234 | 42 |
| 5542 Belrose St | 0.54mi | 3/3.0 | 1,700 (+8%) | 23mo | $395,000 | $232 | 38 |
Match score weights: distance 35% · size 25% · config 20% · recency 20%. Top-matched comps best support the ARV.
Projected returns pro-forma
-3.0% appreciation · 0.0% rent growth · sell at horizon
- IRR
- —
- Equity multiple
- 68.30×
- Total profit
- $94,216
- Equity at exit
- $746
- IRR
- —
- Equity multiple
- 136.00×
- Total profit
- $188,999
- Equity at exit
- $432
Cash invested: $1,400 (down + closing). Projections, not guarantees.
Landlord ↔ Tenant lean methodology
- Overall (STATE)
- 87 Strongly Landlord-Friendly
- State Florida
- 87 Strongly Landlord-Friendly · R+3
- County
- — inherits STATE
- City
- — inherits STATE
ZIP-level market 33971
- Home prices YoY
- -8.0%
- Rents YoY
- -4.7%
- Active inventory
- 1335
- Price-to-rent
- 0.2×
Monthly cashflow live
- Estimated rent
- $2,051 high interval (Pro) →
- Mortgage (P&I)
- −$26
- Tax est. 1.5%
- −$6 /mo · $75/yr
- Insurance
- −$2
- HOA
- −$0
- Vacancy / Maint / Mgmt
- −$431
- Net cashflow
- $1,586
Break-even live
UW: 25.0% down · 7.5% · 30yr · 1.5% tax · 5.0% vac · 8.0% maint · 8.0% mgmt
Financing live
Cash to close
- Down payment
- $1,250
- Closing costs
- $150
- Reserves months
- —
- Total cash needed
- —
Loan-product check · same deal, 3 products live
Conventional
25% down · 7.5% · 30yr
- Down + closing
- —
- Monthly P&I
- —
- Monthly cashflow
- —
- DSCR
- —
- Eligible?
- —
Personal DTI + credit; lowest rate.
DSCR
20% down · 8.5% · 30yr
- Down + closing
- —
- Monthly P&I
- —
- Monthly cashflow
- —
- DSCR
- —
- Eligible?
- —
No personal income docs; deal must DSCR.
Hard money
10% down · 12.0% · 12mo
- Down + closing
- —
- Monthly P&I
- —
- Monthly cashflow
- —
- DSCR
- —
- Eligible?
- —
Short-term bridge; refi at stabilization.
Rent comps 40 comps
| Address | Beds | Baths | Sqft | Rent | $/sqft | DOM | Units | Dist |
|---|---|---|---|---|---|---|---|---|
| 918 Acroft Ave Lehigh Acres, FL | 3.0 | 2.0 | 1428 | $1,850 | $1.30 | 24d | 1 | 0.09mi |
| 5504 Butte St Lehigh Acres, FL | 3.0 | 2.0 | 1172 | $1,800 | $1.54 | 16d | 1 | 0.23mi |
| 903 Albany Ave Lehigh Acres, FL | 3.0 | 2.0 | 1200 | $1,800 | $1.50 | 24d | 1 | 0.23mi |
| 5408 Berryman St Lehigh Acres, FL | 3.0 | 2.0 | 1271 | $2,035 | $1.60 | 3d | 1 | 0.31mi |
| 1043 Albert Ave Unit 1043 Lehigh Acres, FL | 3.0 | 3.0 | 1802 | $2,395 | $1.33 | 3d | 1 | 0.38mi |
| 1043 Albert Ave Lehigh Acres, FL | 3.0 | 3.0 | 1802 | $2,200 | $1.22 | 19d | 1 | 0.38mi |
| 1043 Abrams Blvd Lehigh Acres, FL | 2.0 | 2.0 | 1197 | $1,475 | $1.23 | 3d | 1 | 0.39mi |
| 809 Agnes Ave Lehigh Acres, FL | 3.0 | 2.0 | 1177 | $1,950 | $1.66 | 24d | 1 | 0.41mi |
| 5551 Benton St Lehigh Acres, FL | 3.0 | 2.0 | 1592 | $2,110 | $1.33 | 3d | 1 | 0.47mi |
| 5428 Bristo St Lehigh Acres, FL | 3.0 | 2.0 | 1500 | $1,600 | $1.07 | 2d | 1 | 0.48mi |
| 1019 Angelo Ave Lehigh Acres, FL | 3.0 | 2.0 | 1704 | $2,300 | $1.35 | 24d | 1 | 0.50mi |
| 5416 Bristo St Unit 5416 Lehigh Acres, FL | 3.0 | 2.0 | 1183 | $1,595 | $1.35 | 24d | 1 | 0.52mi |
| 1117 Abrams Blvd Lehigh Acres, FL | 3.0 | 2.0 | 1198 | $1,660 | $1.39 | 21d | 1 | 0.52mi |
| 5560 Belrose St Lehigh Acres, FL | 3.0 | 2.0 | 2197 | $2,500 | $1.14 | 2d | 1 | 0.58mi |
| 1131 Abrams Blvd Lehigh Acres, FL | 3.0 | 2.0 | 1198 | $1,660 | $1.39 | 24d | 1 | 0.60mi |
| 1133 Abrams Blvd Lehigh Acres, FL | 3.0 | 2.0 | 1198 | $1,660 | $1.39 | 24d | 1 | 0.61mi |
| 5229 7th St W Lehigh Acres, FL | 3.0 | 2.0 | 1793 | $2,700 | $1.51 | 24d | 1 | 0.65mi |
| 5518 Billings St Lehigh Acres, FL | 3.0 | 2.0 | 1640 | $2,000 | $1.22 | 24d | 1 | 0.68mi |
| 5231 6th St W Lehigh Acres, FL | 4.0 | 3.5 | 1801 | $2,750 | $1.53 | 24d | 1 | 0.68mi |
| 910 Atherton Ave Lehigh Acres, FL | 4.0 | 3.0 | 1715 | $2,300 | $1.34 | 19d | 1 | 0.69mi |
| 1005 Adeline Ave Lehigh Acres, FL | 4.0 | 2.0 | 1819 | $2,100 | $1.15 | 3d | 1 | 0.74mi |
| 826 Adeline Ave Lehigh Acres, FL | 3.0 | 2.0 | 1550 | $1,920 | $1.24 | 24d | 1 | 0.76mi |
| 8753 Buckingham Rd Fort Myers, FL | 3.0 | 2.0 | 2172 | $1,800 | $0.83 | 3d | 1 | 0.78mi |
| 8649 Athena Ct Lehigh Acres, FL | 2.0 | 2.5 | 1445 | $1,750 | $1.21 | 24d | 1 | 0.83mi |
| 8585 Athena Ct Lehigh Acres, FL | 2.0 | 2.5 | 1445 | $1,650 | $1.14 | 24d | 1 | 0.84mi |
| 8567 Athena Ct Lehigh Acres, FL | 2.0 | 2.5 | 1143 | $1,600 | $1.40 | 24d | 1 | 0.85mi |
| 8541 Athena Ct Lehigh Acres, FL | 2.0 | 2.5 | 1143 | $1,600 | $1.40 | 24d | 1 | 0.86mi |
| 5003 Barth St Lehigh Acres, FL | 3.0 | 2.0 | 1558 | $1,816 | $1.17 | 3d | 1 | 0.94mi |
| 5227 3rd St W Lehigh Acres, FL | 4.0 | 2.5 | 2102 | $2,260 | $1.08 | 24d | 1 | 0.95mi |
| 11744 Eros Rd Lehigh Acres, FL | 2.0 | 2.5 | 1520 | $1,995 | $1.31 | 24d | 1 | 0.95mi |
| 4914 Bywood St Lehigh Acres, FL | 3.0 | 2.0 | 1378 | $2,250 | $1.63 | 10d | 1 | 1.00mi |
| 5050 Jones Dr Lehigh Acres, FL | 3.0 | 2.0 | 1200 | $1,695 | $1.41 | 14d | 1 | 1.02mi |
| 4910 Bywood St Lehigh Acres, FL | 3.0 | 2.0 | 1858 | $2,750 | $1.48 | 24d | 1 | 1.03mi |
| 5240 26th St SW Lehigh Acres, FL | 3.0 | 2.0 | 1196 | $1,595 | $1.33 | 19d | 1 | 1.03mi |
| 5240-5242 26th St SW Lehigh Acres, FL | 3.0 | 2.0 | 1196 | $1,595 | $1.33 | 21d | 1 | 1.03mi |
| 5210 2nd St W Lehigh Acres, FL | 4.0 | 2.0 | 1612 | $1,740 | $1.08 | 24d | 1 | 1.05mi |
| 2118 Snead Dr Unit 2118 Lehigh Acres, FL | 3.0 | 2.0 | 1200 | $1,750 | $1.46 | 24d | 1 | 1.06mi |
| 5317 27th St SW Lehigh Acres, FL | 3.0 | 2.0 | 1156 | $1,425 | $1.23 | 24d | 1 | 1.07mi |
| 5317 27th St SW Lehigh Acres, FL | 3.0 | 2.0 | 1156 | $1,300 | $1.12 | 3d | 1 | 1.07mi |
| 5319 27th St SW Lehigh Acres, FL | 3.0 | 2.0 | 1156 | $1,425 | $1.23 | 24d | 1 | 1.07mi |
Listing history 3 events
-
2026-06-18days on market $5,000 Active 2 DOM
-
2026-06-17remarks 290-char remark
-
2026-06-17$5,000 Active 1 DOM
ⓘ Source: listings_history table (triggers on properties + properties_extension) + one-shot
backfill from property_details.listing_events for pre-trigger history.
Climate risk First Street
- Flood 1/10 Low FEMA zone X (unshaded) · 0% chance over 30 yrs
- Wildfire 4/10 Moderate
- Heat 10/10 Extreme 7 d/yr ≥107°F today · 29 d/yr by 30 yrs out
- Wind 10/10 Extreme 99% chance of damaging wind over 30 yrs
- Air quality 2/10 Low 1 unhealthy d/yr today · 1 by 30 yrs out
Nearby sold comps map
Loading sold comps map…
Walkable amenities ~0.75 mi
Loading nearby amenities…
Taxation est. · year 1
- Rental income
- $24,615
- − Mortgage interest
- −$280
- − Property taxes
- −$75
- − Insurance
- −$25
- − Repairs & maintenance
- −$1,969
- − Management
- −$1,969
- − Depreciation
- −$145
- Taxable income
- $20,151
- Est. tax owed @ 24.0%
- −$4,836
- After-tax cash flow
- $14,195/yr
For passive investors: Depreciation is non-cash, so a rental often shows a tax loss while cash-flowing — sheltering income. Rental losses are passive: they offset passive income freely, and up to $25,000/yr can offset ordinary (W-2) income if you actively participate and your MAGI is under $100k (phasing out to $0 by $150k); unused losses carry forward. On sale, claimed depreciation is recaptured at up to 25%, and gains may owe capital-gains tax (a 1031 exchange can defer both). Figures are a year-1 estimate at your 24.0% rate — not tax advice; consult a CPA.
Schools (NCES district)
- District
- Lee
- NCES district ID
- 1201080
- Math proficiency
- 47% ▼ -11.00%
- Reading proficiency
- 50% ▼ -4.00%
- Median HH income
- $49,518
- Composite
- 41.49/100
- National rank
- #3458
- State rank
- #42 of 73 in FL
Livability — Lehigh Acres
- Score
- 59/100
- State rank
- #826
- US rank
- #20055
Category grades
Schools grade is shown separately in the Schools card above.
Census & demographics
- Census place
- Lehigh Acres, FL
- County
- Lee County · 788,662 people
- City population
- 130,638
- Metro
- Cape Coral-Fort Myers, FL
- Population (ZIP)
- 30,790
- Household income
- $77,723
- Rent vs Own
- Severe rent burden
- 587.0
Population outlook (Lee County) Hauer SSP2
- Today (2025)
- 871,946 people
- By 2030
- 955,468 · +9.6%
- By 2040
- 1,113,587 · +27.7%
- By 2050
- 1,256,891 · +44.1%
- By 2075
- 1,560,270 · +78.9%
- By 2100
- 1,726,848 · +98.0%
Race, ethnicity, and origin ACS 2023
- Neighborhood character
- Diverse neighborhood (Simpson 0.65)
- Race & ethnicity
- Hispanic / Latino 49% Two or more races 32% White 26% Black 19% Asian 2%
- Hispanic origin (detail)
- Mexican 9% Puerto Rican 13% Cuban 14% Dominican 2%
- Common ancestry
- Hispanic 7% Estonian 1% Romanian 1%
- Foreign-born
- 31% · Canada, Vietnam, Guatemala
- Languages at home
- 46% English-only · Spanish 41% French/Haitian/Cajun 9% Other Indo-European 2%
Political lean MEDSL · Lee
- 2024 margin
- Strong R (+28.4) · D 35.5% · R 63.9%
- 2008→2024 swing
- -18.0pp toward R · 2008: -10.4pp · 2024: -28.4pp
- All cycles
- 2024: R+28.4 2020: R+19.2 2016: R+20.4 2012: R+16.6 2008: R+10.4
Not yet ingested
- Civics
- —
Market trends
- HPI YoY
- ▼ -27.68%
- Current HPI
- 317.7147
- Rent YoY
- ▼ -4.69%
- Metro
- Cape Coral-Fort Myers, FL
- State GDP YoY
- ▲ 3.28%
- F500 in state
- 36
Industry mix (Fortune 500 HQ in FL)
| Industry | F500 HQs | Revenue |
|---|---|---|
| Industrial Technology | 2 | $29B |
|
||
| Insurance | 2 | $17B |
|
||
| Retail | 1 | $60B |
|
||
| Technology Distribution | 1 | $58B |
|
||
| Homebuilding | 1 | $35B |
|
||
| Technology Manufacturing | 1 | $35B |
|
||
Price history
-98.0% since first listed9 events — show timeline
- 2026-06-16 Listed $5,000 NFMLS
- 2019-06-26 Sold (Public Records) $210,000 Public Records
- 2019-06-24 Sold (MLS) $210,000 FORTMLS
- 2019-04-28 Pending — FORTMLS
- 2019-01-13 Price Changed $220,000 FORTMLS
- 2018-12-08 Price Changed $234,900 FORTMLS
- 2018-07-30 Price Changed $239,899 FORTMLS
- 2018-05-02 Price Changed $239,900 FORTMLS
- 2018-04-05 Listed $245,000 FORTMLS
Property tax history
+8.5%/yrLatest (2025): $4,076 · +3.4% YoY. Source: county tax records.
Cash-flow waterfall
monthlySold comps — $/sqft
last 12 mo · ≤1 miLoading sold comps…