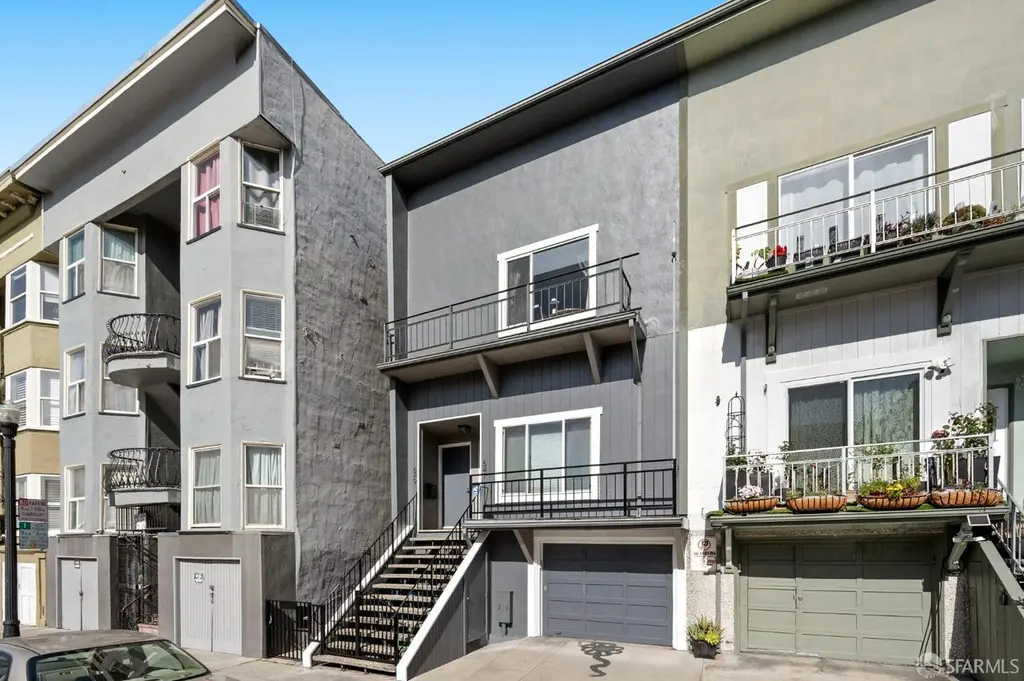
 Triplex
647-649 Capp St · San Francisco, CA
Flood risk 1/10 · Minimal
- FEMA flood zone
- X (unshaded)
- Chance of flooding over 30 yrs
- 0.0%
- Est. flood insurance / yr
- $507 – $1,088
Fire risk 1/10 · Minimal
- Est. fire insurance / yr
- $659 – $1,223
Heat risk 2/10 · Minimal
- Hot days now (above 78°F)
- 8 days/yr
- Hot days in 30 yrs
- 19 days/yr
Wind risk 1/10 · Minimal
- Chance of severe wind over 30 yrs
- —
Air-quality risk 8/10 · Major
- Unhealthy air days now
- 15 days/yr
- Unhealthy air days in 30 yrs
- 15 days/yr
Risk factors via First Street. Map © Google.
Why this score? — see what drove the A- grade
The composite is a weighted blend of 9 inputs, each scored 0–100. Each bar is that input's sub-score; the figure is the points it added to the 100-point composite (weight × sub-score).
- Cash flow +30.0/30.0
- ARV discount +14.3/15.0
- 1% rule +10.0/10.0
- DSCR +10.0/10.0
- Rent growth +5.0/5.0
- Schools +5.0/10.0
- Livability +3.8/5.0
- Condition / age +2.5/5.0
- Appreciation +0.0/10.0
$1,095,000
🖨 Deal sheet (PDF) 📄 Offer letter ✓ Due diligence
Multi-family units
County records classify this as Multi-Family (2-4 Unit). Listing-text estimate: 3 units. confirmed
Listing remarks
Fully leased and delivering immediate income, 647-649 Capp Street presents a compelling investment opportunity in the heart of San Francisco's vibrant Mission District. This well-maintained triplex features three income-generating units and a separately leased garage, offering strong in-place cash flow with additional long-term upside potential. Ideally positioned on a quiet street off of the Valencia and Mission corridors, the property enjoys effortless access to the Mission's renowned dining, cafes, nightlife, and cultural attractions, along with convenient proximity to public transportation and major commuter routes. This central location continues to attract consistent tenant demand, su
Key facts
- Quiet street
- 1,720 sq ft lot
- 2 garage spots
Tags
Property features AI
Finance
- Financial info: Three units total, three units currently leased; Unit mix: two 1-bedroom units and one 2-bedroom unit
- HOA & community: No association fee
Exterior
- Parking: Attached tandem garage accommodating 2 cars; Garage may be leased separately
- Utilities: City utilities; Natural gas connected with separate meter; Electricity on a separate meter; Public sewer; Public water
- Home design: Residential income property (Triplex); Built in 1933
- Construction: Year built 1933
- Exterior features: Lot approximately 1,720.6 sq ft; Lot shows original and updated/remodeled condition noted for property
Interior
- Kitchen: Dishwasher; Free-standing gas oven; Free-standing refrigerator
- Bedrooms: Total of 4 bedrooms across units (unit-level distribution: two 2-bed units and one 1-bed unit)
- Flooring: Carpet; Tile; Wood
- Bathrooms: 3 full bathrooms total
- Heating & cooling: Central heating; Wall furnace
- Interior features: Central heating and wall furnace; Dishwasher; Free-standing gas oven; Free-standing refrigerator; Appliances may vary by unit
- Laundry & utility: No furnished units (units listed as unfurnished)
Neighborhood map
What this means for you Summary
Snapshot
- This is a 3 × 4-bed/3.0-bath units multifamily listed at $1.09M.
Deal economics
- At list price, monthly cash flow is $9k ($103k/yr) — positive. Per door: $3k/mo.
- The deal already cash-flows at list — no discount required.
- Meets the 1% rule at list price ($21k rent vs $1.09M).
- Recommended offer: $1.08M (1.5% below list) — sets the bar for market timing.
- Cap rate 15.7% vs local median 2.1% in San Francisco — top-decile yield for the area; either an underpriced asset or a hidden risk that comps aren't pricing in. Stress-test before assuming the spread holds.
Location & tenants
- Location reads 76/100 on livability (#90 in CA, #3,143 nationally) — a middle-class / working-renter tenant base. Strengths: amenities A+, commute A+, employment A+; Watch: crime F, cost of living F.
- San Francisco Unified (urban): math 50% / reading 56% proficiency, ranked #322 of 1,400 in CA (top 23%) — acceptable for families but not a draw, mixed tenant base, ~2y average lease.
- Zoned schools: Lilienthal (Claire) Elementary (669 students, 19% FRL); Giannini (A.P.) Middle (1,192 students, 34% FRL); Lowell High (2,632 students, 37% FRL) — zoned schools average 30% FRL vs 49% district-wide (19 pts lower); this property's tenant base skews higher-income than the district average.
- Market conditions: Rents rising fast (+14.5%/yr); 162 active listings in the ZIP; 5 comparable units currently listed for rent nearby; rentals lingering (median 46d on market — plan ~5-8 weeks vacancy on turnover, expect pricing pressure); 60% of comp listings sitting > 30 days — soft ceiling on asking rent; high-income renter base; 750 units permitted in San Francisco County in 2024 (688 in 5+ unit buildings).
- At $20,664/mo this rent would consume 157% of the median local household income ($158k/yr) (locally 2732% of renters already pay >50% of income on rent) — very limited rent-growth headroom before tenants either downsize or default.
Forward outlook
- Local home prices are declining (-3.0%/yr); year-one equity from $8k of loan paydown is wiped out by about $33k of value loss. Plan a longer hold.
- San Francisco County population projected at +39% by 2050 — long-run rental-demand tailwind backs the buy-and-hold thesis.
- At projected returns (-3.0% appreciation + 8.0% rent growth), your $307k cash investment doubles in ~4 years — after that, you're playing with house money.
Negotiation context
- It's been on market 25 days — a 2% lower offer ($1.08M) is reasonable based on typical stale-listing flexibility.
- 5 sale attempts since 10y ago with the ask held roughly flat each time — persistent listings suggest the price (not the market) is what's stuck; bring a comps-based counter.
Risks & watch-outs
- Watch-outs: built in 1933 — expect roof / HVAC / electrical / plumbing capex.
Questions for the listing agent
- Can we see the unit-by-unit rent roll, current vacancy, and any below-market leases? What's the average tenancy length?
- What capital expenditures (roof, boiler, parking lot, exteriors) have been made in the last 5 years, and what's planned in the next 2?
- Built in 1933 — when were the roof, HVAC, electrical panel, plumbing, and water heater last replaced?
- Is there a deadline driving the sale (1031 exchange, divorce, estate, relocation)? That informs how much negotiation room exists.
- Schools are B-rated — typically a magnet for longer-tenancy family renters. What's the average tenant stay here, and is there a school-zone premium baked into asking?
- Crime grade is F in this area — have there been break-ins, vandalism, or insurance claims at this property in the last 3 years? What carrier currently insures it and at what premium?
- What's the average days-on-market for RENTAL listings here right now (not sales)? A rising rental-DOM trend means longer vacancies and softer asking-rent achievability than the comps imply.
- What's the recent tenant-quality profile in this submarket — average credit score on applications, eviction rate, late-payment / NSF rate, and stable-employment percentage? A property-management company in the area should have these aggregated.
- How much new apartment / multifamily construction is in the pipeline within 1–3 miles? Heavy new supply (>2% of stock underway) typically softens rents 12–24 months out; light construction supports rent growth.
Investment metrics
- 1% rule
- 1.89% ✓
- Cap rate
- 15.69%
- Cash-on-cash
- 33.58%
- DSCR
- 2.49
- GRM
- 4.4
CMA / ARV
- ARV (median comp)
- $1,290,124
- List price
- $1,095,000
- Delta
- -15.12%
- Verdict
- UNDERPRICED
- Comps
- 20 within 1.0 mi
Show comp detail 12 sales within ~0.75 mi
| Address | Dist | Beds/Ba | Sqft | Sold | Price | $/sf | Match |
|---|---|---|---|---|---|---|---|
| 647-649 Capp St | 0.00mi | 4/3.0 (-1) | 2,710 (0%) | 0mo | $1,128,000 | $416 | 95 |
| 1191 Guerrero St | 0.40mi | 4/2.0 (-1) | 2,680 (-1%) | 2mo | $1,850,000 | $690 | 69 |
| 1174 - 1176 Florida St | 0.45mi | 4/2.5 (-1) | 2,690 (-1%) | 4mo | $2,150,000 | $799 | 67 |
| 2977-2979 21st St | 0.20mi | 4/3.0 (-1) | 3,000 (+11%) | 1mo | $2,300,000 | $767 | 67 |
| 2711 Harrison St | 0.36mi | 5/2.0 | 2,524 (-7%) | 5mo | $1,200,000 | $475 | 64 |
| 41-43 Alvarado St | 0.30mi | 4/2.0 (-1) | 2,952 (+9%) | 1mo | $2,850,000 | $965 | 61 |
| 39-41 Dolores Ter | 0.61mi | 4/3.0 (-1) | 2,477 (-9%) | 1mo | $4,215,000 | $1,702 | 51 |
| 48 Sycamore St | 0.47mi | 4/4.0 (-1) | 2,950 (+9%) | 7mo | $1,703,000 | $577 | 49 |
| 832 Florida St | 0.39mi | 6/4.0 (+1) | 2,345 (-14%) | 2mo | $1,185,000 | $505 | 48 |
| 3640-3642 17th St | 0.71mi | 4/1.0 (-1) | 2,595 (-4%) | 3mo | $2,800,000 | $1,079 | 44 |
| 2436-2438 Bryant St | 0.43mi | 4/1.0 (-1) | 2,378 (-12%) | 5mo | $1,230,000 | $517 | 42 |
| 72-74 Cumberland St | 0.47mi | 4/2.0 (-1) | 3,110 (+15%) | 7mo | $2,280,000 | $733 | 38 |
Match score weights: distance 35% · size 25% · config 20% · recency 20%. Top-matched comps best support the ARV.
Projected returns pro-forma
-3.0% appreciation · 8.0% rent growth · sell at horizon
- IRR
- 34.5%
- Equity multiple
- 2.56×
- Total profit
- $478,566
- Equity at exit
- $163,268
- IRR
- 43.9%
- Equity multiple
- 6.28×
- Total profit
- $1,619,021
- Equity at exit
- $94,676
Cash invested: $306,600 (down + closing). Projections, not guarantees.
Landlord ↔ Tenant lean methodology
- Overall (CITY)
- 0 Strongly Tenant-Friendly
- State California
- 18 Strongly Tenant-Friendly · D+13
- County
- — inherits STATE
- City San Francisco
- 0 Strongly Tenant-Friendly · D+57
ZIP-level market 94110
- Rents YoY
- 14.5%
- Active inventory
- 162
- Price-to-rent
- 13.2×
Monthly cashflow live
- Estimated rent
- $20,664 high interval (Pro) →
- Mortgage (P&I)
- −$5,742
- Tax from tax record
- −$1,547 /mo · $18,569/yr
- Insurance
- −$456
- HOA
- −$0
- Vacancy / Maint / Mgmt
- −$4,339
- Net cashflow
- $8,579
Break-even live
Sensitivity live
| Price | -10% $9,198 | -5% $8,889 | +0% $8,579 | +5% $8,269 | +10% $7,959 |
|---|---|---|---|---|---|
| Rent | -10% $6,946 | -5% $7,762 | +0% $8,579 | +5% $9,395 | +10% $10,211 |
| Rate | -1.0pp $9,130 | -0.5pp $8,857 | base $8,579 | +0.5pp $8,295 | +1.0pp $8,006 |
3-unit breakdown (identical units grouped — click to expand)
| Units | Beds | Baths | Est. rent |
|---|---|---|---|
| 3× units | 4 | 3 | $20,664 |
| #1 | 4 | 3 | $6,888 |
| #2 | 4 | 3 | $6,888 |
| #3 | 4 | 3 | $6,888 |
| Total (3 units) | $20,664 | ||
UW: 25.0% down · 7.5% · 30yr · 1.5% tax · 5.0% vac · 8.0% maint · 8.0% mgmt
Financing live
Cash to close
- Down payment
- $273,750
- Closing costs
- $32,850
- Reserves months
- —
- Total cash needed
- —
Loan-product check · same deal, 3 products live
Conventional
25% down · 7.5% · 30yr
- Down + closing
- —
- Monthly P&I
- —
- Monthly cashflow
- —
- DSCR
- —
- Eligible?
- —
Personal DTI + credit; lowest rate.
DSCR
20% down · 8.5% · 30yr
- Down + closing
- —
- Monthly P&I
- —
- Monthly cashflow
- —
- DSCR
- —
- Eligible?
- —
No personal income docs; deal must DSCR.
Hard money
10% down · 12.0% · 12mo
- Down + closing
- —
- Monthly P&I
- —
- Monthly cashflow
- —
- DSCR
- —
- Eligible?
- —
Short-term bridge; refi at stabilization.
Rent comps 5 comps
| Address | Beds | Baths | Sqft | Rent | $/sqft | DOM | Units | Dist |
|---|---|---|---|---|---|---|---|---|
| 471 S Van Ness Ave San Francisco, CA | 4.0 | 3.0 | 2140 | $11,000 | $5.14 | 17d | 1 | 0.67mi |
| 753 Castro St San Francisco, CA | 4.0 | 3.0 | 2467 | $10,950 | $4.44 | 46d | 1 | 0.90mi |
| 701 Castro St San Francisco, CA | 5.0 | 4.0 | 3300 | $22,995 | $6.97 | 20d | 1 | 0.91mi |
| 143 Corbett Ave San Francisco, CA | 4.0 | 4.0 | 2500 | $10,500 | $4.20 | 46d | 1 | 1.34mi |
| 65 High St Unit NA San Francisco, CA | 4.0 | 3.0 | 2315 | $9,950 | $4.30 | 46d | 1 | 1.48mi |
Listing history 11 events
-
2026-05-01$1,095,000 Active 914-char remark
-
2017-01-04soldstatus $935,000
-
2016-12-26historical
-
2016-10-14status Active
-
2016-10-08historical Contingent - Show
-
2016-09-23price $2,299,000
-
2016-07-14price $2,349,000
-
2016-06-10$2,598,000 Active
-
2016-05-06$2,625,000
-
2016-05-06$1,100,000
-
2014-03-25soldstatus $950,000
ⓘ Source: listings_history table (triggers on properties + properties_extension) + one-shot
backfill from property_details.listing_events for pre-trigger history.
Tax reassessment forecast CA · Resets to sale price
- Current annual tax
- $18,569 · $1,547/mo
- Projected year-2 tax
- $18,569 · $1,547/mo
- Expected delta
- $0/yr ($0/mo · 0.0%)
ⓘ Screening estimate from a state-policy table — verify with the county assessor before closing.
Climate risk First Street
- Flood 1/10 Low FEMA zone X (unshaded) · 0% chance over 30 yrs
- Wildfire 1/10 Low
- Heat 2/10 Low 8 d/yr ≥78°F today · 19 d/yr by 30 yrs out
- Wind 1/10 Low
- Air quality 8/10 Severe 15 unhealthy d/yr today · 15 by 30 yrs out
Nearby sold comps map
Loading sold comps map…
Walkable amenities ~0.75 mi
Loading nearby amenities…
Taxation est. · year 1
- Rental income
- $247,968
- − Mortgage interest
- −$61,337
- − Property taxes
- −$18,569
- − Insurance
- −$5,475
- − Repairs & maintenance
- −$19,837
- − Management
- −$19,837
- − Depreciation
- −$31,855
- Taxable income
- $91,058
- Est. tax owed @ 24.0%
- −$21,854
- After-tax cash flow
- $81,090/yr
For passive investors: Depreciation is non-cash, so a rental often shows a tax loss while cash-flowing — sheltering income. Rental losses are passive: they offset passive income freely, and up to $25,000/yr can offset ordinary (W-2) income if you actively participate and your MAGI is under $100k (phasing out to $0 by $150k); unused losses carry forward. On sale, claimed depreciation is recaptured at up to 25%, and gains may owe capital-gains tax (a 1031 exchange can defer both). Figures are a year-1 estimate at your 24.0% rate — not tax advice; consult a CPA.
Schools (NCES district)
- District
- San Francisco Unified
- NCES district ID
- 0634410
- Math proficiency
- 50% ▬ 0.00%
- Reading proficiency
- 56% ▲ 1.00%
- Median HH income
- $81,249
- Composite
- 50.14/100
- National rank
- #4088
- State rank
- #322 of 1400 in CA
Livability — San Francisco
- Score
- 76/100
- State rank
- #90
- US rank
- #3143
Category grades
Schools grade is shown separately in the Schools card above.
Census & demographics
- Census place
- San Francisco, CA
- County
- San Francisco County · 827,552 people
- City population
- 827,552
- Metro
- San Francisco-Oakland-Berkeley, CA
- Population (ZIP)
- 66,865
- Household income
- $158,351
- Rent vs Own
- Severe rent burden
- 2732.0
Population outlook (San Francisco County) Hauer SSP2
- Today (2025)
- 1,030,936 people
- By 2030
- 1,110,409 · +7.7%
- By 2040
- 1,270,010 · +23.2%
- By 2050
- 1,435,001 · +39.2%
- By 2075
- 1,779,074 · +72.6%
- By 2100
- 1,966,767 · +90.8%
Race, ethnicity, and origin ACS 2023
- Neighborhood character
- Highly diverse neighborhood (Simpson 0.70)
- Race & ethnicity
- White 41% Hispanic / Latino 32% Asian 16% Two or more races 15% Black 4% Native American 1%
- Hispanic origin (detail)
- Mexican 16% Puerto Rican 1%
- Common ancestry
- Lithuanian 3% Italian 2% Romanian 2%
- Foreign-born
- 28% · Canada, China, Vietnam
- Languages at home
- 58% English-only · Spanish 27% Chinese 5% Other Indo-European 2%
Political lean MEDSL · San Francisco
- 2024 margin
- Solid D (+64.8) · D 80.3% · R 15.5% · Other 4.1%
- 2008→2024 swing
- -5.7pp toward R · 2008: 70.5pp · 2024: 64.8pp
- All cycles
- 2024: D+64.8 2020: D+72.5 2016: D+76.1 2012: D+70.2 2008: D+70.5
Not yet ingested
- Civics
- —
Market trends
- HPI YoY
- ▼ -1385.62%
- Current HPI
- 267.2424
- Rent YoY
- ▲ 14.54%
- Metro
- San Francisco-Oakland-Berkeley, CA
- State GDP YoY
- ▲ 3.21%
- F500 in state
- 116
Industry mix (Fortune 500 HQ in CA)
| Industry | F500 HQs | Revenue |
|---|---|---|
| Technology | 27 | $1,492B |
|
||
| Financial Services | 3 | $174B |
|
||
| Retail | 3 | $44B |
|
||
| Insurance | 3 | $26B |
|
||
| Media / Entertainment | 2 | $115B |
|
||
| Pharmaceuticals / Biotech | 2 | $62B |
|
||
Price history
+18.7% since first listed13 events — show timeline
- 2026-06-12 Sold (MLS) $1,128,000 San Francisco MLS
- 2026-05-26 Pending — San Francisco MLS
- 2026-05-01 Listed $1,095,000 San Francisco MLS
- 2017-01-04 Sold (Public Records) $935,000 Public Records
- 2016-12-26 Delisted — San Francisco MLS
- 2016-10-14 Relisted — San Francisco MLS
- 2016-10-08 Contingent — San Francisco MLS
- 2016-09-23 Price Changed $2,299,000 San Francisco MLS
- 2016-07-14 Price Changed $2,349,000 San Francisco MLS
- 2016-06-10 Listed $2,598,000 San Francisco MLS
- 2016-05-06 Listed $1,100,000 San Francisco MLS
- 2016-05-06 Listed $2,625,000 San Francisco MLS
- 2014-03-25 Sold (Public Records) $950,000 Public Records
Property tax history
+18.8%/yrLatest (2025): $18,569 · +3.0% YoY. Source: county tax records.
Cash-flow waterfall
monthlySold comps — $/sqft
last 12 mo · ≤1 miLoading sold comps…