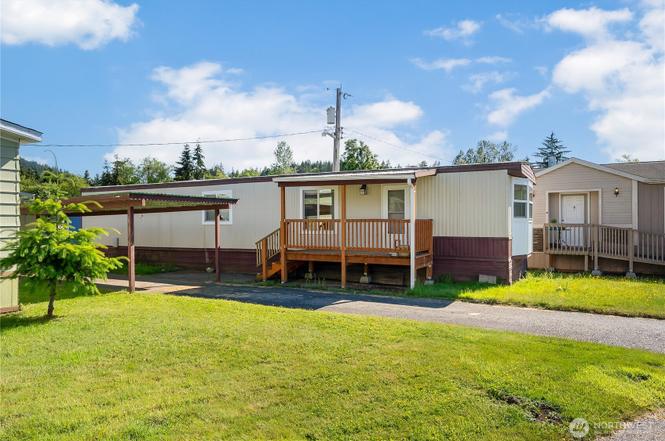
2400 Donovan Ave #53 · Bellingham, WA
Flood risk 4/10 · Minor
- FEMA flood zone
- X (unshaded)
- Chance of flooding over 30 yrs
- 0.24%
- Est. flood insurance / yr
- $507 – $1,088
Fire risk 2/10 · Minimal
- Est. fire insurance / yr
- $604 – $1,122
Heat risk 3/10 · Minor
- Hot days now (above 83°F)
- 8 days/yr
- Hot days in 30 yrs
- 20 days/yr
Wind risk 1/10 · Minimal
- Chance of severe wind over 30 yrs
- —
Air-quality risk 6/10 · Moderate
- Unhealthy air days now
- 9 days/yr
- Unhealthy air days in 30 yrs
- 10 days/yr
Risk factors via First Street. Map © Google.
Why this score? — see what drove the B- grade
The composite is a weighted blend of 9 inputs, each scored 0–100. Each bar is that input's sub-score; the figure is the points it added to the 100-point composite (weight × sub-score).
- Cash flow +30.0/30.0
- 1% rule +10.0/10.0
- DSCR +10.0/10.0
- Schools +4.8/10.0
- ARV discount +4.7/15.0
- Livability +4.0/5.0
- Rent growth +3.2/5.0
- Condition / age +2.5/5.0
- Appreciation +0.0/10.0
$90,000
🖨 Deal sheet 📄 Offer letter ✓ Due diligence
Listing remarks
Enjoy affordable Southside living in the 55+ community of South End Mobile Estates, just minutes from Fairhaven and the Interurban Trail system. This 2 bedroom, 1 bathroom home has been nicely updated with new flooring throughout along with an updated kitchen and bathroom, giving the home a more updated feel while still keeping things simple and practical. Covered front porch and carport help make day to day living a little easier, while the additional exterior storage provides extra room for tools, gear, or seasonal storage. Easy access to Fairhaven, Happy Valley, Padden Creek trails, and I-5 keeps you close to everything on Bellingham’s south side without giving up affordability. Pa
Key facts
- Covered front porch
- Updated kitchen
- Built 1982
Tags
Property features AI
Finance
- Other: Annual taxes reported (2026): $506.25
- Financial info: Land lease: $800/month; Listing terms: Cash or conventional
- HOA & community: Located in South End Mobile Estates (manufactured home park); Park amenities include clubhouse and high-speed internet availability; Park approved for sale; Senior community
Exterior
- Parking: Carport
- Utilities: Public water (City of Bellingham); Public sewer (City of Bellingham); Puget Sound power; Internet: Comcast Xfinity; Energy sources: Electric and natural gas
- Home design: Manufactured single-wide home; One story; Manufactured house (residential)
- Construction: Cement plank and metal/vinyl construction
- Exterior features: Paved lot; Cement planked and metal/vinyl exterior; Has a view
Interior
- Kitchen: Dishwasher; Refrigerator; Stove/Range
- Bedrooms: 2 bedrooms
- Flooring: Laminate flooring; Vinyl plank flooring
- Bathrooms: One three-quarter bath (shower only)
- Heating & cooling: Forced air heating; No central cooling
- Interior features: Dining room and living room; Kitchen without eating space; Dishwasher; Refrigerator; Stove/Range; Double pane windows; Patio/porch/deck
- Laundry & utility: Washer; Dryer
Neighborhood map
What this means for you Summary
Snapshot
- This is a 2-bed/1.0-bath manufactured listed at $90k.
Deal economics
- At list price, monthly cash flow is $1k ($13k/yr) — positive.
- The deal already cash-flows at list — no discount required.
- Meets the 1% rule at list price ($2k rent vs $90k).
- Cap rate 20.5% vs local median 2.0% in Bellingham — top-decile yield for the area; either an underpriced asset or a hidden risk that comps aren't pricing in. Stress-test before assuming the spread holds.
Location & tenants
- Location reads 80/100 on livability (#102 in WA, #1,947 nationally) — a professional / high-income tenant draw. Strengths: amenities A+, commute A+, health & safety A+; Watch: crime F, cost of living F.
- Bellingham School District (urban): math 47% / reading 63% proficiency, ranked #106 of 291 in WA (top 36%) — acceptable for families but not a draw, mixed tenant base, ~2y average lease.
- Market conditions: Rents rising (+2.7%/yr); 235 active listings in the ZIP; 26 comparable units currently listed for rent nearby; rentals at typical pace (median 21d on market — plan ~3-4 weeks tenant-placement turnaround); 1,190 units permitted in Whatcom County in 2024 (327 in 5+ unit buildings).
- This rent runs 38% of the median local income ($64k/yr) — at the standard rent-burdened threshold; future hikes will face affordability resistance.
Forward outlook
- Local home prices are declining (-3.0%/yr); year-one equity from $622 of loan paydown is wiped out by about $3k of value loss. Plan a longer hold.
- Whatcom County population projected at +28% by 2050 — long-run rental-demand tailwind backs the buy-and-hold thesis.
- At projected returns (-3.0% appreciation + 2.7% rent growth), your $25k cash investment doubles in ~3 years — after that, you're playing with house money.
Negotiation context
- Only 7 days on market — expect competitive offers; lowballing is unlikely to land.
Questions for the listing agent
- Is there a deadline driving the sale (1031 exchange, divorce, estate, relocation)? That informs how much negotiation room exists.
- Schools are B-rated — typically a magnet for longer-tenancy family renters. What's the average tenant stay here, and is there a school-zone premium baked into asking?
- Crime grade is F in this area — have there been break-ins, vandalism, or insurance claims at this property in the last 3 years? What carrier currently insures it and at what premium?
- What's the average days-on-market for RENTAL listings here right now (not sales)? A rising rental-DOM trend means longer vacancies and softer asking-rent achievability than the comps imply.
- What's the recent tenant-quality profile in this submarket — average credit score on applications, eviction rate, late-payment / NSF rate, and stable-employment percentage? A property-management company in the area should have these aggregated.
- How much new for-sale + rental construction is in the pipeline within 1–3 miles? Heavy new supply typically softens prices + rents 12–24 months out; constrained supply supports both.
Investment metrics
- 1% rule
- 2.27% ✓
- Cap rate
- 20.45%
- Cash-on-cash
- 50.58%
- DSCR
- 3.25
- GRM
- 3.7
CMA / ARV
- ARV (on-the-fly)
- $84,672
- Comps found
- 4
Show comp detail 4 sales within ~0.75 mi
| Address | Dist | Beds/Ba | Sqft | Sold | Price | $/sf | Match |
|---|---|---|---|---|---|---|---|
| 2400 Donovan Ave #64 | 0.00mi | 2/1.0 | 784 (0%) | 1mo | $56,000 | $71 | 99 |
| 2400 Donovan Ave #57 | 0.00mi | 2/1.0 | 784 (0%) | 14mo | $85,000 | $108 | 88 |
| 2400 Donovan Ave Unit 14C | 0.00mi | 2/1.0 | 846 (+8%) | 15mo | $106,000 | $125 | 74 |
| 2400 Donovan Ave #41 | 0.00mi | 2/1.0 | 864 (+10%) | 13mo | $56,000 | $65 | 72 |
Match score weights: distance 35% · size 25% · config 20% · recency 20%. Top-matched comps best support the ARV.
Projected returns pro-forma
-3.0% appreciation · 2.67% rent growth · sell at horizon
- IRR
- 48.0%
- Equity multiple
- 3.08×
- Total profit
- $52,376
- Equity at exit
- $13,419
- IRR
- 53.5%
- Equity multiple
- 6.16×
- Total profit
- $129,910
- Equity at exit
- $7,782
Cash invested: $25,200 (down + closing). Projections, not guarantees.
Landlord ↔ Tenant lean methodology
- Overall (STATE)
- 28 Tenant-Leaning
- State Washington
- 28 Tenant-Leaning · D+8
- County
- — inherits STATE
- City
- — inherits STATE
ZIP-level market 98225
- Rents YoY
- 2.7%
- Active inventory
- 235
- Price-to-rent
- 3.7×
Monthly cashflow live
- Estimated rent
- $2,042 high interval (Pro) →
- Mortgage (P&I)
- −$472
- Tax from tax record
- −$42 /mo · $499/yr
- Insurance
- −$38
- HOA
- −$0
- Vacancy / Maint / Mgmt
- −$429
- Net cashflow
- $1,062
Break-even live
UW: 25.0% down · 7.5% · 30yr · 1.5% tax · 5.0% vac · 8.0% maint · 8.0% mgmt
Financing live
Cash to close
- Down payment
- $22,500
- Closing costs
- $2,700
- Reserves months
- —
- Total cash needed
- —
Loan-product check · same deal, 3 products live
Conventional
25% down · 7.5% · 30yr
- Down + closing
- —
- Monthly P&I
- —
- Monthly cashflow
- —
- DSCR
- —
- Eligible?
- —
Personal DTI + credit; lowest rate.
DSCR
20% down · 8.5% · 30yr
- Down + closing
- —
- Monthly P&I
- —
- Monthly cashflow
- —
- DSCR
- —
- Eligible?
- —
No personal income docs; deal must DSCR.
Hard money
10% down · 12.0% · 12mo
- Down + closing
- —
- Monthly P&I
- —
- Monthly cashflow
- —
- DSCR
- —
- Eligible?
- —
Short-term bridge; refi at stabilization.
Rent comps 26 comps
| Address | Beds | Baths | Sqft | Rent | $/sqft | DOM | Units | Dist |
|---|---|---|---|---|---|---|---|---|
| 2214 Wilson Ave Unit B Bellingham, WA | 2.0 | 1.5 | 900 | $1,900 | $2.11 | 13d | 1 | 0.17mi |
| 2707 Connelly Ave Bellingham, WA | 2.0 | 2.0 | 1018 | $2,495 | $2.45 | 13d | 1 | 0.19mi |
| 2102 Harris Ave Unit 2106-3 Bellingham, WA | 2.0 | 1.0 | 850 | $1,825 | $2.15 | 13d | 1 | 0.41mi |
| 3129 Old Fairhaven Pkwy Bellingham, WA | 2.0 | 1.0 | 711 | $2,310 | $3.25 | 13d | 2 | 0.41mi |
| 2506 Douglas Ave Bellingham, WA | 2.0 | 1.0 | 880 | $1,875 | $2.13 | 13d | 2 | 0.56mi |
| 1021 24th St Unit 1021 9 Bellingham, WA | 2.0 | 1.0 | 800 | $1,595 | $1.99 | 21d | 1 | 0.56mi |
| 1014 23rd St Unit 12 Bellingham, WA | 2.0 | 1.0 | 784 | $1,745 | $2.23 | 21d | 1 | 0.58mi |
| 2170 Douglas Ave Bellingham, WA | 3.0–4.0 | 2.0 | 1069 | $2,325 | $2.17 | 13d | 4 | 0.62mi |
| 2305 Douglas Ave Bellingham, WA | 1.0–4.0 | 1.0–4.0 | 1089 | $2,222 | $2.04 | 13d | 16 | 0.65mi |
| 926 23rd St Bellingham, WA | 2.0 | 1.0 | 862 | $1,835 | $2.13 | 13d | 8 | 0.67mi |
| 930 22nd St Bellingham, WA | 1.0–3.0 | 1.0–2.0 | 900 | $2,008 | $2.23 | 21d | 5 | 0.68mi |
| 926 22nd St Unit 926-19 Bellingham, WA | 2.0 | 1.0 | 850 | $1,800 | $2.12 | 21d | 1 | 0.68mi |
| 920 22nd St Bellingham, WA | 3.0 | 1.5 | 1000 | $2,638 | $2.64 | 13d | 3 | 0.70mi |
| 910 21st St Unit 103 Bellingham, WA | 2.0 | 1.0 | 672 | $1,650 | $2.46 | 21d | 1 | 0.74mi |
| 910 20th St Apt 201 Bellingham, WA | 2.0 | 1.0 | 765 | $1,650 | $2.16 | 21d | 1 | 0.76mi |
| 808 21st St Bellingham, WA | 2.0 | 1.0 | 699 | $1,750 | $2.50 | 21d | 4 | 0.81mi |
| 1130 13th St Bellingham, WA | 1.0 | 1.0 | 631 | $1,700 | $2.69 | 21d | 1 | 0.87mi |
| 705 32nd St Bellingham, WA | 3.0 | 1.0–2.0 | 792 | $2,095 | $2.65 | 21d | 23 | 0.93mi |
| 1440 10th St Bellingham, WA | 2.0 | 1.0–2.0 | 761 | $2,565 | $3.37 | 13d | 5 | 0.95mi |
| 524 32nd St Bellingham, WA | 3.0 | 2.0 | 1100 | $2,480 | $2.25 | 21d | 3 | 1.04mi |
| 1002 11th St Bellingham, WA | 2.0 | 1.0 | 900 | $2,130 | $2.37 | 43d | 1 | 1.07mi |
| 487 31st St Bellingham, WA | 1.0–2.0 | 1.0 | 697 | $1,890 | $2.71 | 21d | 33 | 1.10mi |
| 490 S State St Bellingham, WA | 2.0 | 1.0 | 911 | $2,595 | $2.85 | 13d | 3 | 1.32mi |
| 230 32nd St Unit 250-106 (ADA) Bellingham, WA | 2.0 | 1.0 | 738 | $1,725 | $2.34 | 13d | 1 | 1.34mi |
| 3805 Elwood Ave Bellingham, WA | 4.0 | 1.0–2.5 | 1213 | $2,418 | $1.99 | 13d | 49 | 1.39mi |
| 222 S Forest St Bellingham, WA | 1.0 | 1.0 | 910 | $2,700 | $2.97 | 21d | 1 | 1.44mi |
Listing history 7 events
-
2026-06-18days on market $90,000 Active 7 DOM
-
2026-06-17days on market $90,000 Active 6 DOM
-
2026-06-16days on market $90,000 Active 5 DOM
-
2026-06-15days on market $90,000 Active 4 DOM
-
2026-06-14days on market $90,000 Active 2 DOM
-
2026-06-13remarks 693-char remark
-
2026-06-13$90,000 Active 1 DOM
ⓘ Source: listings_history table (triggers on properties + properties_extension) + one-shot
backfill from property_details.listing_events for pre-trigger history.
Tax reassessment forecast WA · Resets to sale price
- Current annual tax
- $499 · $42/mo
- Projected year-2 tax
- $882 · $74/mo
- Expected delta
- +$383/yr (+$32/mo · 76.8%)
ⓘ Screening estimate from a state-policy table — verify with the county assessor before closing.
Climate risk First Street
- Flood 4/10 Moderate FEMA zone X (unshaded) · 24% chance over 30 yrs
- Wildfire 2/10 Low
- Heat 3/10 Moderate 8 d/yr ≥83°F today · 20 d/yr by 30 yrs out
- Wind 1/10 Low
- Air quality 6/10 Major 9 unhealthy d/yr today · 10 by 30 yrs out
Nearby sold comps map
Loading sold comps map…
Walkable amenities ~0.75 mi
Loading nearby amenities…
Taxation est. · year 1
- Rental income
- $24,504
- − Mortgage interest
- −$5,041
- − Property taxes
- −$499
- − Insurance
- −$450
- − Repairs & maintenance
- −$1,960
- − Management
- −$1,960
- − Depreciation
- −$2,618
- Taxable income
- $11,975
- Est. tax owed @ 24.0%
- −$2,874
- After-tax cash flow
- $9,872/yr
For passive investors: Depreciation is non-cash, so a rental often shows a tax loss while cash-flowing — sheltering income. Rental losses are passive: they offset passive income freely, and up to $25,000/yr can offset ordinary (W-2) income if you actively participate and your MAGI is under $100k (phasing out to $0 by $150k); unused losses carry forward. On sale, claimed depreciation is recaptured at up to 25%, and gains may owe capital-gains tax (a 1031 exchange can defer both). Figures are a year-1 estimate at your 24.0% rate — not tax advice; consult a CPA.
Schools (NCES district)
- District
- Bellingham School District
- NCES district ID
- 5300420
- Math proficiency
- 47% ▼ -6.00%
- Reading proficiency
- 63% ▼ -1.00%
- Median HH income
- $47,678
- Composite
- 48.49/100
- National rank
- #4632
- State rank
- #106 of 291 in WA
Livability — Bellingham
- Score
- 80/100
- State rank
- #102
- US rank
- #1947
Category grades
Schools grade is shown separately in the Schools card above.
Census & demographics
- Census place
- Bellingham, WA
- County
- Whatcom County · 209,776 people
- City population
- 130,296
- Metro
- Bellingham, WA
- Population (ZIP)
- 50,216
- Household income
- $63,941
- Rent vs Own
- Severe rent burden
- 4351.0
Population outlook (Whatcom County) Hauer SSP2
- Today (2025)
- 240,408 people
- By 2030
- 254,667 · +5.9%
- By 2040
- 281,365 · +17.0%
- By 2050
- 307,592 · +27.9%
- By 2075
- 375,576 · +56.2%
- By 2100
- 421,637 · +75.4%
Race, ethnicity, and origin ACS 2023
- Neighborhood character
- Predominantly White (78%)
- Race & ethnicity
- White 78% Hispanic / Latino 10% Two or more races 9% Asian 4% Black 1%
- Hispanic origin (detail)
- Mexican 5%
- Common ancestry
- Italian 5% Portuguese 5% Slovak 4%
- Foreign-born
- 7% · Canada, China, Vietnam
- Languages at home
- 89% English-only · Spanish 6% Chinese 1% Other Indo-European 1%
Political lean MEDSL · Whatcom
- 2024 margin
- Strong D (+24.9) · D 60.8% · R 35.9% · Other 3.3%
- 2008→2024 swing
- +6.9pp toward D · 2008: 18.0pp · 2024: 24.9pp
- All cycles
- 2024: D+24.9 2020: D+23.9 2016: D+17.7 2012: D+12.1 2008: D+18.0
Not yet ingested
- Civics
- —
Market trends
- HPI YoY
- ▼ -1126.32%
- Current HPI
- 463.2721
- Rent YoY
- ▲ 2.67%
- Metro
- Bellingham, WA
- State GDP YoY
- ▲ 4.65%
- F500 in state
- 22
Industry mix (Fortune 500 HQ in WA)
| Industry | F500 HQs | Revenue |
|---|---|---|
| Retail | 2 | $269B |
|
||
| Technology / Retail | 1 | $638B |
|
||
| Technology | 1 | $245B |
|
||
| Telecommunications | 1 | $38B |
|
||
| Food / Beverage | 1 | $36B |
|
||
| Automotive / Trucks | 1 | $34B |
|
||
Price history
1 event — show timeline
- 2026-06-11 Listed $90,000 NWMLS as Distributed by MLS Grid
Property tax history
+16.6%/yrLatest (2026): $499 · +301.7% YoY. Source: county tax records.
Cash-flow waterfall
monthlySold comps — $/sqft
last 12 mo · ≤1 miLoading sold comps…