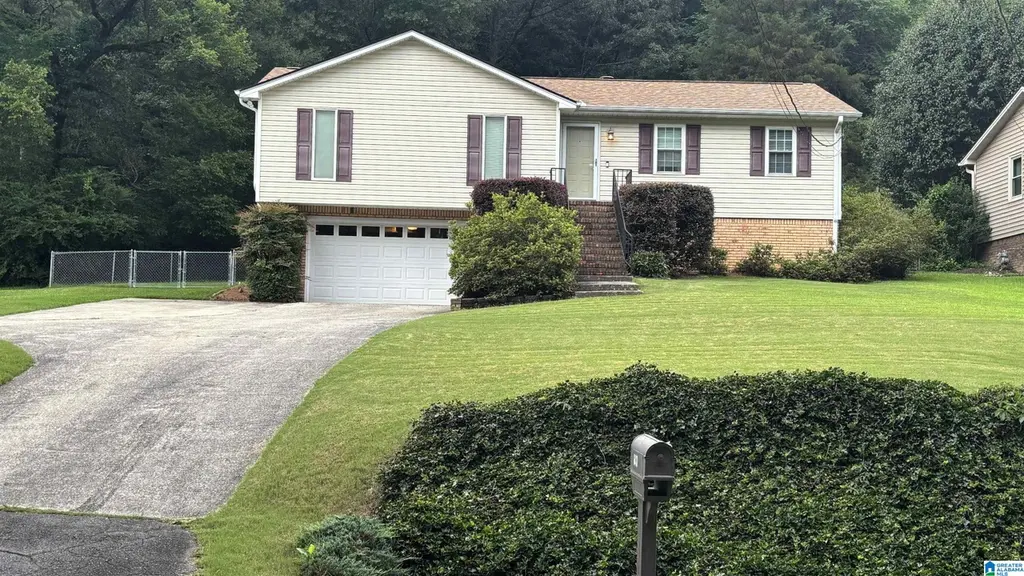
6431 Tyler Loop Rd · Pinson, AL
Flood risk 1/10 · Minimal
- FEMA flood zone
- X (unshaded)
- Chance of flooding over 30 yrs
- 0.0%
- Est. flood insurance / yr
- $473 – $860
Fire risk 4/10 · Minor
- Est. fire insurance / yr
- $916 – $1,700
Heat risk 6/10 · Moderate
- Hot days now (above 105°F)
- 7 days/yr
- Hot days in 30 yrs
- 19 days/yr
Wind risk 6/10 · Moderate
- Chance of severe wind over 30 yrs
- 27.0%
Air-quality risk 5/10 · Moderate
- Unhealthy air days now
- 6 days/yr
- Unhealthy air days in 30 yrs
- 11 days/yr
Risk factors via First Street. Map © Google.
Why this score? — see what drove the F grade
The composite is a weighted blend of 9 inputs, each scored 0–100. Each bar is that input's sub-score; the figure is the points it added to the 100-point composite (weight × sub-score).
- Cash flow +16.1/30.0
- DSCR +5.0/10.0
- 1% rule +3.2/10.0
- Livability +3.0/5.0
- Rent growth +2.9/5.0
- Condition / age +2.5/5.0
- Schools +1.8/10.0
- ARV discount +0.2/15.0
- Appreciation +0.0/10.0
$189,500
🖨 Deal sheet (PDF) 📄 Offer letter ✓ Due diligence
Listing remarks
This 3 bedroom/2 bath, beautifully maintained home in Pinson offers comfort, flexibility, and outdoor charm! This property features spacious living areas, a brand-new roof, and a bonus room with a closet that could easily serve as an additional bedroom. An extra flex room provides the perfect space for a home office, laundry room, or hobby area. The attached two-car garage includes an additional washer/dryer hookup for added convenience. Enjoy the beautifully manicured front and back yards, relax around the fire pit, and pick fresh berries from the established berry bush beside the home. Conveniently located near schools, shopping, dining, and major highways, this home combines peaceful liv
Key facts
- Manicured back yard
- Manicured front yard
- Brand new roof
Tags
Property features AI
Finance
- Financial info: Annual fire fee ($250); Monthly garbage fee ($19)
- HOA & community: No association fee
Exterior
- Parking: Attached front-entry garage; Two total garage spaces (2 in garage)
- Utilities: Public water; Connected sewer; Gas water heater; Internet service available
- Home design: One-side brick and vinyl siding exterior; Basement foundation; Existing home; Located in the Cedargate subdivision
- Construction: 1-side brick with vinyl siding
- Exterior features: Fenced yard; Open deck; Exterior grill
Interior
- Kitchen: Convection oven; Electric cooktop; Solid surface countertops
- Bedrooms: Master bedroom on upper level; Additional bedrooms on upper level
- Flooring: Carpet; Hardwood; Tile
- Bathrooms: Two full bathrooms; Separate shower and tub/shower combos; Linen closet
- Heating & cooling: Central heating; Central air conditioning
- Interior features: 9-ft+ ceilings with crown molding; Brick fireplace in the living room (gas); Solid surface kitchen countertops; Convection oven and electric cooktop in kitchen; Finished full basement with plumbing stubbed; Basement provides additional finished living space
- Laundry & utility: Laundry room in the basement; Washer hookup and electric dryer hookup; Utilities located in the garage
Neighborhood map
What this means for you Summary
Snapshot
- This is a 3-bed/2.0-bath single-family listed at $190k.
Deal economics
- At list price, monthly cash flow is $98 ($1k/yr) — positive.
- The deal already cash-flows at list — no discount required.
- To meet the 1% rule (rent ≥ 1% of price), the offer needs to be $155k (18.0% below list).
- Recommended offer: $155k (18.0% below list) — sets the bar for 1% rule.
- Cap rate 6.9% vs local median 5.6% in Pinson — meaningfully above typical; check what's discounted (condition, days-on-market, listing class) to confirm the premium yield is real.
Location & tenants
- Location reads 60/100 on livability (#289 in AL) — a middle-class / working-renter tenant base. Strengths: cost of living A+, housing A+, crime B+; Watch: amenities F, commute F, health & safety F.
- Jefferson County (suburban): math 9% / reading 32% proficiency, ranked #104 of 129 in AL (top 81%) — low school quality limits family demand, transient renter base, plan for 1-2y turnover.
- Zoned schools: Kermit Johnson School (math 12% / reading 32%, grade F, #442 of 627 statewide, top 72%, 606 students, 62% FRL); Rudd Middle School (math 0% / reading 26%, grade F, #214 of 257 statewide, top 83%, 667 students, 61% FRL); Pinson Valley High School (math 6% / reading 17%, grade F, #246 of 305 statewide, top 81%, 1,029 students, 81% FRL) — zoned schools average 68% FRL vs 49% district-wide (19 pts higher); higher-poverty schools than district average — tighter screening recommended.
- Market conditions: Rents rising (+1.6%/yr); 183 active listings in the ZIP; 13 comparable units currently listed for rent nearby; rentals at typical pace (median 18d on market — plan ~3-4 weeks tenant-placement turnaround); solid renter incomes; 2,114 units permitted in Jefferson County in 2024 (556 in 5+ unit buildings).
Forward outlook
- Local home prices are declining (-3.0%/yr); year-one equity from $1k of loan paydown is wiped out by about $6k of value loss. Plan a longer hold.
- Jefferson County population projected to shrink 4% by 2050 — rents likely to lag national; underwrite the cash flow, not the appreciation.
Negotiation context
- Only 5 days on market — expect competitive offers; lowballing is unlikely to land.
- Current owner paid $62k; list at $190k implies a 203% gain — meaningful room to come down on a strong offer.
Risks & watch-outs
- Climate carrying-cost: major wind risk, 27% chance of damaging wind over 30y; extreme-heat days projected 7→19/yr by 2055 (HVAC capex compounding) — expect insurance premiums to compound above CPI over the hold.
Questions for the listing agent
- Is there a deadline driving the sale (1031 exchange, divorce, estate, relocation)? That informs how much negotiation room exists.
- Schools are D-rated, which usually means shorter tenancies and higher turnover. Who's the typical renter profile here, and what's been the actual vacancy rate?
- The area grade is low — what's the realistic commute time and amenity access for the typical tenant pool here? Any planned neighborhood developments (good or bad) we should know about?
- What's the average days-on-market for RENTAL listings here right now (not sales)? A rising rental-DOM trend means longer vacancies and softer asking-rent achievability than the comps imply.
- What's the recent tenant-quality profile in this submarket — average credit score on applications, eviction rate, late-payment / NSF rate, and stable-employment percentage? A property-management company in the area should have these aggregated.
- How much new for-sale + rental construction is in the pipeline within 1–3 miles? Heavy new supply typically softens prices + rents 12–24 months out; constrained supply supports both.
Investment metrics
- 1% rule
- 0.82% ✗
- Cap rate
- 6.91%
- Cash-on-cash
- 2.21%
- DSCR
- 1.10
- GRM
- 10.2
CMA / ARV
- ARV (on-the-fly)
- $163,058
- Comps found
- 5
Show comp detail 5 sales within ~0.75 mi
| Address | Dist | Beds/Ba | Sqft | Sold | Price | $/sf | Match |
|---|---|---|---|---|---|---|---|
| 1117 Oak Creek Trl NE | 0.70mi | 3/2.0 | 1,226 (0%) | 11mo | $162,500 | $133 | 58 |
| 5559 Saddle Ridge Dr | 0.36mi | 3/2.0 | 1,400 (+14%) | 4mo | $220,000 | $157 | 57 |
| 5100 Willow Ridge Dr | 0.73mi | 3/2.0 | 1,290 (+5%) | 12mo | $150,000 | $116 | 47 |
| 4437 Silver Lake Rd | 0.74mi | 3/1.0 | 1,338 (+9%) | 5mo | $182,900 | $137 | 42 |
| 4489 Silver Lake Rd | 0.69mi | 3/2.0 | 1,408 (+15%) | 18mo | $174,900 | $124 | 28 |
Match score weights: distance 35% · size 25% · config 20% · recency 20%. Top-matched comps best support the ARV.
Projected returns pro-forma
-3.0% appreciation · 1.61% rent growth · sell at horizon
- IRR
- -14.2%
- Equity multiple
- 0.50×
- Total profit
- $-26,720
- Equity at exit
- $28,255
- IRR
- -7.6%
- Equity multiple
- 0.54×
- Total profit
- $-24,170
- Equity at exit
- $16,384
Cash invested: $53,060 (down + closing). Projections, not guarantees.
Landlord ↔ Tenant lean methodology
- Overall (STATE)
- 90 Strongly Landlord-Friendly
- State Alabama
- 90 Strongly Landlord-Friendly · R+15
- County
- — inherits STATE
- City
- — inherits STATE
ZIP-level market 35126
- Home prices YoY
- -22.4%
- Rents YoY
- 1.6%
- Active inventory
- 183
- Price-to-rent
- 10.2×
Monthly cashflow live
- Estimated rent
- $1,555 high interval (Pro) →
- Mortgage (P&I)
- −$994
- Tax from tax record
- −$58 /mo · $695/yr
- Insurance
- −$79
- HOA
- −$0
- Vacancy / Maint / Mgmt
- −$327
- Net cashflow
- $98
Break-even live
Sensitivity live
| Price | -10% $205 | -5% $151 | +0% $98 | +5% $44 | +10% $-10 |
|---|---|---|---|---|---|
| Rent | -10% $-25 | -5% $36 | +0% $98 | +5% $159 | +10% $220 |
| Rate | -1.0pp $193 | -0.5pp $146 | base $98 | +0.5pp $49 | +1.0pp $-1 |
UW: 25.0% down · 7.5% · 30yr · 1.5% tax · 5.0% vac · 8.0% maint · 8.0% mgmt
Financing live
Cash to close
- Down payment
- $47,375
- Closing costs
- $5,685
- Reserves months
- —
- Total cash needed
- —
Loan-product check · same deal, 3 products live
Conventional
25% down · 7.5% · 30yr
- Down + closing
- —
- Monthly P&I
- —
- Monthly cashflow
- —
- DSCR
- —
- Eligible?
- —
Personal DTI + credit; lowest rate.
DSCR
20% down · 8.5% · 30yr
- Down + closing
- —
- Monthly P&I
- —
- Monthly cashflow
- —
- DSCR
- —
- Eligible?
- —
No personal income docs; deal must DSCR.
Hard money
10% down · 12.0% · 12mo
- Down + closing
- —
- Monthly P&I
- —
- Monthly cashflow
- —
- DSCR
- —
- Eligible?
- —
Short-term bridge; refi at stabilization.
Rent comps 13 comps
| Address | Beds | Baths | Sqft | Rent | $/sqft | DOM | Units | Dist |
|---|---|---|---|---|---|---|---|---|
| 4246 Centerwood Dr Birmingham, AL | 3.0 | 2.0 | 1336 | $1,450 | $1.09 | 18d | 1 | 0.39mi |
| 1104 Oak Creek Trl NE Birmingham, AL | 3.0 | 2.0 | 1233 | $1,543 | $1.25 | 4d | 1 | 0.63mi |
| 5944 Tyler Loop Rd Pinson, AL | 3.0 | 2.0 | 1247 | $1,485 | $1.19 | 25d | 1 | 0.68mi |
| 4464 Winchester Hills Ln Pinson, AL | 3.0 | 2.0 | 1500 | $1,750 | $1.17 | 13d | 1 | 0.79mi |
| 4464 Winchester Hills Way Birmingham, AL | 3.0 | 2.0 | 1178 | $1,750 | $1.49 | 46d | 1 | 0.80mi |
| 5764 Desoto Dr Pinson, AL | 3.0 | 1.5 | 1104 | $1,225 | $1.11 | 4d | 1 | 0.86mi |
| 149 Martin Dr Birmingham, AL | 3.0 | 2.0 | 1164 | $1,485 | $1.28 | 25d | 1 | 0.94mi |
| 212 Saint John Dr NW Birmingham, AL | 2.0 | 2.0 | 1445 | $1,423 | $0.98 | 16d | 1 | 1.16mi |
| 3073 Panorama E Birmingham, AL | 1.0–3.0 | 1.0–2.0 | 975 | $1,275 | $1.31 | 3d | 20 | 1.25mi |
| 5992 Princess Blvd Birmingham, AL | 3.0 | 2.0 | 1454 | $1,661 | $1.14 | 46d | 1 | 1.30mi |
| 3309 Chase Ln Unit 3309 Birmingham, AL | 2.0 | 2.0 | 1068 | $1,000 | $0.94 | 46d | 1 | 1.32mi |
| 4205 Silver Lake Rd Unit 4205 Pinson, AL | 2.0 | 1.0 | 1210 | $1,200 | $0.99 | 16d | 1 | 1.40mi |
| 2708 7th St NE Center Point, AL | 3.0 | 1.0 | 1451 | $1,150 | $0.79 | 46d | 1 | 1.49mi |
Listing history 5 events
-
2026-06-22days on market $189,500 Active 5 DOM
-
2026-06-18days on market $189,500 Active 2 DOM
-
2026-06-16status $189,500 Active 1 DOM
-
2026-06-15remarks 699-char remark
-
2026-06-15$189,500 Coming Soon 1 DOM
ⓘ Source: listings_history table (triggers on properties + properties_extension) + one-shot
backfill from property_details.listing_events for pre-trigger history.
Tax reassessment forecast AL · Resets to sale price
- Current annual tax
- $695 · $58/mo
- Projected year-2 tax
- $777 · $65/mo
- Expected delta
- +$82/yr (+$7/mo · 11.8%)
ⓘ Screening estimate from a state-policy table — verify with the county assessor before closing.
Climate risk First Street
- Flood 1/10 Low FEMA zone X (unshaded) · 0% chance over 30 yrs
- Wildfire 4/10 Moderate
- Heat 6/10 Major 7 d/yr ≥105°F today · 19 d/yr by 30 yrs out
- Wind 6/10 Major 27% chance of damaging wind over 30 yrs
- Air quality 5/10 Major 6 unhealthy d/yr today · 11 by 30 yrs out
Nearby sold comps map
Loading sold comps map…
Walkable amenities ~0.75 mi
Loading nearby amenities…
Taxation est. · year 1
- Rental income
- $18,657
- − Mortgage interest
- −$10,615
- − Property taxes
- −$695
- − Insurance
- −$948
- − Repairs & maintenance
- −$1,493
- − Management
- −$1,493
- − Depreciation
- −$5,513
- Taxable loss
- −$2,098
- Est. tax savings @ 24.0%
- +$504
- After-tax cash flow
- $1,675/yr
For passive investors: Depreciation is non-cash, so a rental often shows a tax loss while cash-flowing — sheltering income. Rental losses are passive: they offset passive income freely, and up to $25,000/yr can offset ordinary (W-2) income if you actively participate and your MAGI is under $100k (phasing out to $0 by $150k); unused losses carry forward. On sale, claimed depreciation is recaptured at up to 25%, and gains may owe capital-gains tax (a 1031 exchange can defer both). Figures are a year-1 estimate at your 24.0% rate — not tax advice; consult a CPA.
Schools (NCES district)
- District
- Jefferson County
- NCES district ID
- 0101920
- Math proficiency
- 9% ▼ -24.00%
- Reading proficiency
- 32% ▼ -5.00%
- Median HH income
- $51,712
- Composite
- 18.4/100
- National rank
- #8937
- State rank
- #104 of 129 in AL
Livability — Pinson
- Score
- 60/100
- State rank
- #289
- US rank
- #18763
Category grades
Schools grade is shown separately in the Schools card above.
Census & demographics
- Census place
- Pinson, AL
- County
- Jefferson County · 527,445 people
- City population
- 22,599
- Metro
- Birmingham-Hoover, AL
- Population (ZIP)
- 22,599
- Household income
- $83,732
- Rent vs Own
- Severe rent burden
- 267.0
Population outlook (Jefferson County) Hauer SSP2
- Today (2025)
- 669,185 people
- By 2030
- 669,694 · +0.1%
- By 2040
- 661,388 · -1.2%
- By 2050
- 643,086 · -3.9%
- By 2075
- 577,267 · -13.7%
- By 2100
- 474,758 · -29.1%
Race, ethnicity, and origin ACS 2023
- Neighborhood character
- Diverse neighborhood (Simpson 0.58)
- Race & ethnicity
- White 58% Black 28% Hispanic / Latino 8% Two or more races 7% Asian 2%
- Hispanic origin (detail)
- Mexican 5% Puerto Rican 1%
- Common ancestry
- Slovak 2% Lithuanian 1% Italian 1%
- Foreign-born
- 5% · Canada, China, Jamaica
- Languages at home
- 92% English-only · Spanish 5% Vietnamese 1% Chinese 0%
Political lean MEDSL · Jefferson
- 2024 margin
- D (+10.4) · D 54.6% · R 44.2% · Other 1.2%
- 2008→2024 swing
- +5.4pp toward D · 2008: 5.1pp · 2024: 10.4pp
- All cycles
- 2024: D+10.4 2020: D+13.2 2016: D+7.2 2012: D+6.0 2008: D+5.1
Not yet ingested
- Civics
- —
Market trends
- HPI YoY
- ▼ -54.52%
- Current HPI
- 188.6439
- Rent YoY
- ▲ 1.61%
- Metro
- Birmingham-Hoover, AL
- State GDP YoY
- ▲ 2.94%
- F500 in state
- 4
Industry mix (Fortune 500 HQ in AL)
| Industry | F500 HQs | Revenue |
|---|---|---|
| Financial Services | 1 | $8B |
|
||
| Healthcare | 1 | $5B |
|
||
Price history
+264.4% since first listed3 events — show timeline
- 2026-06-14 Coming Soon $189,500 Greater Alabama MLS
- 1987-05-07 Sold (Public Records) $62,500 Public Records
- 1981-01-01 Sold (Public Records) $52,000 Public Records
Property tax history
+3.7%/yrLatest (2025): $695 · +0.0% YoY. Source: county tax records.
Cash-flow waterfall
monthlySold comps — $/sqft
last 12 mo · ≤1 miLoading sold comps…