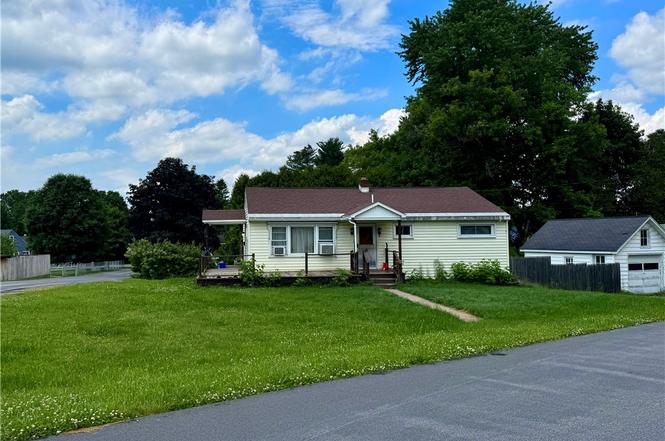
6 Alexandria Rd · New York Mills, NY
Flood risk 1/10 · Minimal
- FEMA flood zone
- X (unshaded)
- Chance of flooding over 30 yrs
- 0.0%
- Est. flood insurance / yr
- $473 – $860
Fire risk 1/10 · Minimal
- Est. fire insurance / yr
- $691 – $1,283
Heat risk 3/10 · Minor
- Hot days now (above 95°F)
- 7 days/yr
- Hot days in 30 yrs
- 17 days/yr
Wind risk 1/10 · Minimal
- Chance of severe wind over 30 yrs
- 1.0%
Air-quality risk 2/10 · Minimal
- Unhealthy air days now
- 0 days/yr
- Unhealthy air days in 30 yrs
- 2 days/yr
Risk factors via First Street. Map © Google.
Why this score? — see what drove the B grade
The composite is a weighted blend of 9 inputs, each scored 0–100. Each bar is that input's sub-score; the figure is the points it added to the 100-point composite (weight × sub-score).
- Cash flow +30.0/30.0
- 1% rule +10.0/10.0
- DSCR +10.0/10.0
- ARV discount +7.5/15.0
- Schools +6.1/10.0
- Livability +3.9/5.0
- Rent growth +2.5/5.0
- Condition / age +2.5/5.0
- Appreciation +0.0/10.0
$100,000
🖨 Deal sheet 📄 Offer letter ✓ Due diligence
Listing remarks MLS
LOVELY UPDATED RANCH. VINYL EXTERIOR, WRAPAROUND DECK, NEW FULL BATH PLUS VANITY SINK AREA, CERAMIC FLOOR CORIAN COUNTER, OAK CABINETS, PEDESTAL SINK, LOVELY HARDWOOD FLRS, BSMNT, REC. RM, OUTSIDE ENTRY TO BSMNT. CHNDLR GOES
Key facts
- 0.37 acre lot
- Garage
- Built 1951
Property features AI
Exterior
- Parking: Detached garage (1 car)
- Utilities: Public water connected; Sewer connected
- Home design: Single-story existing home
- Construction: Vinyl siding; Block foundation
- Exterior features: Blacktop driveway; Corner lot; Pie-shaped lot; Lot dimensions approximately 122 x 132
Interior
- Kitchen: Free-standing range; Oven; Refrigerator
- Bedrooms: Three main-level bedrooms
- Bathrooms: One full bathroom on the main level
- Heating & cooling: Gas forced-air heating
- Interior features: See remarks for additional interior details; Full basement
- Laundry & utility: Gas water heater
Neighborhood map
What this means for you Summary
Snapshot
- This is a 2-bed/1.0-bath single-family listed at $100k.
Deal economics
- At list price, monthly cash flow is $698 ($8k/yr) — positive.
- The deal already cash-flows at list — no discount required.
- Meets the 1% rule at list price ($2k rent vs $100k).
- Cap rate 14.7% vs local median 5.1% in New York Mills — top-decile yield for the area; either an underpriced asset or a hidden risk that comps aren't pricing in. Stress-test before assuming the spread holds.
Location & tenants
- Location reads 78/100 on livability (#175 in NY, #2,712 nationally) — a middle-class / working-renter tenant base. Strengths: health & safety A+, cost of living A, housing A; Watch: amenities F, commute F.
- New Hartford Central School District (suburban): math 65% / reading 76% proficiency, ranked #128 of 590 in NY (top 22%) — strong family-tenant draw, lease renewals of 3-5y typical; only 9% free/reduced lunch — higher-income household profile.
- Market conditions: 100 active listings in the ZIP; 5 comparable units currently listed for rent nearby; rentals lingering (median 44d on market — plan ~5-8 weeks vacancy on turnover, expect pricing pressure); 100% of comp listings sitting > 30 days — soft ceiling on asking rent; solid renter incomes; 204 units permitted in Oneida County in 2024 (68 in 5+ unit buildings).
Forward outlook
- Local home prices are declining (-3.0%/yr); year-one equity from $691 of loan paydown is wiped out by about $3k of value loss. Plan a longer hold.
- Oneida County population projected at -12% by 2050 — secular population decline; favor cash flow + early exit over multi-decade hold.
- At projected returns (-3.0% appreciation + 3.0% rent growth), your $28k cash investment doubles in ~5 years — after that, you're playing with house money.
Negotiation context
- Only 1 days on market — expect competitive offers; lowballing is unlikely to land.
- 2 sale attempts since 31y ago with the ask held roughly flat each time — persistent listings suggest the price (not the market) is what's stuck; bring a comps-based counter.
- Current owner paid $76k; 31% above their basis — modest negotiation headroom, anchor on the comps not their cost.
Risks & watch-outs
- Watch-outs: property tax is 3.7% of price; built in 1951 — expect roof / HVAC / electrical / plumbing capex.
Questions for the listing agent
- Built in 1951 — when were the roof, HVAC, electrical panel, plumbing, and water heater last replaced?
- Property tax is high relative to price — has the assessment been appealed recently, and will the sale trigger a re-assessment?
- Is there a deadline driving the sale (1031 exchange, divorce, estate, relocation)? That informs how much negotiation room exists.
- Schools are B-rated — typically a magnet for longer-tenancy family renters. What's the average tenant stay here, and is there a school-zone premium baked into asking?
- What's the average days-on-market for RENTAL listings here right now (not sales)? A rising rental-DOM trend means longer vacancies and softer asking-rent achievability than the comps imply.
- What's the recent tenant-quality profile in this submarket — average credit score on applications, eviction rate, late-payment / NSF rate, and stable-employment percentage? A property-management company in the area should have these aggregated.
- How much new for-sale + rental construction is in the pipeline within 1–3 miles? Heavy new supply typically softens prices + rents 12–24 months out; constrained supply supports both.
Investment metrics
- 1% rule
- 1.99% ✓
- Cap rate
- 14.67%
- Cash-on-cash
- 29.91%
- DSCR
- 2.33
- GRM
- 4.2
CMA / ARV
- ARV (on-the-fly)
- $212,940
- Comps found
- 12
Show comp detail 12 sales within ~0.75 mi
| Address | Dist | Beds/Ba | Sqft | Sold | Price | $/sf | Match |
|---|---|---|---|---|---|---|---|
| 20 Balsam Cres | 0.39mi | 2/1.0 | 1,071 (-2%) | 1mo | $195,000 | $182 | 78 |
| 1 Osborn Rd | 0.03mi | 3/1.0 (+1) | 1,071 (-2%) | 16mo | $189,000 | $176 | 77 |
| 21 Hara Cres | 0.06mi | 3/1.5 (+1) | 1,160 (+6%) | 4mo | $250,000 | $216 | 76 |
| 103 Merritt Pl | 0.31mi | 3/1.0 (+1) | 1,031 (-6%) | 1mo | $222,500 | $216 | 70 |
| 27 Allman Pl | 0.32mi | 3/1.0 (+1) | 1,080 (-1%) | 11mo | $210,500 | $195 | 69 |
| 6 Elmhurst Dr | 0.30mi | 3/1.0 (+1) | 976 (-11%) | 2mo | $218,000 | $223 | 62 |
| 7 Greatview Pl | 0.24mi | 2/1.0 | 1,216 (+11%) | 13mo | $255,000 | $210 | 59 |
| 81 Oakdale Ave S | 0.51mi | 3/2.0 (+1) | 1,139 (+4%) | 9mo | $210,000 | $184 | 52 |
| 10 Mapledale Rd | 0.47mi | 3/1.0 (+1) | 1,035 (-5%) | 18mo | $180,000 | $174 | 50 |
| 27 Arbor Dr | 0.56mi | 3/1.0 (+1) | 1,025 (-6%) | 11mo | $185,000 | $180 | 49 |
| 11 Pinecrest Rd | 0.58mi | 3/1.0 (+1) | 1,145 (+5%) | 16mo | $185,000 | $162 | 46 |
| 64 Merritt Pl | 0.27mi | 3/2.0 (+1) | 1,246 (+14%) | 11mo | $260,000 | $209 | 46 |
Match score weights: distance 35% · size 25% · config 20% · recency 20%. Top-matched comps best support the ARV.
Projected returns pro-forma
-3.0% appreciation · 3.0% rent growth · sell at horizon
- IRR
- 24.6%
- Equity multiple
- 2.01×
- Total profit
- $28,387
- Equity at exit
- $14,910
- IRR
- 32.4%
- Equity multiple
- 3.95×
- Total profit
- $82,529
- Equity at exit
- $8,646
Cash invested: $28,000 (down + closing). Projections, not guarantees.
Landlord ↔ Tenant lean methodology
- Overall (STATE)
- 15 Strongly Tenant-Friendly
- State New York
- 15 Strongly Tenant-Friendly · D+10
- County
- — inherits STATE
- City
- — inherits STATE
ZIP-level market 13413
- Active inventory
- 100
- Price-to-rent
- 4.2×
Monthly cashflow live
- Estimated rent
- $1,987 high interval (Pro) →
- Mortgage (P&I)
- −$524
- Tax from tax record
- −$306 /mo · $3,670/yr
- Insurance
- −$42
- HOA
- −$0
- Vacancy / Maint / Mgmt
- −$417
- Net cashflow
- $698
Break-even live
UW: 25.0% down · 7.5% · 30yr · 1.5% tax · 5.0% vac · 8.0% maint · 8.0% mgmt
Financing live
Cash to close
- Down payment
- $25,000
- Closing costs
- $3,000
- Reserves months
- —
- Total cash needed
- —
Loan-product check · same deal, 3 products live
Conventional
25% down · 7.5% · 30yr
- Down + closing
- —
- Monthly P&I
- —
- Monthly cashflow
- —
- DSCR
- —
- Eligible?
- —
Personal DTI + credit; lowest rate.
DSCR
20% down · 8.5% · 30yr
- Down + closing
- —
- Monthly P&I
- —
- Monthly cashflow
- —
- DSCR
- —
- Eligible?
- —
No personal income docs; deal must DSCR.
Hard money
10% down · 12.0% · 12mo
- Down + closing
- —
- Monthly P&I
- —
- Monthly cashflow
- —
- DSCR
- —
- Eligible?
- —
Short-term bridge; refi at stabilization.
Rent comps 5 comps
| Address | Beds | Baths | Sqft | Rent | $/sqft | DOM | Units | Dist |
|---|---|---|---|---|---|---|---|---|
| 167 Clinton Rd New Hartford, NY | 3.0 | 1.0–2.5 | 1063 | $2,433 | $2.29 | 43d | 15 | 1.01mi |
| 112 Copeland Ct Unit 520 New Hartford, NY | 1.0 | 1.0 | 800 | $1,700 | $2.12 | 43d | 1 | 1.06mi |
| 118 Copeland Ct Apt 205 New Hartford, NY | 2.0 | 2.0 | 1200 | $2,100 | $1.75 | 43d | 1 | 1.07mi |
| 77 Clinton St New York Mills, NY | 2.0 | 1.0 | 777 | $1,450 | $1.86 | 43d | 7 | 1.12mi |
| 4770 Middle Settlement Rd Whitesboro, NY | 1.0–2.0 | 1.0 | 725 | $2,085 | $2.88 | 43d | 1 | 1.19mi |
Listing history 1 events
-
2026-06-15$100,000 Pending 1 DOM
ⓘ Source: listings_history table (triggers on properties + properties_extension) + one-shot
backfill from property_details.listing_events for pre-trigger history.
Tax reassessment forecast NY · Partial reset (capped growth)
- Current annual tax
- $3,670 · $306/mo
- Projected year-2 tax
- $3,670 · $306/mo
- Expected delta
- $0/yr ($0/mo · 0.0%)
ⓘ Screening estimate from a state-policy table — verify with the county assessor before closing.
Climate risk First Street
- Flood 1/10 Low FEMA zone X (unshaded) · 0% chance over 30 yrs
- Wildfire 1/10 Low
- Heat 3/10 Moderate 7 d/yr ≥95°F today · 17 d/yr by 30 yrs out
- Wind 1/10 Low 100% chance of damaging wind over 30 yrs
- Air quality 2/10 Low 0 unhealthy d/yr today · 2 by 30 yrs out
Nearby sold comps map
Loading sold comps map…
Walkable amenities ~0.75 mi
Loading nearby amenities…
Taxation est. · year 1
- Rental income
- $23,846
- − Mortgage interest
- −$5,602
- − Property taxes
- −$3,670
- − Insurance
- −$500
- − Repairs & maintenance
- −$1,908
- − Management
- −$1,908
- − Depreciation
- −$2,909
- Taxable income
- $7,349
- Est. tax owed @ 24.0%
- −$1,764
- After-tax cash flow
- $6,611/yr
For passive investors: Depreciation is non-cash, so a rental often shows a tax loss while cash-flowing — sheltering income. Rental losses are passive: they offset passive income freely, and up to $25,000/yr can offset ordinary (W-2) income if you actively participate and your MAGI is under $100k (phasing out to $0 by $150k); unused losses carry forward. On sale, claimed depreciation is recaptured at up to 25%, and gains may owe capital-gains tax (a 1031 exchange can defer both). Figures are a year-1 estimate at your 24.0% rate — not tax advice; consult a CPA.
Schools (NCES district)
- District
- New Hartford Central School District
- NCES district ID
- 3620370
- Math proficiency
- 65% ▼ -7.00%
- Reading proficiency
- 76% ▲ 5.00%
- Median HH income
- $67,028
- Composite
- 61.37/100
- National rank
- #769
- State rank
- #128 of 590 in NY
Livability — New York Mills
- Score
- 78/100
- State rank
- #175
- US rank
- #2712
Category grades
Schools grade is shown separately in the Schools card above.
Census & demographics
- County
- Oneida County · 89,710 people
- City population
- 3,012
- Metro
- Utica-Rome, NY
- Population (ZIP)
- 16,742
- Household income
- $95,261
- Rent vs Own
- Severe rent burden
- 395.0
Population outlook (Oneida County) Hauer SSP2
- Today (2025)
- 225,223 people
- By 2030
- 220,384 · -2.1%
- By 2040
- 209,071 · -7.2%
- By 2050
- 197,920 · -12.1%
- By 2075
- 175,541 · -22.1%
- By 2100
- 148,491 · -34.1%
Race, ethnicity, and origin ACS 2023
- Neighborhood character
- Predominantly White (88%)
- Race & ethnicity
- White 88% Asian 4% Hispanic / Latino 3% Two or more races 3%
- Common ancestry
- Romanian 8% Lithuanian 4% Subsaharan African 3%
- Foreign-born
- 11% · Vietnam, China, Canada
- Languages at home
- 86% English-only · Other Indo-European 4% Other Asian/Pacific 3% Russian/Polish/Slavic 2%
Political lean MEDSL · Oneida
- 2024 margin
- Strong R (+21.3) · D 39.4% · R 60.6%
- 2008→2024 swing
- -15.2pp toward R · 2008: -6.1pp · 2024: -21.3pp
- All cycles
- 2024: R+21.3 2020: R+15.5 2016: R+21.1 2012: R+5.3 2008: R+6.1
Not yet ingested
- Civics
- —
Market trends
- HPI YoY
- ▼ -210.17%
- Current HPI
- 295.4235
- Rent YoY
- —
- Metro
- Utica-Rome, NY
- State GDP YoY
- ▲ 2.60%
- F500 in state
- 92
Industry mix (Fortune 500 HQ in NY)
| Industry | F500 HQs | Revenue |
|---|---|---|
| Financial Services | 10 | $950B |
|
||
| Consumer Goods | 9 | $162B |
|
||
| Insurance | 4 | $225B |
|
||
| Telecommunications | 2 | $144B |
|
||
| Pharmaceuticals | 2 | $112B |
|
||
| Media / Entertainment | 2 | $69B |
|
||
Price history
+33.5% since first listed6 events — show timeline
- 2026-06-15 Pending — CNYIS
- 2026-06-12 Listed $100,000 CNYIS
- 1997-07-10 Sold (Public Records) $76,500 Public Records
- 1996-01-22 Sold (Public Records) $72,500 Public Records
- 1996-01-22 Sold (MLS) $72,500 CNYIS
- 1995-09-25 Listed $74,900 CNYIS
Property tax history
+4.4%/yrLatest (2025): $3,670 · +3.4% YoY. Source: county tax records.
Cash-flow waterfall
monthlySold comps — $/sqft
last 12 mo · ≤1 miLoading sold comps…