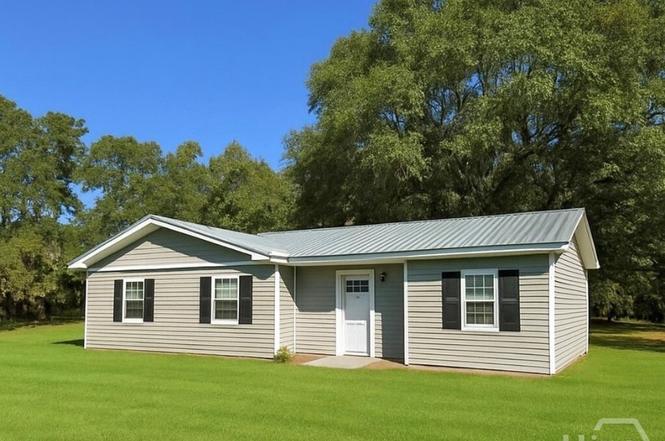
996 Dunlevie Rd · Walthourville, GA
Flood risk 1/10 · Minimal
- FEMA flood zone
- X (unshaded)
- Chance of flooding over 30 yrs
- 0.0%
- Est. flood insurance / yr
- $507 – $1,088
Fire risk 6/10 · Moderate
- Est. fire insurance / yr
- $963 – $1,789
Heat risk 9/10 · Severe
- Hot days now (above 110°F)
- 7 days/yr
- Hot days in 30 yrs
- 18 days/yr
Wind risk 8/10 · Major
- Chance of severe wind over 30 yrs
- 98.0%
Air-quality risk 2/10 · Minimal
- Unhealthy air days now
- 2 days/yr
- Unhealthy air days in 30 yrs
- 2 days/yr
Risk factors via First Street. Map © Google.
Why this score? — see what drove the D+ grade
The composite is a weighted blend of 9 inputs, each scored 0–100. Each bar is that input's sub-score; the figure is the points it added to the 100-point composite (weight × sub-score).
- Cash flow +14.5/30.0
- ARV discount +11.5/15.0
- DSCR +4.4/10.0
- Rent growth +3.9/5.0
- 1% rule +3.6/10.0
- Livability +3.2/5.0
- Condition / age +2.5/5.0
- Schools +2.0/10.0
- Appreciation +0.0/10.0
$225,000
🖨 Deal sheet (PDF) 📄 Offer letter ✓ Due diligence
Listing remarks
: 1 + ACRES WILL GO VA AND FHA ! Don’t miss out on this Charming NEW 4 bedroom / 2-bathroom home that HAS IT ALL!!! Open and inviting floor plan, elegant white cabinetry, upgraded lighting fixtures and recessed lighting. Complete modern home essentials with a comfortable layout. Double vanity in master bathroom with a tub/shower. Brand new appliances! VISIT the property today. Seller is a licensed Realtor in GA. Exterior photos enhanced for lawn purposes. Homes qualify for FHA and VA loans with a permanent foundation.
Key facts
- 1 acre lot
- Built 1976
- Listed 113 days
Neighborhood map
What this means for you Summary
Snapshot
- This is a 3-bed/2.0-bath single-family listed at $225k.
Deal economics
- At list price, monthly cash flow is $48 ($572/yr) — positive.
- The deal already cash-flows at list — no discount required.
- To meet the 1% rule (rent ≥ 1% of price), the offer needs to be $193k (14.3% below list).
- Recommended offer: $193k (14.3% below list) — sets the bar for 1% rule.
- Cap rate 6.5% vs local median 5.4% in Walthourville — meaningfully above typical; check what's discounted (condition, days-on-market, listing class) to confirm the premium yield is real.
Location & tenants
- Location reads 64/100 on livability (#255 in GA) — a middle-class / working-renter tenant base. Strengths: cost of living A+, housing A+, crime B; Watch: employment D, schools F, amenities F.
- Liberty County (urban): math 19% / reading 28% proficiency, ranked #133 of 174 in GA (top 76%) — low school quality limits family demand, transient renter base, plan for 1-2y turnover.
- Market conditions: Rents rising fast (+5.4%/yr); 639 active listings in the ZIP; 6 comparable units currently listed for rent nearby; rentals lingering (median 46d on market — plan ~5-8 weeks vacancy on turnover, expect pricing pressure); 100% of comp listings sitting > 30 days — soft ceiling on asking rent; 471 units permitted in Liberty County in 2024 (0 in 5+ unit buildings).
- This rent runs 38% of the median local income ($60k/yr) — at the standard rent-burdened threshold; future hikes will face affordability resistance.
Forward outlook
- Local home prices are declining (-3.0%/yr); year-one equity from $2k of loan paydown is wiped out by about $7k of value loss. Plan a longer hold.
- Liberty County population projected to shrink 8% by 2050 — rents likely to lag national; underwrite the cash flow, not the appreciation.
Negotiation context
- It's been on market 113 days — a 9% lower offer ($205k) is reasonable based on typical stale-listing flexibility.
Risks & watch-outs
- Climate carrying-cost: severe wind risk, 98% chance of damaging wind over 30y; major wildfire risk; extreme-heat days projected 7→18/yr by 2055 (HVAC capex compounding) — expect insurance premiums to compound above CPI over the hold.
Questions for the listing agent
- It's been on market 113 days. Have you received any prior offers? Is the seller open to a 14% concession, seller financing, or rate buy-down credit?
- Built in 1976 — when were the roof, HVAC, electrical panel, plumbing, and water heater last replaced?
- Why hasn't it sold? Are there any deal-killer items the seller is aware of (foundation, flood, title, zoning, code violations)?
- Is there a deadline driving the sale (1031 exchange, divorce, estate, relocation)? That informs how much negotiation room exists.
- Schools are F-rated, which usually means shorter tenancies and higher turnover. Who's the typical renter profile here, and what's been the actual vacancy rate?
- The area grade is low — what's the realistic commute time and amenity access for the typical tenant pool here? Any planned neighborhood developments (good or bad) we should know about?
- What's the average days-on-market for RENTAL listings here right now (not sales)? A rising rental-DOM trend means longer vacancies and softer asking-rent achievability than the comps imply.
- What's the recent tenant-quality profile in this submarket — average credit score on applications, eviction rate, late-payment / NSF rate, and stable-employment percentage? A property-management company in the area should have these aggregated.
- How much new for-sale + rental construction is in the pipeline within 1–3 miles? Heavy new supply typically softens prices + rents 12–24 months out; constrained supply supports both.
Investment metrics
- 1% rule
- 0.86% ✗
- Cap rate
- 6.55%
- Cash-on-cash
- 0.91%
- DSCR
- 1.04
- GRM
- 9.7
CMA / ARV
- ARV (on-the-fly)
- $247,100
- Comps found
- 11
Show comp detail 11 sales within ~0.75 mi
| Address | Dist | Beds/Ba | Sqft | Sold | Price | $/sf | Match |
|---|---|---|---|---|---|---|---|
| 996 Dunlevie Rd | 0.00mi | 3/2.0 | 1,412 (0%) | 2mo | $22,500 | $16 | 98 |
| 99 Douglas Rd | 0.14mi | 3/2.0 | 1,415 (+0%) | 13mo | $257,000 | $182 | 82 |
| 77 Tyson Ln Ln | 0.24mi | 3/2.0 | 1,400 (-1%) | 15mo | $245,000 | $175 | 75 |
| 744 Dunlevie Rd | 0.25mi | 3/2.0 | 1,335 (-6%) | 7mo | $326,610 | $245 | 74 |
| 122 Tyson Ln | 0.29mi | 3/2.5 | 1,456 (+3%) | 10mo | $259,900 | $179 | 71 |
| 138 Mccumber Dr | 0.24mi | 3/2.0 | 1,456 (+3%) | 15mo | $220,000 | $151 | 71 |
| 30 Jessica Ct | 0.35mi | 3/2.0 | 1,439 (+2%) | 19mo | $225,000 | $156 | 65 |
| 499 Mccumber Dr | 0.58mi | 3/2.0 | 1,386 (-2%) | 17mo | $232,500 | $168 | 56 |
| 95 Tempest Ln | 0.62mi | 3/2.0 | 1,273 (-10%) | 2mo | $207,500 | $163 | 52 |
| 184 Fawn Ct SE | 0.65mi | 3/2.0 | 1,527 (+8%) | 12mo | $282,595 | $185 | 46 |
| 320 Mccumber Dr | 0.40mi | 3/2.0 | 1,214 (-14%) | 16mo | $212,000 | $175 | 44 |
Match score weights: distance 35% · size 25% · config 20% · recency 20%. Top-matched comps best support the ARV.
Projected returns pro-forma
-3.0% appreciation · 5.41% rent growth · sell at horizon
- IRR
- -12.3%
- Equity multiple
- 0.55×
- Total profit
- $-28,655
- Equity at exit
- $33,548
- IRR
- -0.1%
- Equity multiple
- 0.99×
- Total profit
- $-474
- Equity at exit
- $19,454
Cash invested: $63,000 (down + closing). Projections, not guarantees.
Landlord ↔ Tenant lean methodology
- Overall (STATE)
- 90 Strongly Landlord-Friendly
- State Georgia
- 90 Strongly Landlord-Friendly · R+3
- County
- — inherits STATE
- City
- — inherits STATE
ZIP-level market 31313
- Home prices YoY
- -27.1%
- Rents YoY
- 5.4%
- Active inventory
- 639
- Price-to-rent
- 9.7×
Monthly cashflow live
- Estimated rent
- $1,929 high interval (Pro) →
- Mortgage (P&I)
- −$1,180
- Tax from tax record
- −$203 /mo · $2,432/yr
- Insurance
- −$94
- HOA
- −$0
- Vacancy / Maint / Mgmt
- −$405
- Net cashflow
- $48
Break-even live
Sensitivity live
| Price | -10% $175 | -5% $111 | +0% $48 | +5% $-16 | +10% $-80 |
|---|---|---|---|---|---|
| Rent | -10% $-105 | -5% $-29 | +0% $48 | +5% $124 | +10% $200 |
| Rate | -1.0pp $161 | -0.5pp $105 | base $48 | +0.5pp $-11 | +1.0pp $-70 |
UW: 25.0% down · 7.5% · 30yr · 1.5% tax · 5.0% vac · 8.0% maint · 8.0% mgmt
Financing live
Cash to close
- Down payment
- $56,250
- Closing costs
- $6,750
- Reserves months
- —
- Total cash needed
- —
Loan-product check · same deal, 3 products live
Conventional
25% down · 7.5% · 30yr
- Down + closing
- —
- Monthly P&I
- —
- Monthly cashflow
- —
- DSCR
- —
- Eligible?
- —
Personal DTI + credit; lowest rate.
DSCR
20% down · 8.5% · 30yr
- Down + closing
- —
- Monthly P&I
- —
- Monthly cashflow
- —
- DSCR
- —
- Eligible?
- —
No personal income docs; deal must DSCR.
Hard money
10% down · 12.0% · 12mo
- Down + closing
- —
- Monthly P&I
- —
- Monthly cashflow
- —
- DSCR
- —
- Eligible?
- —
Short-term bridge; refi at stabilization.
Rent comps 6 comps
| Address | Beds | Baths | Sqft | Rent | $/sqft | DOM | Units | Dist |
|---|---|---|---|---|---|---|---|---|
| 42 Jessica Ct Allenhurst, GA | 4.0 | 2.0 | 1607 | $1,800 | $1.12 | 45d | 1 | 0.36mi |
| 110 Tempest Ln Allenhurst, GA | 3.0 | 2.0 | 1668 | $1,850 | $1.11 | 45d | 1 | 0.62mi |
| 373 Carter Rd Unit A Allenhurst, GA | 3.0 | 2.0 | 1196 | $1,900 | $1.59 | 45d | 1 | 0.99mi |
| 82 Crosby Dr Hinesville, GA | 3.0 | 2.0 | 1087 | $1,649 | $1.52 | 45d | 1 | 1.38mi |
| 23 Belleau Woods Cir Hinesville, GA | 3.0 | 2.5 | 1444 | $1,975 | $1.37 | 45d | 1 | 1.46mi |
| 149 Becky St Hinesville, GA | 3.0 | 2.0 | 1145 | $1,800 | $1.57 | 45d | 1 | 1.50mi |
Listing history 38 events
-
2026-04-27soldstatus $225,000
-
2026-04-03status Pending
-
2026-03-14price $219,984
-
2026-03-13price $219,985
-
2026-03-11price $219,986
-
2026-03-10price $219,987
-
2026-03-09price $219,988
-
2026-03-07price $219,989
-
2026-03-04price $219,991
-
2026-02-27price $219,993
-
2026-02-26price $219,996
-
2026-02-26price $219,997
-
2026-02-22price $219,998
-
2026-02-06price $224,998
-
2026-02-04price $225,000
-
2026-02-04price $225,000
-
2026-01-31price $250,000
-
2026-01-27price $219,998
-
2026-01-09price $229,998
-
2026-01-09price $229,998
-
2025-12-31price $239,985
-
2025-12-30price $239,985
-
2025-12-25price $239,986
-
2025-12-20price $239,987
-
2025-12-16price $239,988
-
2025-12-16price $239,988
-
2025-12-12price $239,989
-
2025-12-12price $239,989
-
2025-12-06price $239,993
-
2025-11-28price $239,997
-
2025-11-27price $239,998
-
2025-11-26price $249,995
-
2025-11-22price $249,997
-
2025-11-21price $249,998
-
2025-11-18price $249,999
-
2025-11-17$239,993 Active
-
2025-11-17price $250,000
-
2012-10-29soldstatus $70,000
ⓘ Source: listings_history table (triggers on properties + properties_extension) + one-shot
backfill from property_details.listing_events for pre-trigger history.
Tax reassessment forecast GA · Resets to sale price
- Current annual tax
- $2,432 · $203/mo
- Projected year-2 tax
- $2,432 · $203/mo
- Expected delta
- $0/yr ($0/mo · 0.0%)
ⓘ Screening estimate from a state-policy table — verify with the county assessor before closing.
Climate risk First Street
- Flood 1/10 Low FEMA zone X (unshaded) · 0% chance over 30 yrs
- Wildfire 6/10 Major
- Heat 9/10 Extreme 7 d/yr ≥110°F today · 18 d/yr by 30 yrs out
- Wind 8/10 Severe 98% chance of damaging wind over 30 yrs
- Air quality 2/10 Low 2 unhealthy d/yr today · 2 by 30 yrs out
Nearby sold comps map
Loading sold comps map…
Walkable amenities ~0.75 mi
Loading nearby amenities…
Taxation est. · year 1
- Rental income
- $23,148
- − Mortgage interest
- −$12,603
- − Property taxes
- −$2,432
- − Insurance
- −$1,125
- − Repairs & maintenance
- −$1,852
- − Management
- −$1,852
- − Depreciation
- −$6,545
- Taxable loss
- −$3,261
- Est. tax savings @ 24.0%
- +$783
- After-tax cash flow
- $1,354/yr
For passive investors: Depreciation is non-cash, so a rental often shows a tax loss while cash-flowing — sheltering income. Rental losses are passive: they offset passive income freely, and up to $25,000/yr can offset ordinary (W-2) income if you actively participate and your MAGI is under $100k (phasing out to $0 by $150k); unused losses carry forward. On sale, claimed depreciation is recaptured at up to 25%, and gains may owe capital-gains tax (a 1031 exchange can defer both). Figures are a year-1 estimate at your 24.0% rate — not tax advice; consult a CPA.
Schools (NCES district)
- District
- Liberty County
- NCES district ID
- 1303300
- Math proficiency
- 19% ▼ -16.00%
- Reading proficiency
- 28% ▼ -13.00%
- Median HH income
- $43,911
- Composite
- 20.2/100
- National rank
- #8630
- State rank
- #133 of 174 in GA
Livability — Walthourville
- Score
- 64/100
- State rank
- #255
- US rank
- #14108
Category grades
Schools grade is shown separately in the Schools card above.
Census & demographics
- County
- Liberty County · 58,565 people
- City population
- 42,838
- Metro
- Hinesville, GA
- Population (ZIP)
- 42,838
- Household income
- $60,233
- Rent vs Own
- Severe rent burden
- 1693.0
Population outlook (Liberty County) Hauer SSP2
- Today (2025)
- 58,689 people
- By 2030
- 57,670 · -1.7%
- By 2040
- 55,750 · -5.0%
- By 2050
- 54,155 · -7.7%
- By 2075
- 58,947 · +0.4%
- By 2100
- 66,919 · +14.0%
Race, ethnicity, and origin ACS 2023
- Neighborhood character
- Diverse neighborhood (Simpson 0.67)
- Race & ethnicity
- Black 47% White 31% Hispanic / Latino 13% Two or more races 11% Asian 2%
- Hispanic origin (detail)
- Mexican 4% Puerto Rican 7%
- Common ancestry
- Slovak 1% Italian 1% Lithuanian 1%
- Foreign-born
- 7% · Canada, South Korea
- Languages at home
- 86% English-only · Spanish 7% Other Indo-European 2% German/W. Germanic 1%
Political lean MEDSL · Liberty
- 2024 margin
- D (+17.4) · D 58.5% · R 41.0%
- 2008→2024 swing
- -10.9pp toward R · 2008: 28.4pp · 2024: 17.4pp
- All cycles
- 2024: D+17.4 2020: D+24.1 2016: D+21.2 2012: D+30.2 2008: D+28.4
Not yet ingested
- Civics
- —
Market trends
- HPI YoY
- ▼ -77.50%
- Current HPI
- 208.0927
- Rent YoY
- ▲ 5.41%
- Metro
- Hinesville, GA
- State GDP YoY
- ▲ 2.66%
- F500 in state
- 28
Industry mix (Fortune 500 HQ in GA)
| Industry | F500 HQs | Revenue |
|---|---|---|
| Paper / Packaging | 2 | $29B |
|
||
| Retail | 1 | $160B |
|
||
| Transportation / Logistics | 1 | $91B |
|
||
| Airlines | 1 | $62B |
|
||
| Consumer Goods | 1 | $47B |
|
||
| Utilities | 1 | $25B |
|
||
Price history
+221.4% since first listed38 events — show timeline
- 2026-04-27 Sold (Public Records) $225,000 Public Records
- 2026-04-03 Pending — Hive MLS
- 2026-03-14 Price Changed $219,984 HABR
- 2026-03-13 Price Changed $219,985 HABR
- 2026-03-11 Price Changed $219,986 HABR
- 2026-03-10 Price Changed $219,987 HABR
- 2026-03-09 Price Changed $219,988 HABR
- 2026-03-07 Price Changed $219,989 HABR
- 2026-03-04 Price Changed $219,991 HABR
- 2026-02-27 Price Changed $219,993 HABR
- 2026-02-26 Price Changed $219,996 HABR
- 2026-02-26 Price Changed $219,997 HABR
- 2026-02-22 Price Changed $219,998 HABR
- 2026-02-06 Price Changed $224,998 HABR
- 2026-02-04 Price Changed $225,000 Hive MLS
- 2026-02-04 Price Changed $225,000 HABR
- 2026-01-31 Price Changed $250,000 Hive MLS
- 2026-01-27 Price Changed $219,998 HABR
- 2026-01-09 Price Changed $229,998 HABR
- 2026-01-09 Price Changed $229,998 Hive MLS
- 2025-12-31 Price Changed $239,985 HABR
- 2025-12-30 Price Changed $239,985 Hive MLS
- 2025-12-25 Price Changed $239,986 HABR
- 2025-12-20 Price Changed $239,987 HABR
- 2025-12-16 Price Changed $239,988 HABR
- 2025-12-16 Price Changed $239,988 Hive MLS
- 2025-12-12 Price Changed $239,989 HABR
- 2025-12-12 Price Changed $239,989 Hive MLS
- 2025-12-06 Price Changed $239,993 HABR
- 2025-11-28 Price Changed $239,997 HABR
- 2025-11-27 Price Changed $239,998 HABR
- 2025-11-26 Price Changed $249,995 HABR
- 2025-11-22 Price Changed $249,997 HABR
- 2025-11-21 Price Changed $249,998 HABR
- 2025-11-18 Price Changed $249,999 HABR
- 2025-11-17 Listed $239,993 Hive MLS
- 2025-11-17 Price Changed $250,000 HABR
- 2012-10-29 Sold (Public Records) $70,000 Public Records
Property tax history
+8.1%/yrLatest (2025): $2,432 · +58.9% YoY. Source: county tax records.
Cash-flow waterfall
monthlySold comps — $/sqft
last 12 mo · ≤1 miLoading sold comps…