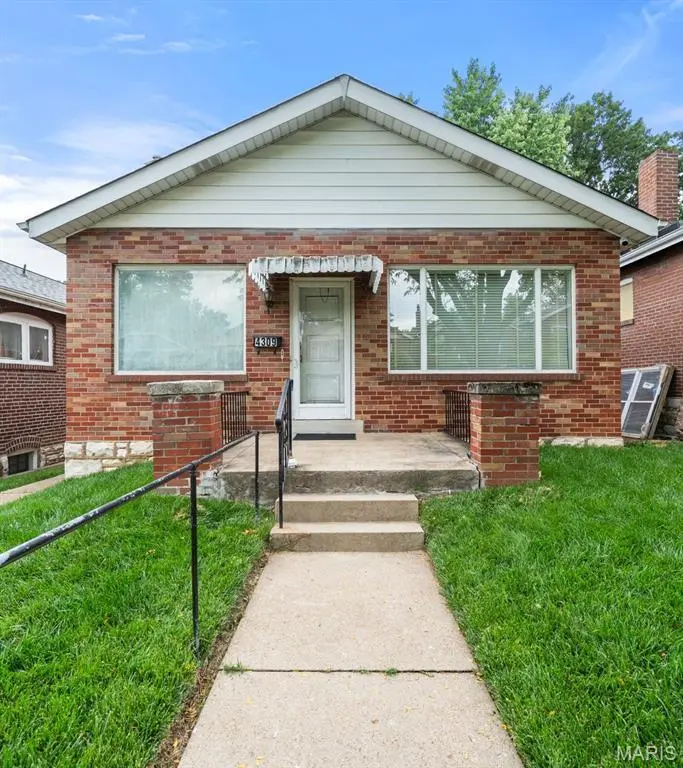
4309 Dewey Ave · St. Louis, MO
Flood risk 1/10 · Minimal
- FEMA flood zone
- X (unshaded)
- Chance of flooding over 30 yrs
- 0.0%
- Est. flood insurance / yr
- $473 – $860
Fire risk 1/10 · Minimal
- Est. fire insurance / yr
- $1,054 – $1,958
Heat risk 5/10 · Moderate
- Hot days now (above 108°F)
- 7 days/yr
- Hot days in 30 yrs
- 21 days/yr
Wind risk 2/10 · Minimal
- Chance of severe wind over 30 yrs
- 1.0%
Air-quality risk 3/10 · Minor
- Unhealthy air days now
- 3 days/yr
- Unhealthy air days in 30 yrs
- 4 days/yr
Risk factors via First Street. Map © Google.
Why this score? — see what drove the B- grade
The composite is a weighted blend of 9 inputs, each scored 0–100. Each bar is that input's sub-score; the figure is the points it added to the 100-point composite (weight × sub-score).
- Cash flow +25.7/30.0
- ARV discount +15.0/15.0
- DSCR +8.6/10.0
- 1% rule +6.8/10.0
- Rent growth +3.2/5.0
- Livability +2.5/5.0
- Condition / age +2.5/5.0
- Schools +1.2/10.0
- Appreciation +0.0/10.0
$85,000
🖨 Deal sheet 📄 Offer letter ✓ Due diligence
Listing remarks
This classic South City charmer is just waiting for your tender loving care. You'll find everyday comfort in this all-brick bungalow tucked along a tree-lined street in the heart of St. Louis City. From the moment you arrive, the welcoming front porch and timeless brick exterior set the tone for a home filled with character and warmth. Inside, you’ll find a spacious living room with hardwood floors and tall ceilings, and a layout that flows effortlessly into the eat-in kitchen and easy access to the enclosed sunroom. Two bedrooms provide comfortable living space, while the full bath maintains the home’s classic bungalow charm. Original details throughout give the home personalit
Key facts
- Enclosed sunroom
- Level backyard
- All brick bungalow
Tags
Property features AI
Finance
- Financial info: Lease not considered
Exterior
- Parking: Detached garage (1-car)
- Utilities: Public water; Public sewer; Electric service (Ameren); Electricity available; Natural gas available; Water available; Sewer available
- Home design: Single-family residence; One level
- Construction: Brick, stone, and vinyl siding exterior; Shingle roof
- Exterior features: Patio; Porch; Level lot
Interior
- Kitchen: Free-standing gas oven; Free-standing gas range
- Bedrooms: Two bedrooms on the main level
- Flooring: Carpet; Laminate; Wood
- Bathrooms: One full bathroom on the main level
- Heating & cooling: Forced air heating; Central air conditioning
- Interior features: Free-standing gas oven; Free-standing gas range; Carpet, laminate, and wood flooring; Concrete basement with walk-out access
- Laundry & utility: Laundry located in the basement
Neighborhood map
What this means for you Summary
Snapshot
- This is a 2-bed/1.0-bath single-family listed at $85k.
Deal economics
- At list price, monthly cash flow is $203 ($2k/yr) — positive.
- The deal already cash-flows at list — no discount required.
- Meets the 1% rule at list price ($1k rent vs $85k).
- Cap rate 9.2% vs local median 5.0% in St. Louis — top-decile yield for the area; either an underpriced asset or a hidden risk that comps aren't pricing in. Stress-test before assuming the spread holds.
Location & tenants
- Location reads: area grade B — affects rentability + tenant quality, not the cash-flow math above.
- St. Louis City (urban): math 10% / reading 18% proficiency, ranked #312 of 324 in MO (top 96%) — low school quality limits family demand, transient renter base, plan for 1-2y turnover; 80% free/reduced lunch — lower-income household profile, screen leases tightly.
- Zoned schools: Woodward Elem. (math 2% / reading 8%, grade F, #1,072 of 1,115 statewide, top 98%, 239 students, 99% FRL); Roosevelt High (math 2% / reading 8%, grade F, #517 of 521 statewide, top 100%, 460 students, 99% FRL) — zoned schools average 99% FRL vs 80% district-wide (18 pts higher); higher-poverty schools than district average — tighter screening recommended.
- Market conditions: Rents rising (+2.6%/yr); 255 active listings in the ZIP; 40 comparable units currently listed for rent nearby; rentals at typical pace (median 24d on market — plan ~3-4 weeks tenant-placement turnaround); 45% of comp listings sitting > 30 days — soft ceiling on asking rent; 294 units permitted in St. Louis city in 2024 (227 in 5+ unit buildings).
Forward outlook
- Local home prices are declining (-3.0%/yr); year-one equity from $588 of loan paydown is wiped out by about $3k of value loss. Plan a longer hold.
- St. Louis County population projected to shrink 6% by 2050 — rents likely to lag national; underwrite the cash flow, not the appreciation.
Negotiation context
- Only 3 days on market — expect competitive offers; lowballing is unlikely to land.
Risks & watch-outs
- Watch-outs: built in 1922 — expect roof / HVAC / electrical / plumbing capex.
- Climate carrying-cost: extreme-heat days projected 7→21/yr by 2055 (HVAC capex compounding) — expect insurance premiums to compound above CPI over the hold.
Questions for the listing agent
- Built in 1922 — when were the roof, HVAC, electrical panel, plumbing, and water heater last replaced?
- Is there a deadline driving the sale (1031 exchange, divorce, estate, relocation)? That informs how much negotiation room exists.
- What's the average days-on-market for RENTAL listings here right now (not sales)? A rising rental-DOM trend means longer vacancies and softer asking-rent achievability than the comps imply.
- What's the recent tenant-quality profile in this submarket — average credit score on applications, eviction rate, late-payment / NSF rate, and stable-employment percentage? A property-management company in the area should have these aggregated.
- How much new for-sale + rental construction is in the pipeline within 1–3 miles? Heavy new supply typically softens prices + rents 12–24 months out; constrained supply supports both.
Investment metrics
- 1% rule
- 1.18% ✓
- Cap rate
- 9.16%
- Cash-on-cash
- 10.24%
- DSCR
- 1.46
- GRM
- 7.1
CMA / ARV
- ARV (on-the-fly)
- $159,236
- Comps found
- 12
Show comp detail 12 sales within ~0.75 mi
| Address | Dist | Beds/Ba | Sqft | Sold | Price | $/sf | Match |
|---|---|---|---|---|---|---|---|
| 4437 S 37th St | 0.14mi | 2/1.0 | 1,007 (-3%) | 2mo | $155,000 | $154 | 88 |
| 3855 Bingham Ave | 0.18mi | 2/1.5 | 1,050 (+2%) | 1mo | $159,900 | $152 | 86 |
| 4410 S Spring Ave | 0.15mi | 3/1.0 (+1) | 1,101 (+6%) | 0mo | $169,900 | $154 | 77 |
| 4404 S 39th St | 0.20mi | 2/2.0 | 1,120 (+8%) | 2mo | $164,900 | $147 | 71 |
| 3940 Randall St | 0.58mi | 3/1.0 (+1) | 1,008 (-2%) | 1mo | $165,000 | $164 | 63 |
| 4471 S Spring Ave | 0.24mi | 3/2.0 (+1) | 1,152 (+11%) | 1mo | $135,000 | $117 | 60 |
| 4533 Ray Ave | 0.61mi | 3/1.5 (+1) | 1,000 (-3%) | 0mo | $229,900 | $230 | 59 |
| 3905 Itaska St | 0.48mi | 2/1.0 | 923 (-11%) | 1mo | $135,000 | $146 | 59 |
| 3724 Bamberger Ave | 0.59mi | 3/2.0 (+1) | 1,069 (+3%) | 1mo | $110,000 | $103 | 57 |
| 3718 S Spring Ave | 0.63mi | 3/2.0 (+1) | 1,071 (+4%) | 1mo | $110,000 | $103 | 55 |
| 3628 Neosho St | 0.32mi | 3/2.0 (+1) | 1,158 (+12%) | 1mo | $189,900 | $164 | 55 |
| 4630 Idaho Ave | 0.56mi | 2/1.0 | 880 (-15%) | 2mo | $145,000 | $165 | 48 |
Match score weights: distance 35% · size 25% · config 20% · recency 20%. Top-matched comps best support the ARV.
Projected returns pro-forma
-3.0% appreciation · 2.62% rent growth · sell at horizon
- IRR
- -1.3%
- Equity multiple
- 0.95×
- Total profit
- $-1,206
- Equity at exit
- $12,674
- IRR
- 7.9%
- Equity multiple
- 1.59×
- Total profit
- $14,115
- Equity at exit
- $7,349
Cash invested: $23,800 (down + closing). Projections, not guarantees.
Landlord ↔ Tenant lean methodology
- Overall (STATE)
- 81 Strongly Landlord-Friendly
- State Missouri
- 81 Strongly Landlord-Friendly · R+10
- County
- — inherits STATE
- City
- — inherits STATE
ZIP-level market 63116
- Rents YoY
- 2.6%
- Active inventory
- 255
- Price-to-rent
- 7.1×
Monthly cashflow live
- Estimated rent
- $1,002 high interval (Pro) →
- Mortgage (P&I)
- −$446
- Tax from tax record
- −$107 /mo · $1,284/yr
- Insurance
- −$35
- HOA
- −$0
- Vacancy / Maint / Mgmt
- −$210
- Net cashflow
- $203
Break-even live
UW: 25.0% down · 7.5% · 30yr · 1.5% tax · 5.0% vac · 8.0% maint · 8.0% mgmt
Financing live
Cash to close
- Down payment
- $21,250
- Closing costs
- $2,550
- Reserves months
- —
- Total cash needed
- —
Loan-product check · same deal, 3 products live
Conventional
25% down · 7.5% · 30yr
- Down + closing
- —
- Monthly P&I
- —
- Monthly cashflow
- —
- DSCR
- —
- Eligible?
- —
Personal DTI + credit; lowest rate.
DSCR
20% down · 8.5% · 30yr
- Down + closing
- —
- Monthly P&I
- —
- Monthly cashflow
- —
- DSCR
- —
- Eligible?
- —
No personal income docs; deal must DSCR.
Hard money
10% down · 12.0% · 12mo
- Down + closing
- —
- Monthly P&I
- —
- Monthly cashflow
- —
- DSCR
- —
- Eligible?
- —
Short-term bridge; refi at stabilization.
Rent comps 40 comps
| Address | Beds | Baths | Sqft | Rent | $/sqft | DOM | Units | Dist |
|---|---|---|---|---|---|---|---|---|
| 4234 Dewey Ave Saint Louis, MO | 1.0 | 1.0 | 884 | $745 | $0.84 | 43d | 1 | 0.08mi |
| 3702 Meramec St Unit 1e St. Louis, MO | 2.0 | 1.0 | 725 | $950 | $1.31 | 7d | 1 | 0.15mi |
| 4455 S 38th St Saint Louis, MO | 3.0 | 1.0 | 1000 | $1,000 | $1.00 | 23d | 1 | 0.17mi |
| 3654 Montana St Unit 3656 St. Louis, MO | 1.0 | 1.0 | 825 | $1,000 | $1.21 | 23d | 1 | 0.20mi |
| 4451 Grace Ave Saint Louis, MO | 2.0 | 1.0 | 700 | $750 | $1.07 | 17d | 1 | 0.21mi |
| 4053 Giles Ave Unit A St. Louis, MO | 2.0 | 1.0 | 1082 | $995 | $0.92 | 10d | 1 | 0.22mi |
| 4217 S Grand Blvd Unit 1 St. Louis, MO | 3.0 | 1.0 | 1250 | $1,400 | $1.12 | 4d | 1 | 0.23mi |
| 4416 S Grand Blvd Saint Louis, MO | 3.0 | 1.0 | 963 | $1,550 | $1.61 | 23d | 1 | 0.26mi |
| 4030-4032 Hydraulic Ave St. Louis, MO | 1.0 | 1.0 | 765 | $795 | $1.04 | 43d | 1 | 0.28mi |
| 4030 Hydraulic Ave Unit Hydraulic St. Louis, MO | 1.0 | 1.0 | 765 | $795 | $1.04 | 7d | 1 | 0.29mi |
| 4401 Tennessee Ave Unit A St. Louis, MO | 1.0 | 1.0 | 1100 | $995 | $0.90 | 4d | 1 | 0.29mi |
| 3664 Neosho St Saint Louis, MO | 1.0 | 1.0 | 700 | $750 | $1.07 | 43d | 1 | 0.30mi |
| 3654 Neosho St Saint Louis, MO | 1.0 | 1.0 | 850 | $725 | $0.85 | 7d | 1 | 0.31mi |
| 3635 Marceline Ter Unit 2ND St. Louis, MO | 3.0 | 1.0 | 1250 | $1,275 | $1.02 | 43d | 1 | 0.35mi |
| 3515 Osage St Unit 3511 Osage St. Louis, MO | 1.0 | 1.0 | 755 | $695 | $0.92 | 43d | 1 | 0.37mi |
| 3511 Osage St Saint Louis, MO | 1.0 | 1.0 | 755 | $695 | $0.92 | 43d | 1 | 0.38mi |
| 3514 Alberta St Unit 1W St. Louis, MO | 2.0 | 1.0 | 800 | $800 | $1.00 | 43d | 1 | 0.40mi |
| 3860 Bamberger Ave Unit 1N St. Louis, MO | 2.0 | 1.0 | 850 | $799 | $0.94 | 10d | 1 | 0.42mi |
| 3860 Bamberger Ave Unit 3N St. Louis, MO | 2.0 | 1.0 | 700 | $799 | $1.14 | 17d | 1 | 0.42mi |
| 3862 S Spring Ave Apt 3E St. Louis, MO | 1.0 | 1.0 | 700 | $695 | $0.99 | 10d | 1 | 0.42mi |
| 4684 S Grand Blvd Saint Louis, MO | 1.0 | 1.0 | 1000 | $800 | $0.80 | 10d | 1 | 0.44mi |
| 4637 Louisiana Ave Saint Louis, MO | 2.0 | 1.0 | 1104 | $1,175 | $1.06 | 12d | 1 | 0.44mi |
| 3647 Delor St Unit 3647-1F St. Louis, MO | 2.0 | 1.5 | 900 | $1,115 | $1.24 | 43d | 1 | 0.48mi |
| 3753 Dunnica Ave Unit A St. Louis, MO | 1.0 | 1.0 | 756 | $750 | $0.99 | 43d | 1 | 0.48mi |
| 3761 Delor St St. Louis, MO | 2.0 | 1.5 | 900 | $1,285 | $1.43 | 1d | 2 | 0.49mi |
| 3707a Delor St Unit 3707-2F St. Louis, MO | 2.0 | 1.5 | 900 | $1,115 | $1.24 | 43d | 1 | 0.49mi |
| 3765 Delor St Unit 37651-F St. Louis, MO | 2.0 | 1.5 | 900 | $1,225 | $1.36 | 23d | 1 | 0.49mi |
| 3723 Delor St Unit 3723-1F St. Louis, MO | 2.0 | 1.5 | 900 | $1,225 | $1.36 | 43d | 1 | 0.49mi |
| 3719 Delor St Unit 3719-1F St. Louis, MO | 2.0 | 1.5 | 900 | $1,115 | $1.24 | 43d | 1 | 0.49mi |
| 3923 Keokuk St Saint Louis, MO | 1.0 | 1.0 | 800 | $750 | $0.94 | 43d | 1 | 0.49mi |
| 3711 Delor St Unit 3711-1F St. Louis, MO | 2.0 | 1.5 | 900 | $1,225 | $1.36 | 23d | 1 | 0.49mi |
| 3709 Delor St Unit 3709-1F St. Louis, MO | 2.0 | 1.5 | 900 | $1,225 | $1.36 | 43d | 1 | 0.49mi |
| 4722 S Grand Blvd Unit 2N St. Louis, MO | 1.0 | 1.0 | 925 | $750 | $0.81 | 14d | 1 | 0.49mi |
| 3661 Delor St Unit 3661-1F St. Louis, MO | 2.0 | 1.5 | 900 | $1,225 | $1.36 | 43d | 1 | 0.50mi |
| 3661 Delor St Unit 3661-2F St. Louis, MO | 2.0 | 1.5 | 900 | $1,115 | $1.24 | 43d | 1 | 0.50mi |
| 3737 Delor St Unit 3737-1F St. Louis, MO | 2.0 | 1.5 | 900 | $1,115 | $1.24 | 23d | 1 | 0.50mi |
| 3729 Delor St Unit 37292-F St. Louis, MO | 2.0 | 1.5 | 900 | $1,115 | $1.24 | 23d | 1 | 0.50mi |
| 3737 Delor St Unit 3737-2F St. Louis, MO | 2.0 | 1.5 | 900 | $1,115 | $1.24 | 43d | 1 | 0.50mi |
| 3827 Dunnica Ave Unit 2F St. Louis, MO | 1.0 | 1.0 | 826 | $950 | $1.15 | 43d | 1 | 0.51mi |
| 3717 Delor St Unit 37172-F St. Louis, MO | 2.0 | 1.5 | 900 | $1,115 | $1.24 | 23d | 1 | 0.51mi |
Listing history 3 events
-
2026-06-02status $85,000 Pending 3 DOM
-
2026-06-01days on market $85,000 Active 3 DOM
-
2026-05-31days on market $85,000 Active 2 DOM
ⓘ Source: listings_history table (triggers on properties + properties_extension) + one-shot
backfill from property_details.listing_events for pre-trigger history.
Tax reassessment forecast MO · Resets to sale price
- Current annual tax
- $1,284 · $107/mo
- Projected year-2 tax
- $1,284 · $107/mo
- Expected delta
- $0/yr ($0/mo · 0.0%)
ⓘ Screening estimate from a state-policy table — verify with the county assessor before closing.
Climate risk First Street
- Flood 1/10 Low FEMA zone X (unshaded) · 0% chance over 30 yrs
- Wildfire 1/10 Low
- Heat 5/10 Major 7 d/yr ≥108°F today · 21 d/yr by 30 yrs out
- Wind 2/10 Low 100% chance of damaging wind over 30 yrs
- Air quality 3/10 Moderate 3 unhealthy d/yr today · 4 by 30 yrs out
Nearby sold comps map
Loading sold comps map…
Walkable amenities ~0.75 mi
Loading nearby amenities…
Taxation est. · year 1
- Rental income
- $12,018
- − Mortgage interest
- −$4,761
- − Property taxes
- −$1,284
- − Insurance
- −$425
- − Repairs & maintenance
- −$961
- − Management
- −$961
- − Depreciation
- −$2,473
- Taxable income
- $1,153
- Est. tax owed @ 24.0%
- −$277
- After-tax cash flow
- $2,160/yr
For passive investors: Depreciation is non-cash, so a rental often shows a tax loss while cash-flowing — sheltering income. Rental losses are passive: they offset passive income freely, and up to $25,000/yr can offset ordinary (W-2) income if you actively participate and your MAGI is under $100k (phasing out to $0 by $150k); unused losses carry forward. On sale, claimed depreciation is recaptured at up to 25%, and gains may owe capital-gains tax (a 1031 exchange can defer both). Figures are a year-1 estimate at your 24.0% rate — not tax advice; consult a CPA.
Schools (NCES district)
- District
- St. Louis City
- NCES district ID
- 2929280
- Math proficiency
- 10% ▼ -6.00%
- Reading proficiency
- 18% ▼ -3.00%
- Median HH income
- $35,685
- Composite
- 11.54/100
- National rank
- #9699
- State rank
- #312 of 324 in MO
Livability — St. Louis
No livability data for this city. (Only ~50 U.S. cities are tracked.)
Census & demographics
- Census place
- St. Louis, MO
- County
- Saint Louis City · 254,015 people
- City population
- 283,259
- Metro
- St. Louis, MO-IL
- Population (ZIP)
- 42,170
- Household income
- $61,433
- Rent vs Own
- Severe rent burden
- 1923.0
Population outlook (St. Louis County) Hauer SSP2
- Today (2025)
- 315,737 people
- By 2030
- 313,865 · -0.6%
- By 2040
- 305,439 · -3.3%
- By 2050
- 296,529 · -6.1%
- By 2075
- 271,028 · -14.2%
- By 2100
- 255,359 · -19.1%
Race, ethnicity, and origin ACS 2023
- Neighborhood character
- Diverse neighborhood (Simpson 0.63)
- Race & ethnicity
- White 54% Black 27% Hispanic / Latino 10% Two or more races 8% Asian 5%
- Hispanic origin (detail)
- Mexican 7%
- Common ancestry
- Lithuanian 4% Romanian 2% Italian 2%
- Foreign-born
- 11% · Canada, Vietnam, Philippines
- Languages at home
- 85% English-only · Spanish 6% Vietnamese 2% Arabic 2%
Political lean MEDSL · St. Louis
- 2024 margin
- Solid D (+64.7) · D 81.4% · R 16.7% · Other 2.0%
- 2008→2024 swing
- -3.5pp toward R · 2008: 68.2pp · 2024: 64.7pp
- All cycles
- 2024: D+64.7 2020: D+66.2 2016: D+63.7 2012: D+66.6 2008: D+68.2
Not yet ingested
- Civics
- —
Market trends
- HPI YoY
- ▼ -271.19%
- Current HPI
- 215.7108
- Rent YoY
- ▲ 2.62%
- Metro
- St. Louis, MO-IL
- State GDP YoY
- ▲ 1.84%
- F500 in state
- 20
Industry mix (Fortune 500 HQ in MO)
| Industry | F500 HQs | Revenue |
|---|---|---|
| Healthcare | 1 | $163B |
|
||
| Insurance | 1 | $21B |
|
||
| Industrial Technology | 1 | $17B |
|
||
| Retail | 1 | $16B |
|
||
| Industrial Distribution | 1 | $10B |
|
||
| Utilities | 1 | $9B |
|
||
Price history
2 events — show timeline
- 2026-05-29 Listed $85,000 MARIS as Distributed by MLS Grid
- 1994-10-28 Sold (Public Records) — Public Records
Property tax history
+3.6%/yrLatest (2024): $1,284 · +5.1% YoY. Source: county tax records.
Cash-flow waterfall
monthlySold comps — $/sqft
last 12 mo · ≤1 miLoading sold comps…