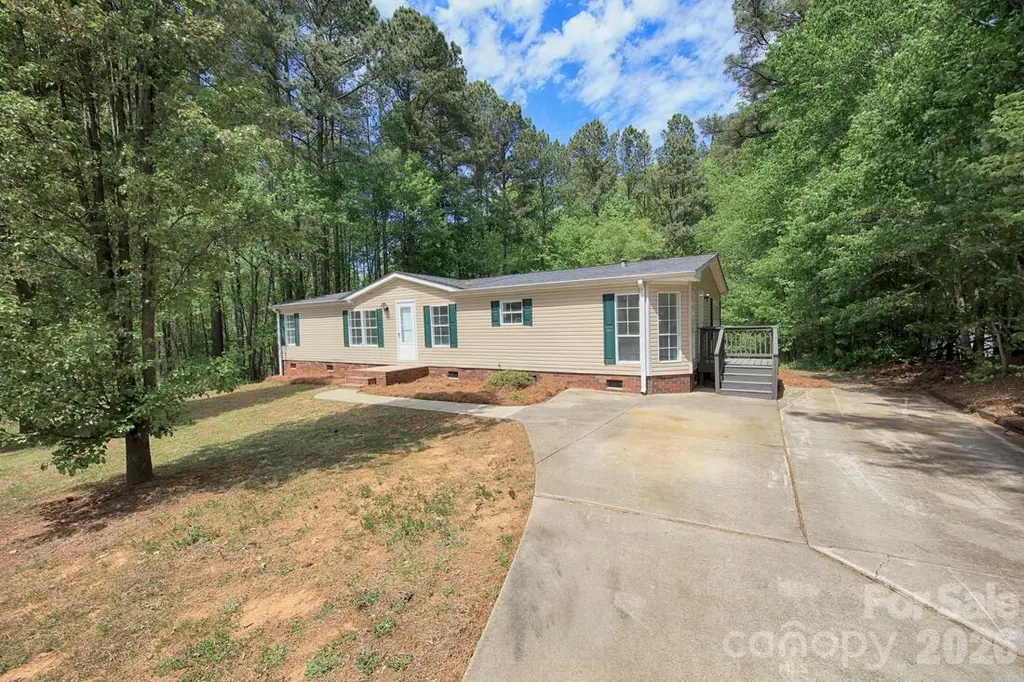
223 Ridge Creek Dr · Troutman, NC
Flood risk 1/10 · Minimal
- FEMA flood zone
- X (unshaded)
- Chance of flooding over 30 yrs
- 0.0%
- Est. flood insurance / yr
- $507 – $1,088
Fire risk 4/10 · Minor
- Est. fire insurance / yr
- $906 – $1,684
Heat risk 5/10 · Moderate
- Hot days now (above 103°F)
- 7 days/yr
- Hot days in 30 yrs
- 17 days/yr
Wind risk 3/10 · Minor
- Chance of severe wind over 30 yrs
- 7.0%
Air-quality risk 3/10 · Minor
- Unhealthy air days now
- 3 days/yr
- Unhealthy air days in 30 yrs
- 5 days/yr
Risk factors via First Street. Map © Google.
Why this score? — see what drove the D+ grade
The composite is a weighted blend of 9 inputs, each scored 0–100. Each bar is that input's sub-score; the figure is the points it added to the 100-point composite (weight × sub-score).
- ARV discount +15.0/15.0
- Cash flow +14.3/30.0
- Schools +4.5/10.0
- DSCR +4.3/10.0
- Livability +3.2/5.0
- Rent growth +3.0/5.0
- 1% rule +2.7/10.0
- Condition / age +2.5/5.0
- Appreciation +0.0/10.0
$266,900
🖨 Deal sheet (PDF) 📄 Offer letter ✓ Due diligence
Listing remarks MLS
Great home in Troutman. Freshly painted throughtout. New carpet. Open floor plan with two seperate living spaces. Whirlpool tub in master bath. Large back yard great for entertaining. Come home before someone else does.
Key facts
- Open floor plan
- Lpv flooring
- New appliances
Tags
Property features AI
Finance
- HOA & community: No HOA
Exterior
- Parking: Driveway
- Utilities: Well water; Septic system
- Home design: Manufactured single-family residence; One story; Crawl space foundation
- Construction: Vinyl exterior
- Exterior features: Concrete and paved road access; Publicly maintained road
Interior
- Kitchen: Dishwasher; Electric range; Refrigerator
- Bedrooms: Three bedrooms on the main level
- Bathrooms: Two full bathrooms on the main level
- Heating & cooling: Heat pump for heating and cooling
- Interior features: Eight total rooms; Laundry room
- Laundry & utility: Laundry room
Neighborhood map
What this means for you Summary
Snapshot
- This is a 3-bed/2.0-bath single-family listed at $267k.
Deal economics
- At list price, monthly cash flow is $47 ($567/yr) — positive.
- The deal already cash-flows at list — no discount required.
- To meet the 1% rule (rent ≥ 1% of price), the offer needs to be $205k (23.3% below list).
- Recommended offer: $205k (23.3% below list) — sets the bar for 1% rule.
- Cap rate 6.5% vs local median 3.1% in Troutman — top-decile yield for the area; either an underpriced asset or a hidden risk that comps aren't pricing in. Stress-test before assuming the spread holds.
Location & tenants
- Location reads 64/100 on livability (#342 in NC) — a middle-class / working-renter tenant base. Strengths: housing A+, cost of living A-; Watch: amenities F, commute F, health & safety F.
- Iredell-Statesville Schools (rural): math 53% / reading 52% proficiency, ranked #51 of 178 in NC (top 29%) — acceptable for families but not a draw, mixed tenant base, ~2y average lease.
- Zoned schools: Troutman Elementary (math 63% / reading 44%, grade C, #335 of 1,410 statewide, top 24%, 698 students, 54% FRL); The Brawley School (math 91% / reading 88%, grade A+, #2 of 475 statewide, top 0%, 639 students, 9% FRL); South Iredell High (math 47% / reading 72%, grade C+, #216 of 535 statewide, top 43%, 1,711 students, 34% FRL).
- Zoned-school proficiency averages 68% at this address vs 52% district-wide (+15 pts) — the actual schools serving this property are materially stronger than the Iredell-Statesville Schools average implies; a family-tenant draw the district grade alone would hide.
- Market conditions: Rents rising (+2.1%/yr); 265 active listings in the ZIP; 1 comparable units currently listed for rent nearby; solid renter incomes; 1,955 units permitted in Iredell County in 2024 (128 in 5+ unit buildings).
Forward outlook
- Local home prices are declining (-3.0%/yr); year-one equity from $2k of loan paydown is wiped out by about $8k of value loss. Plan a longer hold.
- Iredell County population projected at +26% by 2050 — long-run rental-demand tailwind backs the buy-and-hold thesis.
Negotiation context
- It's been on market 58 days — a 3% lower offer ($259k) is reasonable based on typical stale-listing flexibility.
- 3 sale attempts since 10y ago with the ask held roughly flat each time — persistent listings suggest the price (not the market) is what's stuck; bring a comps-based counter.
- Current owner paid $194k; 38% above their basis — modest negotiation headroom, anchor on the comps not their cost.
Risks & watch-outs
- Climate carrying-cost: extreme-heat days projected 7→17/yr by 2055 (HVAC capex compounding) — expect insurance premiums to compound above CPI over the hold.
Questions for the listing agent
- It's been on market 58 days. Have you received any prior offers? Is the seller open to a 23% concession, seller financing, or rate buy-down credit?
- Is there a deadline driving the sale (1031 exchange, divorce, estate, relocation)? That informs how much negotiation room exists.
- Schools are F-rated, which usually means shorter tenancies and higher turnover. Who's the typical renter profile here, and what's been the actual vacancy rate?
- The area grade is low — what's the realistic commute time and amenity access for the typical tenant pool here? Any planned neighborhood developments (good or bad) we should know about?
- What's the average days-on-market for RENTAL listings here right now (not sales)? A rising rental-DOM trend means longer vacancies and softer asking-rent achievability than the comps imply.
- What's the recent tenant-quality profile in this submarket — average credit score on applications, eviction rate, late-payment / NSF rate, and stable-employment percentage? A property-management company in the area should have these aggregated.
- How much new for-sale + rental construction is in the pipeline within 1–3 miles? Heavy new supply typically softens prices + rents 12–24 months out; constrained supply supports both.
Investment metrics
- 1% rule
- 0.77% ✗
- Cap rate
- 6.51%
- Cash-on-cash
- 0.76%
- DSCR
- 1.03
- GRM
- 10.9
CMA / ARV
- ARV (on-the-fly)
- $322,712
- Comps found
- 12
Show comp detail 12 sales within ~0.75 mi
| Address | Dist | Beds/Ba | Sqft | Sold | Price | $/sf | Match |
|---|---|---|---|---|---|---|---|
| 125 Grafton Pl | 0.39mi | 3/2.0 | 1,424 (-6%) | 2mo | $350,000 | $246 | 71 |
| 128 Farmdale Dr | 0.39mi | 3/2.0 | 1,433 (-5%) | 7mo | $352,151 | $246 | 68 |
| 208 Brook Creek Dr | 0.17mi | 3/2.0 | 1,595 (+6%) | 18mo | $323,000 | $203 | 67 |
| 144 Ridge Creek Dr | 0.42mi | 3/2.0 | 1,446 (-4%) | 8mo | $280,000 | $194 | 67 |
| 118 Carrisa Ln | 0.36mi | 3/2.5 | 1,628 (+8%) | 5mo | $279,900 | $172 | 64 |
| 166 Brook Creek Dr | 0.30mi | 4/2.0 (+1) | 1,620 (+7%) | 7mo | $289,000 | $178 | 62 |
| 112 Brook Creek Dr | 0.42mi | 3/2.5 | 1,446 (-4%) | 13mo | $309,900 | $214 | 60 |
| 144 Hawks Landing Dr | 0.63mi | 3/2.0 | 1,607 (+7%) | 0mo | $415,000 | $258 | 59 |
| 230 Carlyle Rd | 0.54mi | 3/2.0 | 1,512 (+0%) | 20mo | $202,000 | $134 | 58 |
| 105 W Panther Creek Rd | 0.28mi | 3/2.0 | 1,375 (-9%) | 21mo | $285,000 | $207 | 55 |
| 141 Misty Spring Rd | 0.54mi | 3/2.0 | 1,387 (-8%) | 18mo | $304,700 | $220 | 47 |
| 169 Ridge Creek Dr | 0.28mi | 3/2.0 | 1,313 (-13%) | 23mo | $290,000 | $221 | 46 |
Match score weights: distance 35% · size 25% · config 20% · recency 20%. Top-matched comps best support the ARV.
Projected returns pro-forma
-3.0% appreciation · 2.13% rent growth · sell at horizon
- IRR
- -16.0%
- Equity multiple
- 0.44×
- Total profit
- $-42,154
- Equity at exit
- $39,796
- IRR
- -9.1%
- Equity multiple
- 0.46×
- Total profit
- $-40,555
- Equity at exit
- $23,077
Cash invested: $74,732 (down + closing). Projections, not guarantees.
Landlord ↔ Tenant lean methodology
- Overall (STATE)
- 85 Strongly Landlord-Friendly
- State North Carolina
- 85 Strongly Landlord-Friendly · R+3
- County
- — inherits STATE
- City
- — inherits STATE
ZIP-level market 28166
- Home prices YoY
- -23.7%
- Rents YoY
- 2.1%
- Active inventory
- 265
- Price-to-rent
- 10.9×
Monthly cashflow live
- Estimated rent
- $2,048 medium interval (Pro) →
- Mortgage (P&I)
- −$1,400
- Tax from tax record
- −$60 /mo · $717/yr
- Insurance
- −$111
- HOA
- −$0
- Vacancy / Maint / Mgmt
- −$430
- Net cashflow
- $47
Break-even live
Sensitivity live
| Price | -10% $198 | -5% $123 | +0% $47 | +5% $-28 | +10% $-104 |
|---|---|---|---|---|---|
| Rent | -10% $-115 | -5% $-34 | +0% $47 | +5% $128 | +10% $209 |
| Rate | -1.0pp $182 | -0.5pp $115 | base $47 | +0.5pp $-22 | +1.0pp $-92 |
UW: 25.0% down · 7.5% · 30yr · 1.5% tax · 5.0% vac · 8.0% maint · 8.0% mgmt
Financing live
Cash to close
- Down payment
- $66,725
- Closing costs
- $8,007
- Reserves months
- —
- Total cash needed
- —
Loan-product check · same deal, 3 products live
Conventional
25% down · 7.5% · 30yr
- Down + closing
- —
- Monthly P&I
- —
- Monthly cashflow
- —
- DSCR
- —
- Eligible?
- —
Personal DTI + credit; lowest rate.
DSCR
20% down · 8.5% · 30yr
- Down + closing
- —
- Monthly P&I
- —
- Monthly cashflow
- —
- DSCR
- —
- Eligible?
- —
No personal income docs; deal must DSCR.
Hard money
10% down · 12.0% · 12mo
- Down + closing
- —
- Monthly P&I
- —
- Monthly cashflow
- —
- DSCR
- —
- Eligible?
- —
Short-term bridge; refi at stabilization.
Rent comps 1 comps
| Address | Beds | Baths | Sqft | Rent | $/sqft | DOM | Units | Dist |
|---|---|---|---|---|---|---|---|---|
| 154 Stella Ln Troutman, NC | 3.0 | 2.5 | 1572 | $2,000 | $1.27 | 18d | 1 | 1.28mi |
Listing history 23 events
-
2026-06-21days on market $266,900 Active 58 DOM
-
2026-06-18days on market $266,900 Active 55 DOM
-
2026-06-17days on market $266,900 Active 54 DOM
-
2026-06-16days on market $266,900 Active 53 DOM
-
2026-06-15days on market $266,900 Active 52 DOM
-
2026-06-13days on market $266,900 Active 50 DOM
-
2026-06-13days on market $266,900 Active 49 DOM
-
2026-06-09days on market $266,900 Active 46 DOM
-
2026-06-08days on market $266,900 Active 45 DOM
-
2026-06-07days on market $266,900 Active 44 DOM
-
2026-06-04days on market $266,900 Active 41 DOM
-
2026-06-03days on market $266,900 Active 40 DOM
-
2026-06-02days on market $266,900 Active 39 DOM
-
2026-06-01days on market $266,900 Active 38 DOM
-
2026-05-31days on market $266,900 Active 37 DOM
-
2026-04-24$274,900 Active
-
2026-02-27soldstatus $194,000
-
2017-03-29soldstatus $89,900 Closed 224-char remark
Show marketing remark (224 chars)
Great home in Troutman. Freshly painted throughtout. New carpet. Open floor plan with two seperate living spaces. Whirlpool tub in master bath. Large back yard great for entertaining. Come home before someone else does.
-
2017-03-29soldstatus $90,000
Show marketing remark (224 chars)
Great home in Troutman. Freshly painted throughtout. New carpet. Open floor plan with two seperate living spaces. Whirlpool tub in master bath. Large back yard great for entertaining. Come home before someone else does.
-
2017-02-20historical Under Contract - Show 224-char remark
Show marketing remark (224 chars)
Great home in Troutman. Freshly painted throughtout. New carpet. Open floor plan with two seperate living spaces. Whirlpool tub in master bath. Large back yard great for entertaining. Come home before someone else does.
-
2016-12-14status Active 224-char remark
Show marketing remark (224 chars)
Great home in Troutman. Freshly painted throughtout. New carpet. Open floor plan with two seperate living spaces. Whirlpool tub in master bath. Large back yard great for entertaining. Come home before someone else does.
-
2016-11-22historical Under Contract - Show 224-char remark
Show marketing remark (224 chars)
Great home in Troutman. Freshly painted throughtout. New carpet. Open floor plan with two seperate living spaces. Whirlpool tub in master bath. Large back yard great for entertaining. Come home before someone else does.
-
2016-11-10$89,900 Active 224-char remark
Show marketing remark (224 chars)
Great home in Troutman. Freshly painted throughtout. New carpet. Open floor plan with two seperate living spaces. Whirlpool tub in master bath. Large back yard great for entertaining. Come home before someone else does.
ⓘ Source: listings_history table (triggers on properties + properties_extension) + one-shot
backfill from property_details.listing_events for pre-trigger history.
Tax reassessment forecast NC · Resets to sale price
- Current annual tax
- $717 · $60/mo
- Projected year-2 tax
- $2,189 · $182/mo
- Expected delta
- +$1,472/yr (+$123/mo · 205.3%)
ⓘ Screening estimate from a state-policy table — verify with the county assessor before closing.
Climate risk First Street
- Flood 1/10 Low FEMA zone X (unshaded) · 0% chance over 30 yrs
- Wildfire 4/10 Moderate
- Heat 5/10 Major 7 d/yr ≥103°F today · 17 d/yr by 30 yrs out
- Wind 3/10 Moderate 7% chance of damaging wind over 30 yrs
- Air quality 3/10 Moderate 3 unhealthy d/yr today · 5 by 30 yrs out
Nearby sold comps map
Loading sold comps map…
Walkable amenities ~0.75 mi
Loading nearby amenities…
Taxation est. · year 1
- Rental income
- $24,575
- − Mortgage interest
- −$14,951
- − Property taxes
- −$717
- − Insurance
- −$1,334
- − Repairs & maintenance
- −$1,966
- − Management
- −$1,966
- − Depreciation
- −$7,764
- Taxable loss
- −$4,123
- Est. tax savings @ 24.0%
- +$990
- After-tax cash flow
- $1,557/yr
For passive investors: Depreciation is non-cash, so a rental often shows a tax loss while cash-flowing — sheltering income. Rental losses are passive: they offset passive income freely, and up to $25,000/yr can offset ordinary (W-2) income if you actively participate and your MAGI is under $100k (phasing out to $0 by $150k); unused losses carry forward. On sale, claimed depreciation is recaptured at up to 25%, and gains may owe capital-gains tax (a 1031 exchange can defer both). Figures are a year-1 estimate at your 24.0% rate — not tax advice; consult a CPA.
Schools (NCES district)
- District
- Iredell-Statesville Schools
- NCES district ID
- 3702310
- Math proficiency
- 53% ▲ 8.00%
- Reading proficiency
- 52% ▲ 4.00%
- Median HH income
- $51,201
- Composite
- 44.98/100
- National rank
- #2703
- State rank
- #51 of 178 in NC
Livability — Troutman
- Score
- 64/100
- State rank
- #342
- US rank
- #13725
Category grades
Schools grade is shown separately in the Schools card above.
Census & demographics
- County
- Iredell County · 182,638 people
- City population
- 11,875
- Metro
- Charlotte-Concord-Gastonia, NC-SC
- Population (ZIP)
- 11,875
- Household income
- $93,511
- Rent vs Own
- Severe rent burden
- 167.0
Population outlook (Iredell County) Hauer SSP2
- Today (2025)
- 194,510 people
- By 2030
- 206,171 · +6.0%
- By 2040
- 227,781 · +17.1%
- By 2050
- 245,102 · +26.0%
- By 2075
- 280,896 · +44.4%
- By 2100
- 294,375 · +51.3%
Race, ethnicity, and origin ACS 2023
- Neighborhood character
- Predominantly White (76%)
- Race & ethnicity
- White 76% Black 15% Hispanic / Latino 6% Two or more races 4% Asian 1%
- Hispanic origin (detail)
- Mexican 3% Puerto Rican 1%
- Common ancestry
- Serbian 2% Italian 2% Slovak 2%
- Foreign-born
- 3% · Canada
- Languages at home
- 96% English-only · Spanish 3% Other Asian/Pacific 1%
Political lean MEDSL · Iredell
- 2024 margin
- Solid R (+32.6) · D 33.2% · R 65.8%
- 2008→2024 swing
- -8.2pp toward R · 2008: -24.4pp · 2024: -32.6pp
- All cycles
- 2024: R+32.6 2020: R+32.4 2016: R+36.8 2012: R+30.5 2008: R+24.4
Not yet ingested
- Civics
- —
Market trends
- HPI YoY
- ▼ -71.32%
- Current HPI
- 229.5993
- Rent YoY
- ▲ 2.13%
- Metro
- Charlotte-Concord-Gastonia, NC-SC
- State GDP YoY
- ▲ 3.28%
- F500 in state
- 26
Industry mix (Fortune 500 HQ in NC)
| Industry | F500 HQs | Revenue |
|---|---|---|
| Financial Services | 2 | $213B |
|
||
| Retail | 2 | $95B |
|
||
| Industrial Conglomerate | 1 | $38B |
|
||
| Metals / Steel | 1 | $35B |
|
||
| Utilities | 1 | $30B |
|
||
| Industrial Machinery | 1 | $19B |
|
||
Price history
+205.8% since first listed8 events — show timeline
- 2026-04-24 Listed $274,900 CANOPYMLS as Distributed by MLS Grid
- 2026-02-27 Sold (Public Records) $194,000 Public Records
- 2017-03-29 Sold (Public Records) $90,000 Public Records
- 2017-03-29 Sold (MLS) $89,900 CANOPYMLS as Distributed by MLS Grid
- 2017-02-20 Contingent — CANOPYMLS as Distributed by MLS Grid
- 2016-12-14 Relisted — CANOPYMLS as Distributed by MLS Grid
- 2016-11-22 Contingent — CANOPYMLS as Distributed by MLS Grid
- 2016-11-10 Listed $89,900 CANOPYMLS as Distributed by MLS Grid
Property tax history
+4.8%/yrLatest (2025): $717 · +0.0% YoY. Source: county tax records.
Cash-flow waterfall
monthlySold comps — $/sqft
last 12 mo · ≤1 miLoading sold comps…