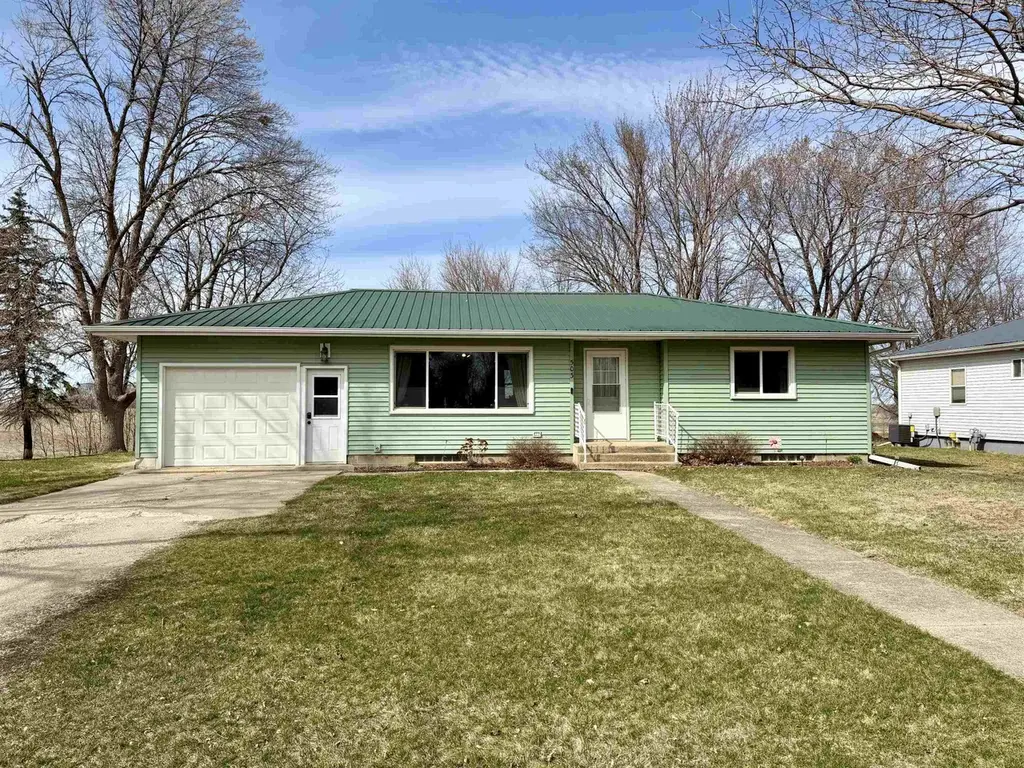
503 W Olesen Thu St · Graettinger, IA
Flood risk 1/10 · Minimal
- FEMA flood zone
- X (unshaded)
- Chance of flooding over 30 yrs
- 0.0%
- Est. flood insurance / yr
- $473 – $860
Fire risk 5/10 · Moderate
- Est. fire insurance / yr
- $902 – $1,676
Heat risk 2/10 · Minimal
- Hot days now (above 100°F)
- 7 days/yr
- Hot days in 30 yrs
- 16 days/yr
Wind risk 2/10 · Minimal
- Chance of severe wind over 30 yrs
- —
Air-quality risk 2/10 · Minimal
- Unhealthy air days now
- 1 days/yr
- Unhealthy air days in 30 yrs
- 1 days/yr
Risk factors via First Street. Map © Google.
Why this score? — see what drove the F grade
The composite is a weighted blend of 9 inputs, each scored 0–100. Each bar is that input's sub-score; the figure is the points it added to the 100-point composite (weight × sub-score).
- Cash flow +8.6/30.0
- Appreciation +7.3/10.0
- Schools +5.2/10.0
- Livability +3.8/5.0
- Rent growth +2.5/5.0
- Condition / age +2.5/5.0
- DSCR +2.4/10.0
- 1% rule +1.8/10.0
- ARV discount +0.0/15.0
$129,900
🖨 Deal sheet 📄 Offer letter ✓ Due diligence
Listing remarks
Welcome to this well-maintained single-story home tucked on a quiet street in Graettinger. This move-in ready property features fresh paint, new flooring, and updated trim throughout, creating a clean, modern feel from the moment you walk in. The full basement offers excellent storage with great potential to be finished into additional living space—perfect for growing needs or added value. Step outside to enjoy the peaceful backyard, complete with a storage shed ideal for tools, equipment, or hobbies. Recent exterior updates include new gutters, exterior doors, garage door, updated landscaping, and new steel on the shed, adding both curb appeal and functionality. Major mechanical upda
Key facts
- New furnace
- New gutters
- Full basement
Tags
Property features AI
Finance
- Other: Listing broker: Johnson Realty
Exterior
- Parking: Attached garage (1 car)
- Utilities: Public water; Public sewer
- Home design: Single-family residence; One story; One level entry
- Construction: Vinyl siding; Built as single-story home
- Exterior features: Metal roof; Public-maintained road
Interior
- Kitchen: Freezer; Microwave; Refrigerator
- Bathrooms: One full bathroom
- Heating & cooling: Natural gas forced air heating; Central air conditioning
- Interior features: Freezer; Microwave; Refrigerator; Full basement
Neighborhood map
What this means for you Summary
Snapshot
- This is a 2-bed/1.0-bath single-family listed at $130k.
Deal economics
- At list price, monthly cash flow is $-112 ($-1k/yr) — negative.
- To cash-flow at today's rent, offer at most $110k (15.3% below list).
- To meet the 1% rule (rent ≥ 1% of price), the offer needs to be $88k (32.4% below list).
- Recommended offer: $88k (32.4% below list) — sets the bar for 1% rule.
Location & tenants
- Location reads 75/100 on livability (#210 in IA, #3,851 nationally) — a middle-class / working-renter tenant base. Strengths: crime A+, cost of living A+, housing A+; Watch: schools C-, amenities F, commute F.
- Graettinger-Terril Community School District (rural): math 57% / reading 66% proficiency, ranked #235 of 289 in IA (top 81%) — acceptable for families but not a draw, mixed tenant base, ~2y average lease.
- Market conditions: 8 active listings in the ZIP; 19 units permitted in Palo Alto County in 2024 (0 in 5+ unit buildings).
Forward outlook
- In year one you build about $7k of equity ($898 loan paydown + $6k appreciation (4.6% local appreciation)).
- Palo Alto County population projected to shrink 7% by 2050 — rents likely to lag national; underwrite the cash flow, not the appreciation.
- By year 6, paydown + projected appreciation supports a ~$37k cash-out refi (75% LTV) — recoverable capital for the next deal without selling this one.
Negotiation context
- It's been on market 29 days — a 2% lower offer ($128k) is reasonable based on typical stale-listing flexibility.
- Current owner paid $55k; list at $130k implies a 136% gain — meaningful room to come down on a strong offer.
Risks & watch-outs
- Climate carrying-cost: moderate wildfire risk — expect insurance premiums to compound above CPI over the hold.
Questions for the listing agent
- What do current leases actually rent for vs. the listed asking? Can we see a recent rent roll and the last 12 months of T-12 income?
- Built in 1964 — when were the roof, HVAC, electrical panel, plumbing, and water heater last replaced?
- Is there a deadline driving the sale (1031 exchange, divorce, estate, relocation)? That informs how much negotiation room exists.
- The area grade is low — what's the realistic commute time and amenity access for the typical tenant pool here? Any planned neighborhood developments (good or bad) we should know about?
- What's the average days-on-market for RENTAL listings here right now (not sales)? A rising rental-DOM trend means longer vacancies and softer asking-rent achievability than the comps imply.
- What's the recent tenant-quality profile in this submarket — average credit score on applications, eviction rate, late-payment / NSF rate, and stable-employment percentage? A property-management company in the area should have these aggregated.
- How much new for-sale + rental construction is in the pipeline within 1–3 miles? Heavy new supply typically softens prices + rents 12–24 months out; constrained supply supports both.
Investment metrics
- 1% rule
- 0.68% ✗
- Cap rate
- 5.26%
- Cash-on-cash
- -3.70%
- DSCR
- 0.84
- GRM
- 12.3
CMA / ARV
- ARV (on-the-fly)
- $103,119
- Comps found
- 6
Show comp detail 6 sales within ~0.75 mi
| Address | Dist | Beds/Ba | Sqft | Sold | Price | $/sf | Match |
|---|---|---|---|---|---|---|---|
| 503 W Olesen Thu St | 0.00mi | 2/1.0 | 929 (0%) | 0mo | $129,900 | $140 | 100 |
| 402 N Van Gordon Ave | 0.40mi | 2/1.0 | 928 (-0%) | 3mo | $11,500 | $12 | 79 |
| 405 W Hoffman St | 0.08mi | 3/1.0 (+1) | 1,040 (+12%) | 16mo | $115,000 | $111 | 58 |
| 202 W Olive St | 0.30mi | 2/1.0 | 1,056 (+14%) | 10mo | $55,000 | $52 | 55 |
| 2741 425th Ave | 0.63mi | 3/1.0 (+1) | 960 (+3%) | 16mo | $120,000 | $125 | 47 |
| 103 N Elder Avenue Ave | 0.60mi | 3/1.5 (+1) | 989 (+6%) | 17mo | $62,000 | $63 | 40 |
Match score weights: distance 35% · size 25% · config 20% · recency 20%. Top-matched comps best support the ARV.
Projected returns pro-forma
4.6% appreciation · 3.0% rent growth · sell at horizon
- IRR
- 8.7%
- Equity multiple
- 1.54×
- Total profit
- $19,775
- Equity at exit
- $70,443
- IRR
- 10.5%
- Equity multiple
- 2.85×
- Total profit
- $67,373
- Equity at exit
- $119,032
Cash invested: $36,372 (down + closing). Projections, not guarantees.
Landlord ↔ Tenant lean methodology
- Overall (STATE)
- 83 Strongly Landlord-Friendly
- State Iowa
- 83 Strongly Landlord-Friendly · R+6
- County
- — inherits STATE
- City
- — inherits STATE
ZIP-level market 51342
- Home prices YoY
- 3.7%
- Active inventory
- 8
- Price-to-rent
- 12.3×
Monthly cashflow live
- Estimated rent
- $878 medium interval (Pro) →
- Mortgage (P&I)
- −$681
- Tax from tax record
- −$70 /mo · $844/yr
- Insurance
- −$54
- HOA
- −$0
- Vacancy / Maint / Mgmt
- −$184
- Net cashflow
- $-112
Break-even live
UW: 25.0% down · 7.5% · 30yr · 1.5% tax · 5.0% vac · 8.0% maint · 8.0% mgmt
Financing live
Cash to close
- Down payment
- $32,475
- Closing costs
- $3,897
- Reserves months
- —
- Total cash needed
- —
Loan-product check · same deal, 3 products live
Conventional
25% down · 7.5% · 30yr
- Down + closing
- —
- Monthly P&I
- —
- Monthly cashflow
- —
- DSCR
- —
- Eligible?
- —
Personal DTI + credit; lowest rate.
DSCR
20% down · 8.5% · 30yr
- Down + closing
- —
- Monthly P&I
- —
- Monthly cashflow
- —
- DSCR
- —
- Eligible?
- —
No personal income docs; deal must DSCR.
Hard money
10% down · 12.0% · 12mo
- Down + closing
- —
- Monthly P&I
- —
- Monthly cashflow
- —
- DSCR
- —
- Eligible?
- —
Short-term bridge; refi at stabilization.
Listing history 4 events
-
2026-05-08status Pending
-
2026-04-21historical Active Under Contract
-
2026-04-09$129,900 Active
-
2020-04-23soldstatus $55,000
ⓘ Source: listings_history table (triggers on properties + properties_extension) + one-shot
backfill from property_details.listing_events for pre-trigger history.
Tax reassessment forecast IA · Partial reset (capped growth)
- Current annual tax
- $844 · $70/mo
- Projected year-2 tax
- $1,442 · $120/mo
- Expected delta
- +$598/yr (+$50/mo · 70.8%)
ⓘ Screening estimate from a state-policy table — verify with the county assessor before closing.
Climate risk First Street
- Flood 1/10 Low FEMA zone X (unshaded) · 0% chance over 30 yrs
- Wildfire 5/10 Major
- Heat 2/10 Low 7 d/yr ≥100°F today · 16 d/yr by 30 yrs out
- Wind 2/10 Low
- Air quality 2/10 Low 1 unhealthy d/yr today · 1 by 30 yrs out
Nearby sold comps map
Loading sold comps map…
Walkable amenities ~0.75 mi
Loading nearby amenities…
Taxation est. · year 1
- Rental income
- $10,535
- − Mortgage interest
- −$7,276
- − Property taxes
- −$844
- − Insurance
- −$650
- − Repairs & maintenance
- −$843
- − Management
- −$843
- − Depreciation
- −$3,779
- Taxable loss
- −$3,700
- Est. tax savings @ 24.0%
- +$888
- After-tax cash flow
- $-458/yr
For passive investors: Depreciation is non-cash, so a rental often shows a tax loss while cash-flowing — sheltering income. Rental losses are passive: they offset passive income freely, and up to $25,000/yr can offset ordinary (W-2) income if you actively participate and your MAGI is under $100k (phasing out to $0 by $150k); unused losses carry forward. On sale, claimed depreciation is recaptured at up to 25%, and gains may owe capital-gains tax (a 1031 exchange can defer both). Figures are a year-1 estimate at your 24.0% rate — not tax advice; consult a CPA.
Schools (NCES district)
- District
- Graettinger-Terril Community School District
- NCES district ID
- 1912810
- Math proficiency
- 57% ▲ 12.00%
- Reading proficiency
- 66% ▲ 16.00%
- Median HH income
- $46,978
- Composite
- 52.0/100
- National rank
- #1639
- State rank
- #235 of 289 in IA
Livability — Graettinger
- Score
- 75/100
- State rank
- #210
- US rank
- #3851
Category grades
Schools grade is shown separately in the Schools card above.
Census & demographics
- Population (ZIP)
- 1,349
Population outlook (Palo Alto County) Hauer SSP2
- Today (2025)
- 8,816 people
- By 2030
- 8,634 · -2.1%
- By 2040
- 8,334 · -5.5%
- By 2050
- 8,232 · -6.6%
- By 2075
- 8,533 · -3.2%
- By 2100
- 8,976 · +1.8%
Race, ethnicity, and origin ACS 2023
- Neighborhood character
- Predominantly White (84%)
- Race & ethnicity
- White 84% Black 8% Two or more races 6% Hispanic / Latino 2% Native American 1%
- Common ancestry
- Portuguese 12% Lithuanian 2% Iranian 1%
- Foreign-born
- 6% · Canada
- Languages at home
- 93% English-only · Spanish 2%
Political lean MEDSL · Palo Alto
- 2024 margin
- Solid R (+45.0) · D 26.9% · R 71.9% · Other 1.2%
- 2008→2024 swing
- -47.8pp toward R · 2008: 2.8pp · 2024: -45.0pp
- All cycles
- 2024: R+45.0 2020: R+37.3 2016: R+36.0 2012: R+10.8 2008: D+2.8
Not yet ingested
- Civics
- —
Market trends
- HPI YoY
- ▲ 4.60%
- Current HPI
- 128.2923
- Rent YoY
- —
- Metro
- —
- State GDP YoY
- ▲ 2.48%
- F500 in state
- 4
Industry mix (Fortune 500 HQ in IA)
| Industry | F500 HQs | Revenue |
|---|---|---|
| Financial Services | 1 | $16B |
|
||
| Retail / Convenience | 1 | $15B |
|
||
Price history
+136.2% since first listed4 events — show timeline
- 2026-05-08 Pending — Iowa Great Lakes BOR
- 2026-04-21 Contingent — Iowa Great Lakes BOR
- 2026-04-09 Listed $129,900 Iowa Great Lakes BOR
- 2020-04-23 Sold (Public Records) $55,000 Public Records
Property tax history
+2.7%/yrLatest (2025): $844 · +3.2% YoY. Source: county tax records.
Cash-flow waterfall
monthlySold comps — $/sqft
last 12 mo · ≤1 miLoading sold comps…