 Triplex
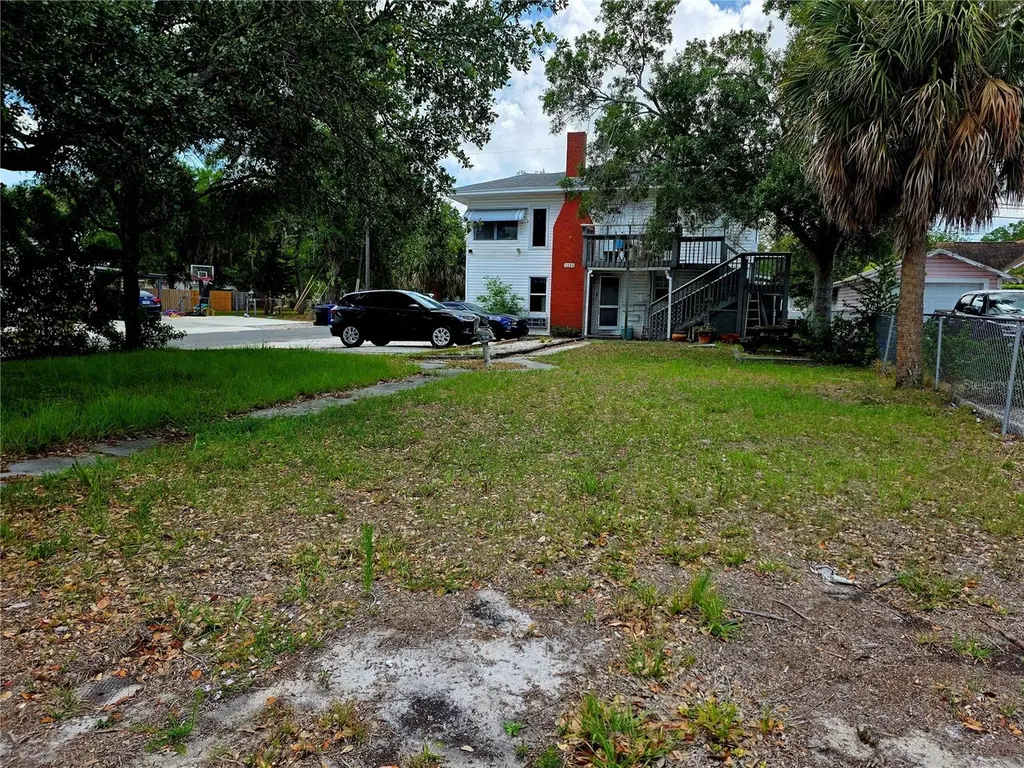
1204 38th Ave N · St. Petersburg, FL
Flood risk 1/10 · Minimal
- FEMA flood zone
- X (unshaded)
- Chance of flooding over 30 yrs
- 0.0%
- Est. flood insurance / yr
- $507 – $1,088
Fire risk 1/10 · Minimal
- Est. fire insurance / yr
- $947 – $1,759
Heat risk 10/10 · Severe
- Hot days now (above 106°F)
- 7 days/yr
- Hot days in 30 yrs
- 26 days/yr
Wind risk 10/10 · Severe
- Chance of severe wind over 30 yrs
- 99.0%
Air-quality risk 4/10 · Minor
- Unhealthy air days now
- 4 days/yr
- Unhealthy air days in 30 yrs
- 4 days/yr
Risk factors via First Street. Map © Google.
Why this score? — see what drove the B- grade
The composite is a weighted blend of 9 inputs, each scored 0–100. Each bar is that input's sub-score; the figure is the points it added to the 100-point composite (weight × sub-score).
- Cash flow +30.0/30.0
- DSCR +10.0/10.0
- 1% rule +8.7/10.0
- ARV discount +7.5/15.0
- Schools +4.3/10.0
- Rent growth +3.4/5.0
- Livability +2.5/5.0
- Condition / age +2.5/5.0
- Appreciation +0.0/10.0
$475,000
🖨 Deal sheet (PDF) 📄 Offer letter ✓ Due diligence
Multi-family units
County records classify this as Multi-Family (2-4 Unit). Listing-text estimate: 3 units. confirmed
Listing remarks
Investor opportunity in the heart of Northeast St. Petersburg! This triplex at 1204 38th Ave N offers strong income potential with a versatile layout and future upside. The standout feature is the spacious upstairs 2-bedroom unit boasting cathedral ceilings, creating an open, airy feel that’s highly desirable for tenants or owner-occupants alike. Situated on a large lot, the property presents a rare opportunity for expansion—explore the potential to add additional units or enhance outdoor living spaces (buyer to verify zoning and development possibilities). Whether you’re looking to generate immediate rental income, live in one unit while renting the others, or maximize va
Key facts
- 5,750 sq ft lot
- Built 1925
- Listed 41 days
Property features AI
Finance
- Other: Living area reported as 1,501 square feet
- Financial info: Annual net income reported: $54,000; Pro forma rents: 2-bed unit $2,200; 1-bed unit $1,350; efficiency $950
Exterior
- Utilities: Public water; Public sewer; Public utilities
- Home design: Residential income property (triplex); Single building with 3 units; Crawlspace foundation
- Construction: Vinyl siding; Shingle roof
- Exterior features: Balcony; Paved road access; Lot dimensions approx. 50 x 115 (0.13 acre)
Interior
- Bedrooms: 3 total bedrooms; Unit breakdown: one 2-bedroom unit, one 1-bedroom unit, one efficiency
- Bathrooms: Three 1-bath units (one bathroom in each unit)
- Heating & cooling: Central heating; Ductless heating; Central air conditioning; Wall or window air conditioning units
- Interior features: Thermostat; Window treatments; Wood-burning fireplace
- Laundry & utility: No in-unit laundry (listed as None)
Neighborhood map
What this means for you Summary
Snapshot
- This is a 3 × 3-bed/3.0-bath units multifamily listed at $475k.
Deal economics
- At list price, monthly cash flow is $2k ($24k/yr) — positive. Per door: $671/mo.
- The deal already cash-flows at list — no discount required.
- Meets the 1% rule at list price ($7k rent vs $475k).
- Recommended offer: $461k (3.0% below list) — sets the bar for market timing.
- Cap rate 11.4% vs local median 2.6% in St. Petersburg — top-decile yield for the area; either an underpriced asset or a hidden risk that comps aren't pricing in. Stress-test before assuming the spread holds.
Location & tenants
- Location reads: area grade B — affects rentability + tenant quality, not the cash-flow math above.
- Pinellas (suburban): math 51% / reading 51% proficiency, ranked #31 of 73 in FL (top 42%) — acceptable for families but not a draw, mixed tenant base, ~2y average lease.
- Market conditions: Rents rising (+3.4%/yr); 242 active listings in the ZIP; solid renter incomes; 2,676 units permitted in Pinellas County in 2024 (1,422 in 5+ unit buildings).
- At $6,511/mo this rent would consume 72% of the median local household income ($108k/yr) (locally 632% of renters already pay >50% of income on rent) — very limited rent-growth headroom before tenants either downsize or default.
Forward outlook
- Local home prices are declining (-3.0%/yr); year-one equity from $3k of loan paydown is wiped out by about $14k of value loss. Plan a longer hold.
- Pinellas County population projected at +14% by 2050 — modest demand growth; plan on rents tracking national, not racing it.
- At projected returns (-3.0% appreciation + 3.4% rent growth), your $133k cash investment doubles in ~7 years — after that, you're playing with house money.
Negotiation context
- It's been on market 41 days — a 3% lower offer ($461k) is reasonable based on typical stale-listing flexibility.
- 4 sale attempts since 12y ago with the ask held roughly flat each time — persistent listings suggest the price (not the market) is what's stuck; bring a comps-based counter.
- Current owner paid $250k; list at $475k implies a 90% gain — meaningful room to come down on a strong offer.
Risks & watch-outs
- Watch-outs: built in 1925 — expect roof / HVAC / electrical / plumbing capex.
- Climate carrying-cost: severe wind risk, 99% chance of damaging wind over 30y; extreme-heat days projected 7→26/yr by 2055 (HVAC capex compounding) — expect insurance premiums to compound above CPI over the hold.
Questions for the listing agent
- It's been on market 41 days. Have you received any prior offers? Is the seller open to a 3% concession, seller financing, or rate buy-down credit?
- Can we see the unit-by-unit rent roll, current vacancy, and any below-market leases? What's the average tenancy length?
- What capital expenditures (roof, boiler, parking lot, exteriors) have been made in the last 5 years, and what's planned in the next 2?
- Built in 1925 — when were the roof, HVAC, electrical panel, plumbing, and water heater last replaced?
- Is there a deadline driving the sale (1031 exchange, divorce, estate, relocation)? That informs how much negotiation room exists.
- What's the average days-on-market for RENTAL listings here right now (not sales)? A rising rental-DOM trend means longer vacancies and softer asking-rent achievability than the comps imply.
- What's the recent tenant-quality profile in this submarket — average credit score on applications, eviction rate, late-payment / NSF rate, and stable-employment percentage? A property-management company in the area should have these aggregated.
- How much new apartment / multifamily construction is in the pipeline within 1–3 miles? Heavy new supply (>2% of stock underway) typically softens rents 12–24 months out; light construction supports rent growth.
Investment metrics
- 1% rule
- 1.37% ✓
- Cap rate
- 11.38%
- Cash-on-cash
- 18.16%
- DSCR
- 1.81
- GRM
- 6.1
CMA / ARV
No comps found within radius.
Projected returns pro-forma
-3.0% appreciation · 3.43% rent growth · sell at horizon
- IRR
- 10.2%
- Equity multiple
- 1.41×
- Total profit
- $54,029
- Equity at exit
- $70,824
- IRR
- 19.7%
- Equity multiple
- 2.68×
- Total profit
- $223,814
- Equity at exit
- $41,069
Cash invested: $133,000 (down + closing). Projections, not guarantees.
Landlord ↔ Tenant lean methodology
- Overall (STATE)
- 87 Strongly Landlord-Friendly
- State Florida
- 87 Strongly Landlord-Friendly · R+3
- County
- — inherits STATE
- City
- — inherits STATE
ZIP-level market 33704
- Rents YoY
- 3.4%
- Active inventory
- 242
- Price-to-rent
- 18.2×
Monthly cashflow live
- Estimated rent
- $6,511 high interval (Pro) →
- Mortgage (P&I)
- −$2,491
- Tax from tax record
- −$443 /mo · $5,310/yr
- Insurance
- −$198
- HOA
- −$0
- Vacancy / Maint / Mgmt
- −$1,367
- Net cashflow
- $2,012
Break-even live
Sensitivity live
| Price | -10% $2,281 | -5% $2,147 | +0% $2,012 | +5% $1,878 | +10% $1,743 |
|---|---|---|---|---|---|
| Rent | -10% $1,498 | -5% $1,755 | +0% $2,012 | +5% $2,270 | +10% $2,527 |
| Rate | -1.0pp $2,252 | -0.5pp $2,133 | base $2,012 | +0.5pp $1,889 | +1.0pp $1,764 |
3-unit breakdown (identical units grouped — click to expand)
| Units | Beds | Baths | Est. rent |
|---|---|---|---|
| 3× units | 3 | 3 | $6,510 |
| #1 | 3 | 3 | $2,170 |
| #2 | 3 | 3 | $2,170 |
| #3 | 3 | 3 | $2,170 |
| Total (3 units) | $6,511 | ||
UW: 25.0% down · 7.5% · 30yr · 1.5% tax · 5.0% vac · 8.0% maint · 8.0% mgmt
Financing live
Cash to close
- Down payment
- $118,750
- Closing costs
- $14,250
- Reserves months
- —
- Total cash needed
- —
Loan-product check · same deal, 3 products live
Conventional
25% down · 7.5% · 30yr
- Down + closing
- —
- Monthly P&I
- —
- Monthly cashflow
- —
- DSCR
- —
- Eligible?
- —
Personal DTI + credit; lowest rate.
DSCR
20% down · 8.5% · 30yr
- Down + closing
- —
- Monthly P&I
- —
- Monthly cashflow
- —
- DSCR
- —
- Eligible?
- —
No personal income docs; deal must DSCR.
Hard money
10% down · 12.0% · 12mo
- Down + closing
- —
- Monthly P&I
- —
- Monthly cashflow
- —
- DSCR
- —
- Eligible?
- —
Short-term bridge; refi at stabilization.
Listing history 27 events
-
2026-06-18days on market $475,000 Active 41 DOM
-
2026-06-17days on market $475,000 Active 40 DOM
-
2026-06-16days on market $475,000 Active 39 DOM
-
2026-06-15days on market $475,000 Active 38 DOM
-
2026-06-13days on market $475,000 Active 36 DOM
-
2026-06-09days on market $475,000 Active 32 DOM
-
2026-06-08days on market $475,000 Active 31 DOM
-
2026-06-07days on market $475,000 Active 30 DOM
-
2026-06-04days on market $475,000 Active 27 DOM
-
2026-06-03days on market $475,000 Active 26 DOM
-
2026-06-01days on market $475,000 Active 24 DOM
-
2026-05-31days on market $475,000 Active 23 DOM
-
2026-05-18price $489,000
-
2026-05-08$499,000 Active
-
2018-08-07soldstatus $250,000
-
2014-07-23historical
-
2014-06-14status Active
-
2014-06-10historical
-
2014-04-07status Active
-
2014-03-29historical
-
2014-02-27$165,000 Active
-
2001-12-17soldstatus $95,000
-
1997-12-19soldstatus $46,400
-
1996-12-24soldstatus $59,900
-
1994-09-29soldstatus $28,900
-
1986-11-17soldstatus $49,500
-
1986-11-01soldstatus $49,500
ⓘ Source: listings_history table (triggers on properties + properties_extension) + one-shot
backfill from property_details.listing_events for pre-trigger history.
Tax reassessment forecast FL · Resets to sale price
- Current annual tax
- $5,310 · $443/mo
- Projected year-2 tax
- $5,310 · $443/mo
- Expected delta
- $0/yr ($0/mo · 0.0%)
ⓘ Screening estimate from a state-policy table — verify with the county assessor before closing.
Climate risk First Street
- Flood 1/10 Low FEMA zone X (unshaded) · 0% chance over 30 yrs
- Wildfire 1/10 Low
- Heat 10/10 Extreme 7 d/yr ≥106°F today · 26 d/yr by 30 yrs out
- Wind 10/10 Extreme 99% chance of damaging wind over 30 yrs
- Air quality 4/10 Moderate 4 unhealthy d/yr today · 4 by 30 yrs out
Nearby sold comps map
Loading sold comps map…
Walkable amenities ~0.75 mi
Loading nearby amenities…
Taxation est. · year 1
- Rental income
- $78,132
- − Mortgage interest
- −$26,607
- − Property taxes
- −$5,310
- − Insurance
- −$2,375
- − Repairs & maintenance
- −$6,251
- − Management
- −$6,251
- − Depreciation
- −$13,818
- Taxable income
- $17,520
- Est. tax owed @ 24.0%
- −$4,205
- After-tax cash flow
- $19,943/yr
For passive investors: Depreciation is non-cash, so a rental often shows a tax loss while cash-flowing — sheltering income. Rental losses are passive: they offset passive income freely, and up to $25,000/yr can offset ordinary (W-2) income if you actively participate and your MAGI is under $100k (phasing out to $0 by $150k); unused losses carry forward. On sale, claimed depreciation is recaptured at up to 25%, and gains may owe capital-gains tax (a 1031 exchange can defer both). Figures are a year-1 estimate at your 24.0% rate — not tax advice; consult a CPA.
Schools (NCES district)
- District
- Pinellas
- NCES district ID
- 1201560
- Math proficiency
- 51% ▼ -5.00%
- Reading proficiency
- 51% ▼ -3.00%
- Median HH income
- $46,270
- Composite
- 43.27/100
- National rank
- #3046
- State rank
- #31 of 73 in FL
Livability — St. Petersburg
No livability data for this city. (Only ~50 U.S. cities are tracked.)
Census & demographics
- Census place
- St. Petersburg, FL
- County
- Pinellas County · 939,478 people
- City population
- 249,151
- Metro
- Tampa-St. Petersburg-Clearwater, FL
- Population (ZIP)
- 16,232
- Household income
- $107,889
- Rent vs Own
- Severe rent burden
- 632.0
Population outlook (Pinellas County) Hauer SSP2
- Today (2025)
- 1,027,532 people
- By 2030
- 1,063,586 · +3.5%
- By 2040
- 1,125,020 · +9.5%
- By 2050
- 1,168,637 · +13.7%
- By 2075
- 1,265,188 · +23.1%
- By 2100
- 1,260,357 · +22.7%
Race, ethnicity, and origin ACS 2023
- Neighborhood character
- Predominantly White (83%)
- Race & ethnicity
- White 83% Two or more races 8% Hispanic / Latino 7% Black 4% Asian 2%
- Hispanic origin (detail)
- Mexican 1% Puerto Rican 1% Cuban 1%
- Common ancestry
- Lithuanian 4% Slovak 4% Romanian 4%
- Foreign-born
- 9% · Canada, Jamaica, Vietnam
- Languages at home
- 92% English-only · Spanish 3% German/W. Germanic 1% French/Haitian/Cajun 1%
Political lean MEDSL · Pinellas
- 2024 margin
- Lean R (+5.2) · D 46.9% · R 52.1%
- 2008→2024 swing
- -13.5pp toward R · 2008: 8.3pp · 2024: -5.2pp
- All cycles
- 2024: R+5.2 2020: D+0.2 2016: R+1.1 2012: D+5.6 2008: D+8.3
Not yet ingested
- Civics
- —
Market trends
- HPI YoY
- ▼ -822.13%
- Current HPI
- 473.0888
- Rent YoY
- ▲ 3.43%
- Metro
- Tampa-St. Petersburg-Clearwater, FL
- State GDP YoY
- ▲ 3.28%
- F500 in state
- 36
Industry mix (Fortune 500 HQ in FL)
| Industry | F500 HQs | Revenue |
|---|---|---|
| Industrial Technology | 2 | $29B |
|
||
| Insurance | 2 | $17B |
|
||
| Retail | 1 | $60B |
|
||
| Technology Distribution | 1 | $58B |
|
||
| Homebuilding | 1 | $35B |
|
||
| Technology Manufacturing | 1 | $35B |
|
||
Price history
+887.9% since first listed15 events — show timeline
- 2026-05-18 Price Changed $489,000 Stellar MLS as Distributed by MLS Grid
- 2026-05-08 Listed $499,000 Stellar MLS as Distributed by MLS Grid
- 2018-08-07 Sold (Public Records) $250,000 Public Records
- 2014-07-23 Listing Removed — Stellar MLS as Distributed by MLS Grid
- 2014-06-14 Relisted — Stellar MLS as Distributed by MLS Grid
- 2014-06-10 Listing Removed — Stellar MLS as Distributed by MLS Grid
- 2014-04-07 Relisted — Stellar MLS as Distributed by MLS Grid
- 2014-03-29 Listing Removed — Stellar MLS as Distributed by MLS Grid
- 2014-02-27 Listed $165,000 Stellar MLS as Distributed by MLS Grid
- 2001-12-17 Sold (Public Records) $95,000 Public Records
- 1997-12-19 Sold (Public Records) $46,400 Public Records
- 1996-12-24 Sold (Public Records) $59,900 Public Records
- 1994-09-29 Sold (Public Records) $28,900 Public Records
- 1986-11-17 Sold (Public Records) $49,500 Public Records
- 1986-11-01 Sold (Public Records) $49,500 Public Records
Property tax history
+10.9%/yrLatest (2025): $5,310 · +15.8% YoY. Source: county tax records.
Cash-flow waterfall
monthlySold comps — $/sqft
last 12 mo · ≤1 miLoading sold comps…