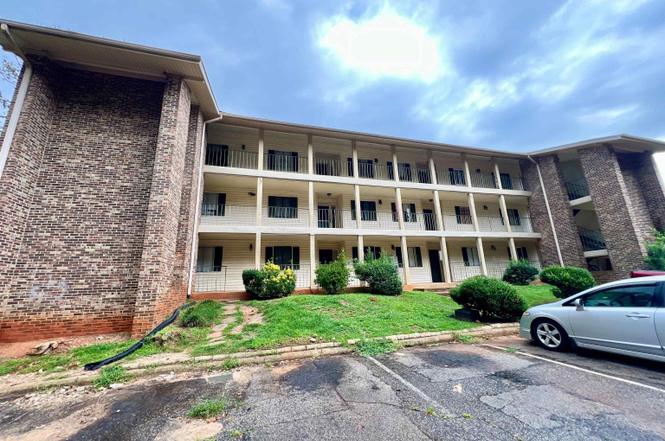
1208 Bush River Rd Unit C3 · Columbia, SC
Flood risk 1/10 · Minimal
- FEMA flood zone
- X (unshaded)
- Chance of flooding over 30 yrs
- 0.0%
- Est. flood insurance / yr
- —
Fire risk 2/10 · Minimal
- Est. fire insurance / yr
- $783 – $1,453
Heat risk 7/10 · Major
- Hot days now (above 108°F)
- 7 days/yr
- Hot days in 30 yrs
- 16 days/yr
Wind risk 6/10 · Moderate
- Chance of severe wind over 30 yrs
- 62.0%
Air-quality risk No data
- Unhealthy air days now
- —
- Unhealthy air days in 30 yrs
- —
Risk factors via First Street. Map © Google.
Why this score? — see what drove the B grade
The composite is a weighted blend of 9 inputs, each scored 0–100. Each bar is that input's sub-score; the figure is the points it added to the 100-point composite (weight × sub-score).
- Cash flow +30.0/30.0
- 1% rule +10.0/10.0
- DSCR +10.0/10.0
- ARV discount +7.5/15.0
- Appreciation +5.0/10.0
- Livability +3.9/5.0
- Schools +2.6/10.0
- Rent growth +2.5/5.0
- Condition / age +2.5/5.0
$51,000
🖨 Deal sheet 📄 Offer letter ✓ Due diligence
Listing remarks
"Investor Special". First floor unit. This two bedroom unit is conveniently located to I-26 & I-20, Harbison shopping/ dining and downtown Columbia. In unit laundry. Disclaimer: CMLS has not reviewed and, therefore, does not endorse vendors who may appear in listings. "Sold as Is"
Key facts
- Recently updated
- First floor unit
- In unit laundry
Tags
Property features AI
Finance
- HOA & community: Homeowners association present
Exterior
- Parking: 1 parking space
- Utilities: Public sewer; Public water
- Home design: Condominium unit (multifamily building)
- Construction: Slab foundation
- Exterior features: Partial brick exterior above foundation; Paved road access; Public water
Interior
- Bedrooms: Master bedroom on the main level
- Bathrooms: 1 full bathroom
- Heating & cooling: Central heating; Central cooling
- Interior features: Central heating and central air
Neighborhood map
What this means for you Summary
Snapshot
- This is a 2-bed/1.0-bath condo listed at $51k.
Deal economics
- At list price, monthly cash flow is $248 ($3k/yr) — positive.
- The deal already cash-flows at list — no discount required.
- Meets the 1% rule at list price ($1k rent vs $51k).
- Recommended offer: $45k (12.0% below list) — sets the bar for market timing.
- Cap rate 12.1% vs local median 5.0% in Columbia — top-decile yield for the area; either an underpriced asset or a hidden risk that comps aren't pricing in. Stress-test before assuming the spread holds.
Location & tenants
- Location reads 78/100 on livability (#18 in SC, #2,436 nationally) — a middle-class / working-renter tenant base. Strengths: amenities A+, commute A+, cost of living A+; Watch: schools D+, employment D, crime F.
- Richland 01 (urban): math 26% / reading 36% proficiency, ranked #54 of 80 in SC (top 68%) — families likely to look elsewhere, expect single-tenant / working-renter base with shorter leases; 64% free/reduced lunch — lower-income household profile, screen leases tightly.
- Market conditions: 4 active listings in the ZIP; 13 comparable units currently listed for rent nearby; rentals at typical pace (median 15d on market — plan ~3-4 weeks tenant-placement turnaround); 3,472 units permitted in Richland County in 2024 (1,096 in 5+ unit buildings).
Forward outlook
- In year one you build about $2k of equity ($353 loan paydown + $2k appreciation (3.0% local appreciation)).
- Richland County population projected at +30% by 2050 — long-run rental-demand tailwind backs the buy-and-hold thesis.
- At projected returns (3.0% appreciation + 3.0% rent growth), your $14k cash investment doubles in ~3 years — after that, you're playing with house money.
Negotiation context
- It's been on market 173 days — a 12% lower offer ($45k) is reasonable based on typical stale-listing flexibility.
- 3 sale attempts since 2y ago; this cycle's ask has dropped $16k (23%) from the opening price — seller is motivated, your offer sets the floor, not the list.
- Current owner paid $37k; 37% above their basis — modest negotiation headroom, anchor on the comps not their cost.
Risks & watch-outs
- Watch-outs: HOA is 27% of rent.
- Climate carrying-cost: major wind risk, 62% chance of damaging wind over 30y; extreme-heat days projected 7→16/yr by 2055 (HVAC capex compounding) — expect insurance premiums to compound above CPI over the hold.
Questions for the listing agent
- It's been on market 173 days. Have you received any prior offers? Is the seller open to a 12% concession, seller financing, or rate buy-down credit?
- Built in 1973 — when were the roof, HVAC, electrical panel, plumbing, and water heater last replaced?
- What does the HOA fee cover, when was the last increase, and are there any pending special assessments or reserve-fund shortfalls?
- Any open or pending special assessments — roof, HVAC, plumbing, elevator, façade? What's the per-unit balance and payoff schedule, and is the seller paying it off at close or rolling it to the buyer?
- Why hasn't it sold? Are there any deal-killer items the seller is aware of (foundation, flood, title, zoning, code violations)?
- Is there a deadline driving the sale (1031 exchange, divorce, estate, relocation)? That informs how much negotiation room exists.
- Schools are D-rated, which usually means shorter tenancies and higher turnover. Who's the typical renter profile here, and what's been the actual vacancy rate?
- Crime grade is F in this area — have there been break-ins, vandalism, or insurance claims at this property in the last 3 years? What carrier currently insures it and at what premium?
- What's the average days-on-market for RENTAL listings here right now (not sales)? A rising rental-DOM trend means longer vacancies and softer asking-rent achievability than the comps imply.
- What's the recent tenant-quality profile in this submarket — average credit score on applications, eviction rate, late-payment / NSF rate, and stable-employment percentage? A property-management company in the area should have these aggregated.
- How much new apartment / multifamily construction is in the pipeline within 1–3 miles? Heavy new supply (>2% of stock underway) typically softens rents 12–24 months out; light construction supports rent growth.
Investment metrics
- 1% rule
- 2.20% ✓
- Cap rate
- 12.14%
- Cash-on-cash
- 20.88%
- DSCR
- 1.93
- GRM
- 3.8
CMA / ARV
No comps found within radius.
Projected returns pro-forma
3.0% appreciation · 3.0% rent growth · sell at horizon
- IRR
- 27.3%
- Equity multiple
- 2.55×
- Total profit
- $22,161
- Equity at exit
- $22,932
- IRR
- 28.1%
- Equity multiple
- 4.99×
- Total profit
- $56,984
- Equity at exit
- $35,341
Cash invested: $14,280 (down + closing). Projections, not guarantees.
Landlord ↔ Tenant lean methodology
- Overall (STATE)
- 90 Strongly Landlord-Friendly
- State South Carolina
- 90 Strongly Landlord-Friendly · R+6
- County
- — inherits STATE
- City
- — inherits STATE
ZIP-level market 29210-7520
- Active inventory
- 4
- Price-to-rent
- 3.8×
Monthly cashflow live
- Estimated rent
- $1,122 high interval (Pro) →
- Mortgage (P&I)
- −$267
- Tax from tax record
- −$50 /mo · $598/yr
- Insurance
- −$21
- HOA est. from 4 same-building comps
- −$299
- Vacancy / Maint / Mgmt
- −$236
- Net cashflow
- $248
Break-even live
UW: 25.0% down · 7.5% · 30yr · 1.5% tax · 5.0% vac · 8.0% maint · 8.0% mgmt
Financing live
Cash to close
- Down payment
- $12,750
- Closing costs
- $1,530
- Reserves months
- —
- Total cash needed
- —
Loan-product check · same deal, 3 products live
Conventional
25% down · 7.5% · 30yr
- Down + closing
- —
- Monthly P&I
- —
- Monthly cashflow
- —
- DSCR
- —
- Eligible?
- —
Personal DTI + credit; lowest rate.
DSCR
20% down · 8.5% · 30yr
- Down + closing
- —
- Monthly P&I
- —
- Monthly cashflow
- —
- DSCR
- —
- Eligible?
- —
No personal income docs; deal must DSCR.
Hard money
10% down · 12.0% · 12mo
- Down + closing
- —
- Monthly P&I
- —
- Monthly cashflow
- —
- DSCR
- —
- Eligible?
- —
Short-term bridge; refi at stabilization.
Rent comps 13 comps
| Address | Beds | Baths | Sqft | Rent | $/sqft | DOM | Units | Dist |
|---|---|---|---|---|---|---|---|---|
| 1208 Bush River Rd Columbia, SC | 2.0 | 1.0–2.0 | 1000 | $1,072 | $1.07 | 23d | 3 | 0.04mi |
| 1208 Bush River Rd Columbia, SC | 2.0 | 1.0–2.0 | 1050 | $1,050 | $1.00 | 14d | 4 | 0.04mi |
| 716 Zimalcrest Dr Columbia, SC | 2.0 | 1.0–2.0 | 634 | $1,224 | $1.93 | 11d | 24 | 0.88mi |
| 114 Menlo Dr Unit BG0114 Columbia, SC | 3.0 | 2.0 | 1300 | $1,675 | $1.29 | 19d | 1 | 0.90mi |
| 825 Menlo Dr Columbia, SC | 1.0–4.0 | 1.0–2.0 | 1083 | $1,300 | $1.20 | 19d | 3 | 0.90mi |
| 324 Menlo Dr Unit BG0324 Columbia, SC | 2.0 | 1.0 | 912 | $1,175 | $1.29 | 14d | 1 | 0.92mi |
| 921 Old Manor Rd Unit BG0921 Columbia, SC | 2.0 | 1.0 | 912 | $1,100 | $1.21 | 23d | 1 | 0.93mi |
| 900 Gracern Rd Columbia, SC | 1.0–3.0 | 1.0–2.0 | 1029 | $1,414 | $1.37 | 23d | 5 | 1.07mi |
| 961 Zimalcrest Dr Columbia, SC | 1.0–3.0 | 1.0–2.0 | 915 | $1,062 | $1.16 | 11d | 9 | 1.30mi |
| 1200 Saint Andrews Rd Columbia, SC | 1.0–2.0 | 1.0–2.0 | 867 | $1,360 | $1.57 | 11d | 32 | 1.34mi |
| 200 Saluda River Rd Columbia, SC | 1.0–2.0 | 1.0–1.5 | 900 | $1,120 | $1.24 | 11d | 8 | 1.37mi |
| 1340 Longcreek Dr Columbia, SC | 1.0–2.0 | 1.0–2.0 | 875 | $1,180 | $1.35 | 11d | 25 | 1.42mi |
| 1401 Longcreek Dr Columbia, SC | 1.0–3.0 | 1.0–2.0 | 1000 | $1,116 | $1.12 | 14d | 9 | 1.47mi |
HOA detail condo
- Monthly dues
- $0 · $0/yr
- Assessments
- None detected in remarks — confirm with the listing agent.
Listing history 19 events
-
2026-06-18days on market $51,000 Active 173 DOM
-
2026-06-17days on market $51,000 Active 172 DOM
-
2026-06-16days on market $51,000 Active 171 DOM
-
2026-06-15days on market $51,000 Active 170 DOM
-
2026-06-14days on market $51,000 Active 168 DOM
-
2026-06-13days on market $51,000 Active 167 DOM
-
2026-06-10days on market $51,000 Active 165 DOM
-
2026-06-09days on market $51,000 Active 164 DOM
-
2026-06-08days on market $51,000 Active 163 DOM
-
2026-06-07pricedays on market $51,000 Active 162 DOM
-
2026-04-01price $55,500
-
2026-01-19status Active
-
2025-12-17status Pending
-
2025-11-19$66,500 Active
-
2024-04-30status Pending
-
2024-04-15historical Active - Contingent
-
2024-03-07$65,000 Active
-
1995-02-01soldstatus $37,200
-
1982-11-01soldstatus $30,850
ⓘ Source: listings_history table (triggers on properties + properties_extension) + one-shot
backfill from property_details.listing_events for pre-trigger history.
Tax reassessment forecast SC · Resets to sale price
- Current annual tax
- $598 · $50/mo
- Projected year-2 tax
- $598 · $50/mo
- Expected delta
- $0/yr ($0/mo · 0.0%)
ⓘ Screening estimate from a state-policy table — verify with the county assessor before closing.
Climate risk First Street
- Flood 1/10 Low FEMA zone X (unshaded) · 0% chance over 30 yrs
- Wildfire 2/10 Low
- Heat 7/10 Severe 7 d/yr ≥108°F today · 16 d/yr by 30 yrs out
- Wind 6/10 Major 62% chance of damaging wind over 30 yrs
Nearby sold comps map
Loading sold comps map…
Walkable amenities ~0.75 mi
Loading nearby amenities…
Taxation est. · year 1
- Rental income
- $13,458
- − Mortgage interest
- −$2,857
- − Property taxes
- −$598
- − Insurance
- −$255
- − Repairs & maintenance
- −$1,077
- − Management
- −$1,077
- − HOA
- −$3,588
- − Depreciation
- −$1,484
- Taxable income
- $2,523
- Est. tax owed @ 24.0%
- −$606
- After-tax cash flow
- $2,376/yr
For passive investors: Depreciation is non-cash, so a rental often shows a tax loss while cash-flowing — sheltering income. Rental losses are passive: they offset passive income freely, and up to $25,000/yr can offset ordinary (W-2) income if you actively participate and your MAGI is under $100k (phasing out to $0 by $150k); unused losses carry forward. On sale, claimed depreciation is recaptured at up to 25%, and gains may owe capital-gains tax (a 1031 exchange can defer both). Figures are a year-1 estimate at your 24.0% rate — not tax advice; consult a CPA.
Schools (NCES district)
- District
- Richland 01
- NCES district ID
- 4503360
- Math proficiency
- 26% ▼ -7.00%
- Reading proficiency
- 36% ▼ -5.00%
- Median HH income
- $38,931
- Composite
- 25.94/100
- National rank
- #7335
- State rank
- #54 of 80 in SC
Livability — Columbia
- Score
- 78/100
- State rank
- #18
- US rank
- #2436
Category grades
Schools grade is shown separately in the Schools card above.
Census & demographics
No demographic data for this ZIP.
Market trends
- HPI YoY
- —
- Current HPI
- —
- Rent YoY
- —
- Metro
- —
- State GDP YoY
- ▲ 4.51%
- F500 in state
- 2
Industry mix (Fortune 500 HQ in SC)
| Industry | F500 HQs | Revenue |
|---|---|---|
| Packaging | 1 | $7B |
|
||
Price history
+79.9% since first listed9 events — show timeline
- 2026-04-01 Price Changed $55,500 Consolidated MLS
- 2026-01-19 Relisted — Consolidated MLS
- 2025-12-17 Pending — Consolidated MLS
- 2025-11-19 Listed $66,500 Consolidated MLS
- 2024-04-30 Pending — Consolidated MLS
- 2024-04-15 Contingent — Consolidated MLS
- 2024-03-07 Listed $65,000 Consolidated MLS
- 1995-02-01 Sold (Public Records) $37,200 Public Records
- 1982-11-01 Sold (Public Records) $30,850 Public Records
Property tax history
-2.4%/yrLatest (2024): $598 · +0.1% YoY. Source: county tax records.
Cash-flow waterfall
monthlySold comps — $/sqft
last 12 mo · ≤1 miLoading sold comps…