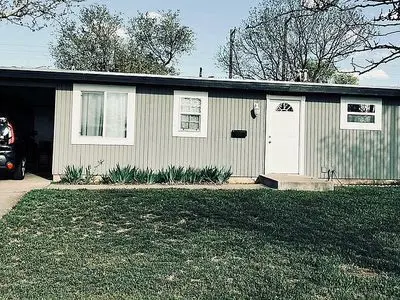
221 Cherry Ave · Lubbock, TX
Flood risk 1/10 · Minimal
- FEMA flood zone
- X (unshaded)
- Chance of flooding over 30 yrs
- 0.0%
- Est. flood insurance / yr
- $507 – $1,088
Fire risk 5/10 · Moderate
- Est. fire insurance / yr
- $1,222 – $2,270
Heat risk 5/10 · Moderate
- Hot days now (above 100°F)
- 7 days/yr
- Hot days in 30 yrs
- 19 days/yr
Wind risk 2/10 · Minimal
- Chance of severe wind over 30 yrs
- 1.0%
Air-quality risk 2/10 · Minimal
- Unhealthy air days now
- 1 days/yr
- Unhealthy air days in 30 yrs
- 1 days/yr
Risk factors via First Street. Map © Google.
Why this score? — see what drove the C- grade
The composite is a weighted blend of 9 inputs, each scored 0–100. Each bar is that input's sub-score; the figure is the points it added to the 100-point composite (weight × sub-score).
- Cash flow +21.0/30.0
- ARV discount +7.5/15.0
- DSCR +6.7/10.0
- 1% rule +5.4/10.0
- Livability +4.0/5.0
- Schools +3.1/10.0
- Rent growth +2.9/5.0
- Condition / age +2.5/5.0
- Appreciation +0.0/10.0
$92,000
🖨 Deal sheet (PDF) 📄 Offer letter ✓ Due diligence
Listing remarks
Completely remodeled in the last 3 years. New windows, doors, floors, bathroom, kitchen, paint. Plumbing all new all the way to alley connection. New electric. New heater/AC/ still under warranty including parts & amp; water heater. Stainless appliances and washer/dryer stay. Additional square footage not included in total sq ft. Also nice storage shed in back yard.
Key facts
- New floors
- Remodeled
- New kitchen
Tags
Property features AI
Exterior
- Home design: Built in 1959
- Exterior features: Located in the Parkway and Cherry Point subdivision
Interior
- Interior features: Living area of 975
Neighborhood map
What this means for you Summary
Snapshot
- This is a 3-bed/1.0-bath single-family listed at $92k.
Deal economics
- At list price, monthly cash flow is $130 ($2k/yr) — positive.
- The deal already cash-flows at list — no discount required.
- Meets the 1% rule at list price ($953 rent vs $92k).
- Recommended offer: $91k (1.5% below list) — sets the bar for market timing.
Location & tenants
- Location reads 80/100 on livability (#37 in TX, #1,749 nationally) — a professional / high-income tenant draw. Strengths: commute A+, cost of living A+, housing A+; Watch: employment C-, schools D+, crime F.
- Lubbock ISD (urban): math 36% / reading 39% proficiency, ranked #481 of 826 in TX (top 58%) — families likely to look elsewhere, expect single-tenant / working-renter base with shorter leases; 60% free/reduced lunch — lower-income household profile, screen leases tightly.
- Market conditions: Rents rising (+1.5%/yr); 165 active listings in the ZIP; 26 comparable units currently listed for rent nearby; rentals at typical pace (median 22d on market — plan ~3-4 weeks tenant-placement turnaround); 2,219 units permitted in Lubbock County in 2024 (252 in 5+ unit buildings).
Forward outlook
- Local home prices are declining (-3.0%/yr); year-one equity from $636 of loan paydown is wiped out by about $3k of value loss. Plan a longer hold.
- Lubbock County population projected at +39% by 2050 — long-run rental-demand tailwind backs the buy-and-hold thesis.
Negotiation context
- It's been on market 20 days — a 2% lower offer ($91k) is reasonable based on typical stale-listing flexibility.
Risks & watch-outs
- Watch-outs: built in 1959 — expect roof / HVAC / electrical / plumbing capex.
- Climate carrying-cost: moderate wildfire risk; extreme-heat days projected 7→19/yr by 2055 (HVAC capex compounding) — expect insurance premiums to compound above CPI over the hold.
Questions for the listing agent
- Built in 1959 — when were the roof, HVAC, electrical panel, plumbing, and water heater last replaced?
- Is there a deadline driving the sale (1031 exchange, divorce, estate, relocation)? That informs how much negotiation room exists.
- Schools are D-rated, which usually means shorter tenancies and higher turnover. Who's the typical renter profile here, and what's been the actual vacancy rate?
- Crime grade is F in this area — have there been break-ins, vandalism, or insurance claims at this property in the last 3 years? What carrier currently insures it and at what premium?
- What's the average days-on-market for RENTAL listings here right now (not sales)? A rising rental-DOM trend means longer vacancies and softer asking-rent achievability than the comps imply.
- What's the recent tenant-quality profile in this submarket — average credit score on applications, eviction rate, late-payment / NSF rate, and stable-employment percentage? A property-management company in the area should have these aggregated.
- How much new for-sale + rental construction is in the pipeline within 1–3 miles? Heavy new supply typically softens prices + rents 12–24 months out; constrained supply supports both.
Investment metrics
- 1% rule
- 1.04% ✓
- Cap rate
- 7.99%
- Cash-on-cash
- 6.07%
- DSCR
- 1.27
- GRM
- 8.0
CMA / ARV
No comps found within radius.
Projected returns pro-forma
-3.0% appreciation · 1.52% rent growth · sell at horizon
- IRR
- -8.6%
- Equity multiple
- 0.69×
- Total profit
- $-7,997
- Equity at exit
- $13,717
- IRR
- -1.1%
- Equity multiple
- 0.93×
- Total profit
- $-1,817
- Equity at exit
- $7,954
Cash invested: $25,760 (down + closing). Projections, not guarantees.
Landlord ↔ Tenant lean methodology
- Overall (STATE)
- 87 Strongly Landlord-Friendly
- State Texas
- 87 Strongly Landlord-Friendly · R+5
- County
- — inherits STATE
- City
- — inherits STATE
ZIP-level market 79403
- Home prices YoY
- -9.0%
- Rents YoY
- 1.5%
- Active inventory
- 165
- Price-to-rent
- 8.0×
Monthly cashflow live
- Estimated rent
- $953 high interval (Pro) →
- Mortgage (P&I)
- −$482
- Tax from tax record
- −$101 /mo · $1,217/yr
- Insurance
- −$38
- HOA
- −$0
- Vacancy / Maint / Mgmt
- −$200
- Net cashflow
- $130
Break-even live
Sensitivity live
| Price | -10% $182 | -5% $156 | +0% $130 | +5% $104 | +10% $78 |
|---|---|---|---|---|---|
| Rent | -10% $55 | -5% $93 | +0% $130 | +5% $168 | +10% $206 |
| Rate | -1.0pp $177 | -0.5pp $154 | base $130 | +0.5pp $107 | +1.0pp $82 |
UW: 25.0% down · 7.5% · 30yr · 1.5% tax · 5.0% vac · 8.0% maint · 8.0% mgmt
Financing live
Cash to close
- Down payment
- $23,000
- Closing costs
- $2,760
- Reserves months
- —
- Total cash needed
- —
Loan-product check · same deal, 3 products live
Conventional
25% down · 7.5% · 30yr
- Down + closing
- —
- Monthly P&I
- —
- Monthly cashflow
- —
- DSCR
- —
- Eligible?
- —
Personal DTI + credit; lowest rate.
DSCR
20% down · 8.5% · 30yr
- Down + closing
- —
- Monthly P&I
- —
- Monthly cashflow
- —
- DSCR
- —
- Eligible?
- —
No personal income docs; deal must DSCR.
Hard money
10% down · 12.0% · 12mo
- Down + closing
- —
- Monthly P&I
- —
- Monthly cashflow
- —
- DSCR
- —
- Eligible?
- —
Short-term bridge; refi at stabilization.
Rent comps 26 comps
| Address | Beds | Baths | Sqft | Rent | $/sqft | DOM | Units | Dist |
|---|---|---|---|---|---|---|---|---|
| 312 Beech Ave Lubbock, TX | 3.0 | 1.0 | 816 | $695 | $0.85 | 22d | 1 | 0.11mi |
| 312 Beech Ave Lubbock, TX | 3.0 | 1.0 | 816 | $800 | $0.98 | 44d | 1 | 0.11mi |
| 3016 E 3rd St Lubbock, TX | 3.0 | 1.0 | 978 | $695 | $0.71 | 22d | 1 | 0.12mi |
| 2815 E 2nd St Apt 2 Lubbock, TX | 3.0 | 1.0 | 750 | $625 | $0.83 | 14d | 1 | 0.17mi |
| 2726 E 2nd St Lubbock, TX | 3.0 | 1.0 | 816 | $695 | $0.85 | 22d | 1 | 0.19mi |
| 804 David Ave Lubbock, TX | 3.0 | 2.0 | 1028 | $1,049 | $1.02 | 14d | 1 | 0.43mi |
| 1014 David Ave Lubbock, TX | 3.0 | 2.0 | 1028 | $1,030 | $1.00 | 14d | 1 | 0.51mi |
| 1828 E 1st St Lubbock, TX | 3.0 | 1.0 | 1011 | $695 | $0.69 | 22d | 1 | 0.53mi |
| 2608 E Colgate St Lubbock, TX | 3.0 | 1.0 | 990 | $900 | $0.91 | 44d | 1 | 0.60mi |
| 1802 E 2nd St Lubbock, TX | 4.0 | 1.0 | 1096 | $875 | $0.80 | 44d | 1 | 0.62mi |
| 1802 E 2nd St Lubbock, TX | 4.0 | 1.0 | 1096 | $695 | $0.63 | 22d | 1 | 0.62mi |
| 808 Vanda Ave Lubbock, TX | 3.0 | 1.0 | 832 | $695 | $0.84 | 22d | 1 | 0.63mi |
| 3116 E Cornell St Lubbock, TX | 3.0 | 2.0 | 1125 | $1,150 | $1.02 | 22d | 1 | 0.65mi |
| 3118 E Cornell St Lubbock, TX | 3.0 | 2.0 | 1125 | $1,150 | $1.02 | 22d | 1 | 0.65mi |
| 824 Vanda Ave Lubbock, TX | 3.0 | 1.0 | 832 | $750 | $0.90 | 44d | 1 | 0.68mi |
| 2226 E Main St Lubbock, TX | 3.0 | 2.0 | 1100 | $1,150 | $1.05 | 44d | 1 | 0.70mi |
| 2123 E Broadway Unit 2 Lubbock, TX | 3.0 | 1.0 | 963 | $950 | $0.99 | 22d | 1 | 0.74mi |
| 1918 E Cornell St Lubbock, TX | 3.0 | 2.0 | 1028 | $1,080 | $1.05 | 22d | 1 | 0.74mi |
| 2117 E Broadway Unit 1 Lubbock, TX | 3.0 | 1.0 | 963 | $950 | $0.99 | 44d | 1 | 0.75mi |
| 1711 E 1st St Lubbock, TX | 3.0 | 2.0 | 1124 | $900 | $0.80 | 22d | 1 | 0.76mi |
| 1730 E Dartmouth St Unit A Lubbock, TX | 3.0 | 1.0 | 1015 | $695 | $0.68 | 44d | 1 | 0.85mi |
| 1726 E Dartmouth St Unit A Lubbock, TX | 3.0 | 1.0 | 1100 | $1,000 | $0.91 | 22d | 1 | 0.87mi |
| 1726 E Dartmouth St Unit B Lubbock, TX | 3.0 | 1.0 | 1100 | $1,000 | $0.91 | 44d | 1 | 0.87mi |
| 1903 E 15th St Unit B Lubbock, TX | 2.0 | 2.0 | 950 | $1,075 | $1.13 | 14d | 1 | 1.05mi |
| 3621 E 15th Pl Lubbock, TX | 3.0 | 2.0 | 1028 | $1,114 | $1.08 | 44d | 1 | 1.10mi |
| 924 E Emory St Lubbock, TX | 1.0–2.0 | 1.0–2.0 | 865 | $1,008 | $1.17 | 14d | 8 | 1.19mi |
Listing history 15 events
-
2026-06-15days on market $92,000 Active 20 DOM
-
2026-06-14days on market $92,000 Active 18 DOM
-
2026-06-13days on market $92,000 Active 17 DOM
-
2026-06-10days on market $92,000 Active 15 DOM
-
2026-06-09days on market $92,000 Active 14 DOM
-
2026-06-08days on market $92,000 Active 13 DOM
-
2026-06-07days on market $92,000 Active 12 DOM
-
2026-06-05days on market $92,000 Active 9 DOM
-
2026-06-03days on market $92,000 Active 8 DOM
-
2026-06-02days on market $92,000 Active 7 DOM
-
2026-06-01days on market $92,000 Active 6 DOM
-
2026-05-31days on market $92,000 Active 5 DOM
-
2026-05-30days on market $92,000 Active 4 DOM
-
2026-05-26$92,000 Active
-
2017-01-27soldstatus
ⓘ Source: listings_history table (triggers on properties + properties_extension) + one-shot
backfill from property_details.listing_events for pre-trigger history.
Tax reassessment forecast TX · Resets to sale price
- Current annual tax
- $1,217 · $101/mo
- Projected year-2 tax
- $1,684 · $140/mo
- Expected delta
- +$467/yr (+$39/mo · 38.4%)
ⓘ Screening estimate from a state-policy table — verify with the county assessor before closing.
Climate risk First Street
- Flood 1/10 Low FEMA zone X (unshaded) · 0% chance over 30 yrs
- Wildfire 5/10 Major
- Heat 5/10 Major 7 d/yr ≥100°F today · 19 d/yr by 30 yrs out
- Wind 2/10 Low 100% chance of damaging wind over 30 yrs
- Air quality 2/10 Low 1 unhealthy d/yr today · 1 by 30 yrs out
Nearby sold comps map
Loading sold comps map…
Walkable amenities ~0.75 mi
Loading nearby amenities…
Taxation est. · year 1
- Rental income
- $11,431
- − Mortgage interest
- −$5,153
- − Property taxes
- −$1,217
- − Insurance
- −$460
- − Repairs & maintenance
- −$914
- − Management
- −$914
- − Depreciation
- −$2,676
- Taxable income
- $96
- Est. tax owed @ 24.0%
- −$23
- After-tax cash flow
- $1,541/yr
For passive investors: Depreciation is non-cash, so a rental often shows a tax loss while cash-flowing — sheltering income. Rental losses are passive: they offset passive income freely, and up to $25,000/yr can offset ordinary (W-2) income if you actively participate and your MAGI is under $100k (phasing out to $0 by $150k); unused losses carry forward. On sale, claimed depreciation is recaptured at up to 25%, and gains may owe capital-gains tax (a 1031 exchange can defer both). Figures are a year-1 estimate at your 24.0% rate — not tax advice; consult a CPA.
Schools (NCES district)
- District
- Lubbock ISD
- NCES district ID
- 4828500
- Math proficiency
- 36% ▼ -8.00%
- Reading proficiency
- 39% ▼ -1.00%
- Median HH income
- $39,820
- Composite
- 31.44/100
- National rank
- #5984
- State rank
- #481 of 826 in TX
Livability — Lubbock
- Score
- 80/100
- State rank
- #37
- US rank
- #1749
Category grades
Schools grade is shown separately in the Schools card above.
Census & demographics
- Census place
- Lubbock, TX
- County
- Lubbock County · 293,542 people
- City population
- 283,030
- Metro
- Lubbock, TX
- Population (ZIP)
- 16,089
- Household income
- $47,907
- Rent vs Own
- Severe rent burden
- 612.0
Population outlook (Lubbock County) Hauer SSP2
- Today (2025)
- 345,960 people
- By 2030
- 371,449 · +7.4%
- By 2040
- 424,539 · +22.7%
- By 2050
- 481,150 · +39.1%
- By 2075
- 633,467 · +83.1%
- By 2100
- 746,853 · +115.9%
Race, ethnicity, and origin ACS 2023
- Neighborhood character
- Diverse neighborhood (Simpson 0.64)
- Race & ethnicity
- Hispanic / Latino 49% White 26% Black 23% Two or more races 16% Native American 1%
- Hispanic origin (detail)
- Mexican 35%
- Common ancestry
- Slovak 1%
- Foreign-born
- 3% · Canada
- Languages at home
- 74% English-only · Spanish 25%
Political lean MEDSL · Lubbock
- 2024 margin
- Solid R (+39.5) · D 29.7% · R 69.2% · Other 1.0%
- 2008→2024 swing
- -2.8pp toward R · 2008: -36.7pp · 2024: -39.5pp
- All cycles
- 2024: R+39.5 2020: R+32.2 2016: R+38.4 2012: R+40.9 2008: R+36.7
Not yet ingested
- Civics
- —
Market trends
- HPI YoY
- ▼ -17.69%
- Current HPI
- 178.9297
- Rent YoY
- ▲ 1.52%
- Metro
- Lubbock, TX
- State GDP YoY
- ▲ 3.95%
- F500 in state
- 110
Industry mix (Fortune 500 HQ in TX)
| Industry | F500 HQs | Revenue |
|---|---|---|
| Energy | 16 | $1,198B |
|
||
| Technology | 5 | $198B |
|
||
| Engineering / Construction | 4 | $72B |
|
||
| Energy Services | 3 | $60B |
|
||
| Utilities | 3 | $41B |
|
||
| Healthcare | 2 | $330B |
|
||
Price history
2 events — show timeline
- 2026-05-26 Listed $92,000 FSBO.com
- 2017-01-27 Sold (Public Records) — Public Records
Property tax history
+7.0%/yrLatest (2025): $1,217 · -2.6% YoY. Source: county tax records.
Cash-flow waterfall
monthlySold comps — $/sqft
last 12 mo · ≤1 miLoading sold comps…