 🏗️ New Construction
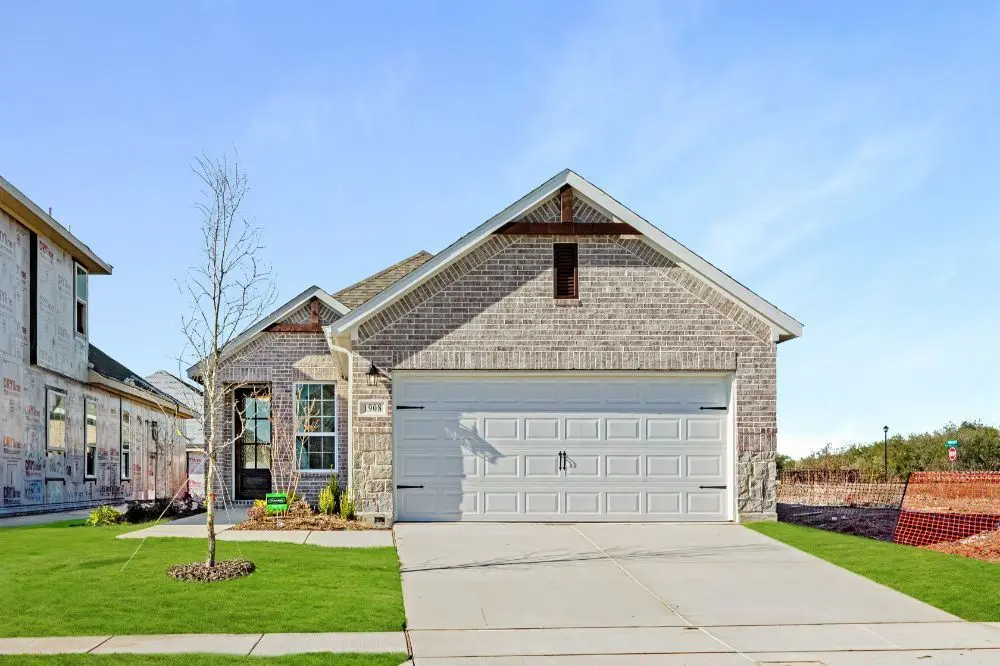
Burnet Plan · Forney, TX
Flood risk No data
- FEMA flood zone
- —
- Chance of flooding over 30 yrs
- —
- Est. flood insurance / yr
- —
Fire risk No data
- Est. fire insurance / yr
- —
Heat risk No data
- Hot days now (above threshold)
- —
- Hot days in 30 yrs
- —
Wind risk No data
- Chance of severe wind over 30 yrs
- —
Air-quality risk No data
- Unhealthy air days now
- —
- Unhealthy air days in 30 yrs
- —
Risk factors via First Street. Map © Google.
Why this score? — see what drove the D- grade
The composite is a weighted blend of 9 inputs, each scored 0–100. Each bar is that input's sub-score; the figure is the points it added to the 100-point composite (weight × sub-score).
- Cash flow +10.8/30.0
- ARV discount +7.5/15.0
- Schools +4.0/10.0
- Condition / age +4.0/5.0
- Livability +3.8/5.0
- 1% rule +3.2/10.0
- DSCR +3.1/10.0
- Rent growth +2.9/5.0
- Appreciation +0.0/10.0
$271,990
🖨 Deal sheet 📄 Offer letter ✓ Due diligence
Listing remarks MLS
The Burnet offers a thoughtfully designed layout that blends open-concept living with functional space. A covered front porch opens to a spacious great room with direct access to the rear covered patio-perfect for seamless indoor-outdoor entertaining. The gourmet kitchen features an optional large center island with breakfast bar seating, a walk-in pantry, and convenient access to the dining area, making it ideal for both formal meals and casual gatherings. The private primary suite includes a generous walk-in closet and a luxurious en suite bath with dual-sink vanity, a soaking tub, walk-in shower, and linen storage. Two large secondary bedrooms share a full bathroom, while a centrally located utility room adds everyday convenience.
Key facts
- Covered front porch
- Spacious great room
- Gourmet kitchen
Tags
Neighborhood map
What this means for you Summary
Snapshot
- This is a 3-bed/2.0-bath single-family listed at $272k. Condition is rated good.
Deal economics
- At list price, monthly cash flow is $-130 ($-2k/yr) — negative.
- To cash-flow at today's rent, offer at most $262k (3.7% below list).
- To meet the 1% rule (rent ≥ 1% of price), the offer needs to be $229k (15.7% below list).
- Recommended offer: $229k (15.7% below list) — sets the bar for 1% rule.
- Cap rate 5.7% vs local median 4.1% in Forney — top-decile yield for the area; either an underpriced asset or a hidden risk that comps aren't pricing in. Stress-test before assuming the spread holds.
Location & tenants
- Location reads 76/100 on livability (#98 in TX, #3,339 nationally) — a middle-class / working-renter tenant base. Strengths: crime A+, employment A+, cost of living A+; Watch: amenities C-, commute F.
- Forney ISD (rural): math 41% / reading 44% proficiency, ranked #234 of 826 in TX (top 28%) — families likely to look elsewhere, expect single-tenant / working-renter base with shorter leases.
- Market conditions: Rents rising (+1.4%/yr); 2179 active listings in the ZIP; 40 comparable units currently listed for rent nearby; rentals at typical pace (median 22d on market — plan ~3-4 weeks tenant-placement turnaround); solid renter incomes; 1,747 units permitted in Kaufman County in 2024 (180 in 5+ unit buildings).
Forward outlook
- Local home prices are declining (-3.0%/yr); year-one equity from $2k of loan paydown is wiped out by about $8k of value loss. Plan a longer hold.
- Kaufman County population projected at +43% by 2050 — long-run rental-demand tailwind backs the buy-and-hold thesis.
Negotiation context
- It's been on market 75 days — a 6% lower offer ($256k) is reasonable based on typical stale-listing flexibility.
Questions for the listing agent
- What do current leases actually rent for vs. the listed asking? Can we see a recent rent roll and the last 12 months of T-12 income?
- It's been on market 75 days. Have you received any prior offers? Is the seller open to a 16% concession, seller financing, or rate buy-down credit?
- Why hasn't it sold? Are there any deal-killer items the seller is aware of (foundation, flood, title, zoning, code violations)?
- Is there a deadline driving the sale (1031 exchange, divorce, estate, relocation)? That informs how much negotiation room exists.
- Schools are B-rated — typically a magnet for longer-tenancy family renters. What's the average tenant stay here, and is there a school-zone premium baked into asking?
- The area grade is low — what's the realistic commute time and amenity access for the typical tenant pool here? Any planned neighborhood developments (good or bad) we should know about?
- What's the average days-on-market for RENTAL listings here right now (not sales)? A rising rental-DOM trend means longer vacancies and softer asking-rent achievability than the comps imply.
- What's the recent tenant-quality profile in this submarket — average credit score on applications, eviction rate, late-payment / NSF rate, and stable-employment percentage? A property-management company in the area should have these aggregated.
- How much new for-sale + rental construction is in the pipeline within 1–3 miles? Heavy new supply typically softens prices + rents 12–24 months out; constrained supply supports both.
Investment metrics
- 1% rule
- 0.82% ✗
- Cap rate
- 5.74%
- Cash-on-cash
- -1.98%
- DSCR
- 0.91
- GRM
- 10.2
CMA / ARV
- ARV (median comp)
- $280,744
- List price
- $271,990
- Delta
- -3.12%
- Verdict
- FAIR
- Comps
- 20 within 1.0 mi
Show comp detail 12 sales within ~0.75 mi
| Address | Dist | Beds/Ba | Sqft | Sold | Price | $/sf | Match |
|---|---|---|---|---|---|---|---|
| 1705 Guswood Rd | 0.18mi | 3/2.0 | 1,537 (+2%) | 2mo | $299,960 | $195 | 87 |
| 2244 Walden Pond Blvd | 0.16mi | 3/2.0 | 1,537 (+2%) | 5mo | $289,960 | $189 | 86 |
| 1904 Flaxen Dr | 0.17mi | 3/2.0 | 1,451 (-4%) | 1mo | $220,999 | $152 | 84 |
| 2218 Walden Pond Blvd | 0.05mi | 3/2.0 | 1,604 (+6%) | 6mo | $260,824 | $163 | 82 |
| 1413 Grove Pond Rd | 0.22mi | 3/2.0 | 1,461 (-3%) | 3mo | $217,399 | $149 | 82 |
| 1415 Grove Pond Rd | 0.21mi | 3/2.0 | 1,451 (-4%) | 3mo | $215,499 | $149 | 81 |
| 1703 Sandy Pond | 0.29mi | 3/2.0 | 1,574 (+4%) | 2mo | $280,090 | $178 | 78 |
| 1919 Flaxen Dr | 0.15mi | 3/2.0 | 1,656 (+10%) | 1mo | $243,999 | $147 | 76 |
| 2208 Heaton St | 0.51mi | 3/2.0 | 1,449 (-4%) | 3mo | $245,000 | $169 | 67 |
| 1430 Everett Gardens Way | 0.67mi | 3/2.0 | 1,465 (-3%) | 4mo | $240,000 | $164 | 61 |
| 1410 Fairfield Dr | 0.64mi | 3/2.0 | 1,695 (+12%) | 4mo | $260,000 | $153 | 47 |
| 2035 Ballyoak Ln | 0.66mi | 3/2.0 | 1,729 (+14%) | 4mo | $308,900 | $179 | 42 |
Match score weights: distance 35% · size 25% · config 20% · recency 20%. Top-matched comps best support the ARV.
Projected returns pro-forma
-3.0% appreciation · 1.42% rent growth · sell at horizon
- IRR
- -21.3%
- Equity multiple
- 0.27×
- Total profit
- $-57,313
- Equity at exit
- $41,860
- IRR
- -19.1%
- Equity multiple
- 0.05×
- Total profit
- $-74,670
- Equity at exit
- $24,274
Cash invested: $78,608 (down + closing). Projections, not guarantees.
Landlord ↔ Tenant lean methodology
- Overall (STATE)
- 87 Strongly Landlord-Friendly
- State Texas
- 87 Strongly Landlord-Friendly · R+5
- County
- — inherits STATE
- City
- — inherits STATE
ZIP-level market 75126
- Rents YoY
- 1.4%
- Active inventory
- 2179
- Price-to-rent
- 9.9×
Monthly cashflow live
- Estimated rent
- $2,292 high interval (Pro) →
- Mortgage (P&I)
- −$1,472
- Tax est. 1.5%
- −$351 /mo · $4,211/yr
- Insurance
- −$117
- HOA
- −$0
- Vacancy / Maint / Mgmt
- −$481
- Net cashflow
- $-130
Break-even live
UW: 25.0% down · 7.5% · 30yr · 1.5% tax · 5.0% vac · 8.0% maint · 8.0% mgmt
Financing live
Cash to close
- Down payment
- $70,186
- Closing costs
- $8,422
- Reserves months
- —
- Total cash needed
- —
Loan-product check · same deal, 3 products live
Conventional
25% down · 7.5% · 30yr
- Down + closing
- —
- Monthly P&I
- —
- Monthly cashflow
- —
- DSCR
- —
- Eligible?
- —
Personal DTI + credit; lowest rate.
DSCR
20% down · 8.5% · 30yr
- Down + closing
- —
- Monthly P&I
- —
- Monthly cashflow
- —
- DSCR
- —
- Eligible?
- —
No personal income docs; deal must DSCR.
Hard money
10% down · 12.0% · 12mo
- Down + closing
- —
- Monthly P&I
- —
- Monthly cashflow
- —
- DSCR
- —
- Eligible?
- —
Short-term bridge; refi at stabilization.
Rent comps 40 comps
| Address | Beds | Baths | Sqft | Rent | $/sqft | DOM | Units | Dist |
|---|---|---|---|---|---|---|---|---|
| 1108 Redcoat Dr , TX | 3.0 | 2.0 | 1800 | $2,250 | $1.25 | 4d | 1 | 0.21mi |
| 1412 Grove Pond Rd Forney, TX | 4.0 | 2.0 | 1708 | $2,500 | $1.46 | 18d | 1 | 0.22mi |
| 534 Tuscany Dr Forney, TX | 4.0 | 2.0 | 2069 | $2,500 | $1.21 | 43d | 1 | 0.29mi |
| 1450 Whaley Dr Forney, TX | 1.0–2.0 | 1.0–2.0 | 922 | $2,532 | $2.75 | 1d | 20 | 0.38mi |
| 1012 Barkers Pond Ave Forney, TX | 4.0 | 2.0 | 1710 | $2,295 | $1.34 | 2d | 1 | 0.46mi |
| 2207 Heaton Forney, TX | 3.0 | 2.0 | 1423 | $2,100 | $1.48 | 43d | 1 | 0.49mi |
| 1105 N Gateway Blvd Forney, TX | 1.0–3.0 | 1.0–2.0 | 987 | $1,842 | $1.87 | 1d | 33 | 0.50mi |
| 2213 Heaton Forney, TX | 3.0 | 2.0 | 2146 | $2,395 | $1.12 | 7d | 1 | 0.52mi |
| 2213 Heaton Forney, TX | 3.0 | 2.0 | 2146 | $2,395 | $1.12 | 16d | 1 | 0.52mi |
| 2217 Perrymead Dr Forney, TX | 3.0 | 2.0 | 1423 | $2,360 | $1.66 | 4d | 1 | 0.57mi |
| 2225 Heaton Forney, TX | 3.0 | 2.0 | 1909 | $2,150 | $1.13 | 43d | 1 | 0.58mi |
| 2127 Pecan Ridge Dr Forney, TX | 3.0 | 2.0 | 2113 | $2,100 | $0.99 | 43d | 1 | 0.59mi |
| 1100 N Gateway Blvd Forney, TX | 1.0–2.0 | 1.0–2.0 | 892 | $1,819 | $2.04 | 1d | 29 | 0.63mi |
| 1205 Gateway Blvd Forney, TX | 2.0 | 1.0–2.0 | 957 | $2,437 | $2.55 | 43d | 1 | 0.64mi |
| 1750 Gleasondale Pl Forney, TX | 3.0 | 2.0 | 1633 | $2,200 | $1.35 | 43d | 1 | 0.65mi |
| 1200 N Gateway Blvd Forney, TX | 2.0 | 1.0–2.0 | 848 | $1,670 | $1.97 | 1d | 30 | 0.66mi |
| 1759 Gleasondale Pl Forney, TX | 3.0 | 2.0 | 1726 | $2,050 | $1.19 | 24d | 1 | 0.67mi |
| 1430 Everett Gardens Way Forney, TX | 3.0 | 2.0 | 1465 | $1,950 | $1.33 | 12d | 1 | 0.70mi |
| 1462 Everett Gardens Way Forney, TX | 4.0 | 2.0 | 1858 | $2,195 | $1.18 | 1d | 1 | 0.76mi |
| 1462 Everett Gardens Way Forney, TX | 4.0 | 2.0 | 1858 | $2,195 | $1.18 | 24d | 1 | 0.76mi |
| 2023 Avondown Rd Forney, TX | 3.0 | 2.0 | 1640 | $2,296 | $1.40 | 4d | 1 | 0.76mi |
| 10900 Reeder Ln Forney, TX | 3.0 | 1.5 | 1186 | $3,200 | $2.70 | 22d | 1 | 0.80mi |
| 2105 Cardinal Dr Forney, TX | 4.0 | 2.0 | 1763 | $2,200 | $1.25 | 22d | 1 | 0.81mi |
| 1405 N Gateway Blvd Forney, TX | 1.0–3.0 | 1.0–2.0 | 936 | $3,920 | $4.19 | 1d | 1 | 0.81mi |
| 2121 Juniper Dr Forney, TX | 4.0 | 2.0 | 1935 | $2,249 | $1.16 | 2d | 1 | 0.82mi |
| 2201 Woodberry Dr Forney, TX | 3.0 | 2.0 | 1839 | $2,050 | $1.11 | 43d | 1 | 0.83mi |
| 236 Pennridge Dr Forney, TX | 3.0 | 2.0 | 1871 | $2,295 | $1.23 | 24d | 1 | 0.88mi |
| 2421 Eldor Way Forney, TX | 4.0 | 2.0 | 1680 | $2,195 | $1.31 | 24d | 1 | 0.91mi |
| 2106 Bluebell Forney, TX | 3.0 | 2.0 | 1541 | $1,950 | $1.27 | 5d | 1 | 0.93mi |
| 2029 Cone Flower Dr Forney, TX | 3.0 | 2.0 | 1604 | $1,816 | $1.13 | 7d | 1 | 0.94mi |
| 108 Antler Trl Forney, TX | 4.0 | 2.0 | 2250 | $2,449 | $1.09 | 24d | 1 | 0.96mi |
| 236 Archer Way Forney, TX | 3.0 | 2.0 | 2016 | $2,300 | $1.14 | 18d | 1 | 0.99mi |
| 1017 Somerset Cir Forney, TX | 3.0 | 2.0 | 2185 | $2,375 | $1.09 | 7d | 1 | 1.00mi |
| 2026 Gardenia Dr Forney, TX | 4.0 | 2.5 | 2160 | $2,315 | $1.07 | 43d | 1 | 1.00mi |
| 2027 Fair Crest Trl Forney, TX | 4.0 | 2.0 | 2108 | $1,975 | $0.94 | 43d | 1 | 1.01mi |
| 4254 Calla Dr Forney, TX | 4.0 | 2.0 | 1983 | $2,400 | $1.21 | 43d | 1 | 1.01mi |
| 120 Garner Ct Forney, TX | 3.0 | 2.0 | 2214 | $2,500 | $1.13 | 43d | 1 | 1.02mi |
| 1448 Kingswell Ln Forney, TX | 4.0 | 3.0 | 2208 | $2,950 | $1.34 | 24d | 1 | 1.03mi |
| 4432 Thalia Way Forney, TX | 3.0 | 2.0 | 1816 | $2,100 | $1.16 | 43d | 1 | 1.05mi |
| 2214 Sumac Dr Forney, TX | 4.0 | 2.5 | 2055 | $2,070 | $1.01 | 43d | 1 | 1.05mi |
Listing history 16 events
-
2026-06-18days on market $271,990 Active 75 DOM
-
2026-06-17days on market $271,990 Active 74 DOM
-
2026-06-16days on market $271,990 Active 73 DOM
-
2026-06-15days on market $271,990 Active 72 DOM
-
2026-06-13days on market $271,990 Active 70 DOM
-
2026-06-13days on market $271,990 Active 69 DOM
-
2026-06-09days on market $271,990 Active 66 DOM
-
2026-06-08days on market $271,990 Active 65 DOM
-
2026-06-07days on market $271,990 Active 64 DOM
-
2026-06-04days on market $271,990 Active 61 DOM
-
2026-06-03days on market $271,990 Active 60 DOM
-
2026-06-02days on market $271,990 Active 59 DOM
-
2026-06-01days on market $271,990 Active 58 DOM
-
2026-05-31days on market $271,990 Active 57 DOM
-
2026-05-02price $271,990 743-char remark
Show marketing remark (743 chars)
The Burnet offers a thoughtfully designed layout that blends open-concept living with functional space. A covered front porch opens to a spacious great room with direct access to the rear covered patio-perfect for seamless indoor-outdoor entertaining. The gourmet kitchen features an optional large center island with breakfast bar seating, a walk-in pantry, and convenient access to the dining area, making it ideal for both formal meals and casual gatherings. The private primary suite includes a generous walk-in closet and a luxurious en suite bath with dual-sink vanity, a soaking tub, walk-in shower, and linen storage. Two large secondary bedrooms share a full bathroom, while a centrally located utility room adds everyday convenience.
-
2026-04-04$268,990 Active 743-char remark
Show marketing remark (743 chars)
The Burnet offers a thoughtfully designed layout that blends open-concept living with functional space. A covered front porch opens to a spacious great room with direct access to the rear covered patio-perfect for seamless indoor-outdoor entertaining. The gourmet kitchen features an optional large center island with breakfast bar seating, a walk-in pantry, and convenient access to the dining area, making it ideal for both formal meals and casual gatherings. The private primary suite includes a generous walk-in closet and a luxurious en suite bath with dual-sink vanity, a soaking tub, walk-in shower, and linen storage. Two large secondary bedrooms share a full bathroom, while a centrally located utility room adds everyday convenience.
ⓘ Source: listings_history table (triggers on properties + properties_extension) + one-shot
backfill from property_details.listing_events for pre-trigger history.
Nearby sold comps map
Loading sold comps map…
Walkable amenities ~0.75 mi
Loading nearby amenities…
Taxation est. · year 1
- Rental income
- $27,499
- − Mortgage interest
- −$15,726
- − Property taxes
- −$4,211
- − Insurance
- −$1,404
- − Repairs & maintenance
- −$2,200
- − Management
- −$2,200
- − Depreciation
- −$8,167
- Taxable loss
- −$6,409
- Est. tax savings @ 24.0%
- +$1,538
- After-tax cash flow
- $-20/yr
For passive investors: Depreciation is non-cash, so a rental often shows a tax loss while cash-flowing — sheltering income. Rental losses are passive: they offset passive income freely, and up to $25,000/yr can offset ordinary (W-2) income if you actively participate and your MAGI is under $100k (phasing out to $0 by $150k); unused losses carry forward. On sale, claimed depreciation is recaptured at up to 25%, and gains may owe capital-gains tax (a 1031 exchange can defer both). Figures are a year-1 estimate at your 24.0% rate — not tax advice; consult a CPA.
Condition & rehab AI · 1 photo
This single-family home is in good condition with a good condition score of 80. It is ready for minor cosmetic updates to enhance its resale and rental value.
Value-add opportunities
- Both Painting exterior and interior — Enhances curb appeal and interior aesthetics
- Both Landscaping improvements — Enhances curb appeal and adds value
- Both New flooring in bathrooms and kitchen — Improves functionality and aesthetics
- Both New kitchen appliances — Enhances functionality and aesthetics
- Both New bathroom fixtures — Enhances functionality and aesthetics
Renovation cost estimate screening
Value-add ROI direction
- Both Painting exterior and interior — Enhances curb appeal and interior aesthetics ↑
- Both Landscaping improvements — Enhances curb appeal and adds value ↑
- Both New flooring in bathrooms and kitchen — Improves functionality and aesthetics ↑
- Both New kitchen appliances — Enhances functionality and aesthetics ↑
- Both New bathroom fixtures — Enhances functionality and aesthetics ↑
ⓘ Cost ranges are severity-bucket heuristics (US national rule-of-thumb). Get contractor quotes + a written scope before underwriting a rehab budget.
Schools (NCES district)
- District
- Forney ISD
- NCES district ID
- 4819560
- Math proficiency
- 41% ▼ -20.00%
- Reading proficiency
- 44% ▼ -12.00%
- Median HH income
- $86,679
- Composite
- 40.07/100
- National rank
- #3812
- State rank
- #234 of 826 in TX
Livability — Forney
- Score
- 76/100
- State rank
- #98
- US rank
- #3339
Category grades
Schools grade is shown separately in the Schools card above.
Census & demographics
- County
- Kaufman County · 122,338 people
- City population
- 84,799
- Metro
- Dallas-Fort Worth-Arlington, TX
- Population (ZIP)
- 84,799
- Household income
- $103,673
- Rent vs Own
- Severe rent burden
- 1306.0
Population outlook (Kaufman County) Hauer SSP2
- Today (2025)
- 138,716 people
- By 2030
- 150,815 · +8.7%
- By 2040
- 174,877 · +26.1%
- By 2050
- 198,020 · +42.8%
- By 2075
- 251,908 · +81.6%
- By 2100
- 285,325 · +105.7%
Race, ethnicity, and origin ACS 2023
- Neighborhood character
- Diverse neighborhood (Simpson 0.68)
- Race & ethnicity
- White 45% Black 25% Hispanic / Latino 23% Two or more races 14% Asian 3%
- Hispanic origin (detail)
- Mexican 18% Puerto Rican 1%
- Common ancestry
- Italian 2% Slovak 1% Portuguese 1%
- Foreign-born
- 12% · Canada, Vietnam
- Languages at home
- 79% English-only · Spanish 14% Arabic 1% Vietnamese 1%
Political lean MEDSL · Kaufman
- 2024 margin
- Strong R (+27.9) · D 35.6% · R 63.5%
- 2008→2024 swing
- +7.9pp toward D · 2008: -35.8pp · 2024: -27.9pp
- All cycles
- 2024: R+27.9 2020: R+33.9 2016: R+47.0 2012: R+44.4 2008: R+35.8
Not yet ingested
- Civics
- —
Market trends
- HPI YoY
- ▼ -102.93%
- Current HPI
- 148.5749
- Rent YoY
- ▲ 1.42%
- Metro
- Dallas-Fort Worth-Arlington, TX
- State GDP YoY
- ▲ 3.95%
- F500 in state
- 110
Industry mix (Fortune 500 HQ in TX)
| Industry | F500 HQs | Revenue |
|---|---|---|
| Energy | 16 | $1,198B |
|
||
| Technology | 5 | $198B |
|
||
| Engineering / Construction | 4 | $72B |
|
||
| Energy Services | 3 | $60B |
|
||
| Utilities | 3 | $41B |
|
||
| Healthcare | 2 | $330B |
|
||
Price history
+1.1% since first listed2 events — show timeline
- 2026-05-02 Price Changed $271,990 Zillow
- 2026-04-04 Listed $268,990 Zillow
Cash-flow waterfall
monthlySold comps — $/sqft
last 12 mo · ≤1 miLoading sold comps…