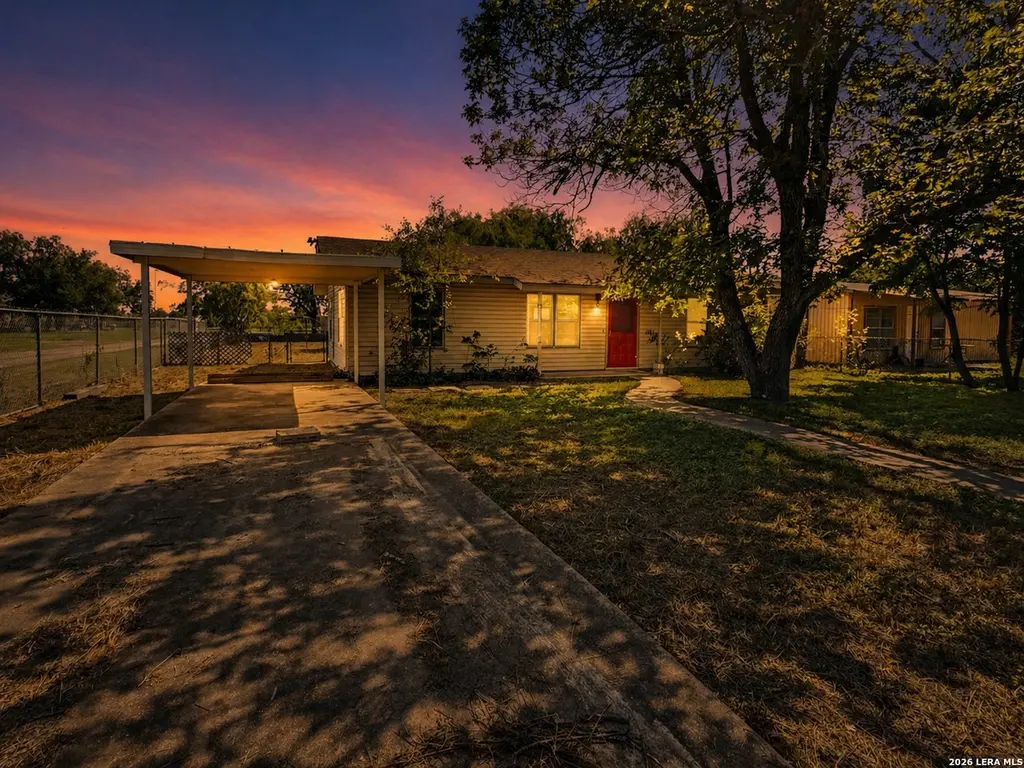
517 E Daniel · Uvalde, TX
Flood risk 1/10 · Minimal
- FEMA flood zone
- X (unshaded)
- Chance of flooding over 30 yrs
- 0.0%
- Est. flood insurance / yr
- $507 – $1,088
Fire risk 6/10 · Moderate
- Est. fire insurance / yr
- $1,222 – $2,270
Heat risk 8/10 · Major
- Hot days now (above 109°F)
- 7 days/yr
- Hot days in 30 yrs
- 22 days/yr
Wind risk 6/10 · Moderate
- Chance of severe wind over 30 yrs
- 53.0%
Air-quality risk 1/10 · Minimal
- Unhealthy air days now
- 0 days/yr
- Unhealthy air days in 30 yrs
- 0 days/yr
Risk factors via First Street. Map © Google.
Why this score? — see what drove the B+ grade
The composite is a weighted blend of 9 inputs, each scored 0–100. Each bar is that input's sub-score; the figure is the points it added to the 100-point composite (weight × sub-score).
- Cash flow +30.0/30.0
- ARV discount +15.0/15.0
- 1% rule +10.0/10.0
- DSCR +10.0/10.0
- Livability +3.7/5.0
- Rent growth +2.5/5.0
- Condition / age +2.5/5.0
- Schools +1.9/10.0
- Appreciation +0.0/10.0
$99,000
🖨 Deal sheet (PDF) 📄 Offer letter ✓ Due diligence
Listing remarks
Opportunity awaits at 517 E Daniel St in Uvalde. This 3-bedroom, 1-bath home offers a practical layout and sits on a spacious lot with mature trees that provide natural shade. The fully fenced yard includes a cross-fenced backyard, offering flexibility for pets, gardening, or outdoor activities. Conveniently located with access to local community amenities, including Memorial Park for outdoor recreation, El Progreso Memorial Library for reading and study spaces, and Uvalde Memorial Golf Course for leisure activities. Everyday shopping, dining, and essential services are also within reach. The home presents an opportunity for updates and improvements, making it a potential option for buyers
Key facts
- Community amenities
- Spacious lot
- Fully fenced yard
Tags
Property features AI
Finance
- Other: Possession at closing/funding; For sale (not a potential short sale)
- Financial info: Down payment resources not indicated
- HOA & community: Located in North Uvalde Subdivision
Exterior
- Parking: Detached parking
- Utilities: City water; City sewer (sewer system); City gas supplier; City electric (Uvalde city); City garbage service
- Home design: Pre-owned single-family home
- Construction: Siding exterior; Composition roof; Slab foundation
- Exterior features: Corner lot; Front of home faces north
Interior
- Kitchen: Refrigerator; Kitchen approximately 14 x 8
- Bedrooms: Master bedroom on lower level (12 x 11); Bedroom 2 (11 x 11); Bedroom 3 (11 x 9)
- Flooring: Ceramic tile; Laminate
- Bathrooms: 1 full bathroom
- Heating & cooling: Electric heat; Window unit heating; 3+ central air conditioning
- Interior features: Ceiling fans; Some window coverings remain; 1 living area
- Laundry & utility: Washer connection; Dryer connection
Neighborhood map
What this means for you Summary
Snapshot
- This is a 3-bed/1.0-bath single-family listed at $99k.
Deal economics
- At list price, monthly cash flow is $480 ($6k/yr) — positive.
- The deal already cash-flows at list — no discount required.
- Meets the 1% rule at list price ($2k rent vs $99k).
- Recommended offer: $96k (3.0% below list) — sets the bar for market timing.
- Cap rate 12.1% vs local median 3.0% in Uvalde — top-decile yield for the area; either an underpriced asset or a hidden risk that comps aren't pricing in. Stress-test before assuming the spread holds.
Location & tenants
- Location reads 74/100 on livability (#187 in TX, #4,844 nationally) — a middle-class / working-renter tenant base. Strengths: cost of living A+, housing A+, health & safety A+; Watch: crime D+, employment D, amenities F.
- Uvalde CISD (town): math 19% / reading 26% proficiency, ranked #760 of 826 in TX (top 92%) — low school quality limits family demand, transient renter base, plan for 1-2y turnover; 71% free/reduced lunch — lower-income household profile, screen leases tightly.
- Zoned schools: Uvalde El (337 students, 86% FRL); Uvalde H S (math 15% / reading 30%, grade F, #1,354 of 1,632 statewide, top 83%, 1,129 students, 72% FRL).
- Market conditions: 225 active listings in the ZIP; 1 comparable units currently listed for rent nearby; 17 units permitted in Uvalde County in 2024 (0 in 5+ unit buildings).
Forward outlook
- Local home prices are declining (-3.0%/yr); year-one equity from $684 of loan paydown is wiped out by about $3k of value loss. Plan a longer hold.
- Uvalde County population projected at +14% by 2050 — modest demand growth; plan on rents tracking national, not racing it.
- At projected returns (-3.0% appreciation + 3.0% rent growth), your $28k cash investment doubles in ~6 years — after that, you're playing with house money.
Negotiation context
- It's been on market 57 days — a 3% lower offer ($96k) is reasonable based on typical stale-listing flexibility.
Risks & watch-outs
- Climate carrying-cost: major wind risk, 53% chance of damaging wind over 30y; major wildfire risk; extreme-heat days projected 7→22/yr by 2055 (HVAC capex compounding) — expect insurance premiums to compound above CPI over the hold.
Questions for the listing agent
- It's been on market 57 days. Have you received any prior offers? Is the seller open to a 3% concession, seller financing, or rate buy-down credit?
- Built in 1978 — when were the roof, HVAC, electrical panel, plumbing, and water heater last replaced?
- Is there a deadline driving the sale (1031 exchange, divorce, estate, relocation)? That informs how much negotiation room exists.
- Schools are F-rated, which usually means shorter tenancies and higher turnover. Who's the typical renter profile here, and what's been the actual vacancy rate?
- Crime grade is D in this area — have there been break-ins, vandalism, or insurance claims at this property in the last 3 years? What carrier currently insures it and at what premium?
- What's the average days-on-market for RENTAL listings here right now (not sales)? A rising rental-DOM trend means longer vacancies and softer asking-rent achievability than the comps imply.
- What's the recent tenant-quality profile in this submarket — average credit score on applications, eviction rate, late-payment / NSF rate, and stable-employment percentage? A property-management company in the area should have these aggregated.
- How much new for-sale + rental construction is in the pipeline within 1–3 miles? Heavy new supply typically softens prices + rents 12–24 months out; constrained supply supports both.
Investment metrics
- 1% rule
- 1.52% ✓
- Cap rate
- 12.11%
- Cash-on-cash
- 20.78%
- DSCR
- 1.92
- GRM
- 5.5
CMA / ARV
- ARV (median comp)
- $158,040
- List price
- $99,000
- Delta
- -37.36%
- Verdict
- UNDERPRICED
- Comps
- 20 within 1.0 mi
Show comp detail 6 sales within ~0.75 mi
| Address | Dist | Beds/Ba | Sqft | Sold | Price | $/sf | Match |
|---|---|---|---|---|---|---|---|
| 449 Melody Ln | 0.32mi | 2/1.0 (-1) | 1,000 (-1%) | 15mo | $160,000 | $160 | 66 |
| 412 E Daniel St | 0.10mi | 2/2.0 (-1) | 990 (-2%) | 22mo | $167,500 | $169 | 65 |
| 121 Rio Grande | 0.45mi | 3/2.0 | 1,120 (+11%) | 1mo | $185,000 | $165 | 55 |
| 204 W Nueces St | 0.61mi | 3/1.5 | 1,008 (0%) | 22mo | $155,000 | $154 | 51 |
| 133 Rio Grande St | 0.48mi | 3/2.0 | 1,125 (+12%) | 4mo | $185,000 | $164 | 51 |
| 144 Vanham | 0.49mi | 3/1.0 | 1,118 (+11%) | 9mo | $199,000 | $178 | 51 |
Match score weights: distance 35% · size 25% · config 20% · recency 20%. Top-matched comps best support the ARV.
Projected returns pro-forma
-3.0% appreciation · 3.0% rent growth · sell at horizon
- IRR
- 13.2%
- Equity multiple
- 1.53×
- Total profit
- $14,569
- Equity at exit
- $14,761
- IRR
- 22.1%
- Equity multiple
- 2.88×
- Total profit
- $52,201
- Equity at exit
- $8,560
Cash invested: $27,720 (down + closing). Projections, not guarantees.
Landlord ↔ Tenant lean methodology
- Overall (STATE)
- 87 Strongly Landlord-Friendly
- State Texas
- 87 Strongly Landlord-Friendly · R+5
- County
- — inherits STATE
- City
- — inherits STATE
ZIP-level market 78801
- Active inventory
- 225
- Price-to-rent
- 5.5×
Monthly cashflow live
- Estimated rent
- $1,500 medium interval (Pro) →
- Mortgage (P&I)
- −$519
- Tax from tax record
- −$145 /mo · $1,734/yr
- Insurance
- −$41
- HOA
- −$0
- Vacancy / Maint / Mgmt
- −$315
- Net cashflow
- $480
Break-even live
Sensitivity live
| Price | -10% $536 | -5% $508 | +0% $480 | +5% $452 | +10% $424 |
|---|---|---|---|---|---|
| Rent | -10% $362 | -5% $421 | +0% $480 | +5% $539 | +10% $599 |
| Rate | -1.0pp $530 | -0.5pp $505 | base $480 | +0.5pp $454 | +1.0pp $428 |
UW: 25.0% down · 7.5% · 30yr · 1.5% tax · 5.0% vac · 8.0% maint · 8.0% mgmt
Financing live
Cash to close
- Down payment
- $24,750
- Closing costs
- $2,970
- Reserves months
- —
- Total cash needed
- —
Loan-product check · same deal, 3 products live
Conventional
25% down · 7.5% · 30yr
- Down + closing
- —
- Monthly P&I
- —
- Monthly cashflow
- —
- DSCR
- —
- Eligible?
- —
Personal DTI + credit; lowest rate.
DSCR
20% down · 8.5% · 30yr
- Down + closing
- —
- Monthly P&I
- —
- Monthly cashflow
- —
- DSCR
- —
- Eligible?
- —
No personal income docs; deal must DSCR.
Hard money
10% down · 12.0% · 12mo
- Down + closing
- —
- Monthly P&I
- —
- Monthly cashflow
- —
- DSCR
- —
- Eligible?
- —
Short-term bridge; refi at stabilization.
Rent comps 1 comps
| Address | Beds | Baths | Sqft | Rent | $/sqft | DOM | Units | Dist |
|---|---|---|---|---|---|---|---|---|
| 410 Bohme St Uvalde, TX | 2.0 | 2.0 | 1348 | $1,500 | $1.11 | 45d | 1 | 1.32mi |
Listing history 20 events
-
2026-06-21days on market $99,000 Active 57 DOM
-
2026-06-21days on market $99,000 Active 56 DOM
-
2026-06-18days on market $99,000 Active 54 DOM
-
2026-06-17days on market $99,000 Active 53 DOM
-
2026-06-16days on market $99,000 Active 52 DOM
-
2026-06-15days on market $99,000 Active 51 DOM
-
2026-06-15statusdays on market $99,000 Active 50 DOM
-
2026-06-13days on market $99,000 Price Change 49 DOM
-
2026-06-12days on market $99,000 Price Change 48 DOM
-
2026-06-09days on market $99,000 Price Change 45 DOM
-
2026-06-08days on market $99,000 Price Change 44 DOM
-
2026-06-08days on market $99,000 Price Change 43 DOM
-
2026-06-07days on market $99,000 Price Change 42 DOM
-
2026-06-04pricestatus $99,000 Price Change 39 DOM
-
2026-06-03days on market $104,900 Active 39 DOM
-
2026-06-02days on market $104,900 Active 38 DOM
-
2026-06-01days on market $104,900 Active 37 DOM
-
2026-05-31days on market $104,900 Active 36 DOM
-
2026-04-24$104,900 New 906-char remark
-
1904-04-01soldstatus
ⓘ Source: listings_history table (triggers on properties + properties_extension) + one-shot
backfill from property_details.listing_events for pre-trigger history.
Tax reassessment forecast TX · Resets to sale price
- Current annual tax
- $1,734 · $145/mo
- Projected year-2 tax
- $1,812 · $151/mo
- Expected delta
- +$77/yr (+$6/mo · 4.5%)
ⓘ Screening estimate from a state-policy table — verify with the county assessor before closing.
Climate risk First Street
- Flood 1/10 Low FEMA zone X (unshaded) · 0% chance over 30 yrs
- Wildfire 6/10 Major
- Heat 8/10 Severe 7 d/yr ≥109°F today · 22 d/yr by 30 yrs out
- Wind 6/10 Major 53% chance of damaging wind over 30 yrs
- Air quality 1/10 Low 0 unhealthy d/yr today · 0 by 30 yrs out
Nearby sold comps map
Loading sold comps map…
Walkable amenities ~0.75 mi
Loading nearby amenities…
Taxation est. · year 1
- Rental income
- $18,000
- − Mortgage interest
- −$5,546
- − Property taxes
- −$1,734
- − Insurance
- −$495
- − Repairs & maintenance
- −$1,440
- − Management
- −$1,440
- − Depreciation
- −$2,880
- Taxable income
- $4,465
- Est. tax owed @ 24.0%
- −$1,072
- After-tax cash flow
- $4,689/yr
For passive investors: Depreciation is non-cash, so a rental often shows a tax loss while cash-flowing — sheltering income. Rental losses are passive: they offset passive income freely, and up to $25,000/yr can offset ordinary (W-2) income if you actively participate and your MAGI is under $100k (phasing out to $0 by $150k); unused losses carry forward. On sale, claimed depreciation is recaptured at up to 25%, and gains may owe capital-gains tax (a 1031 exchange can defer both). Figures are a year-1 estimate at your 24.0% rate — not tax advice; consult a CPA.
Schools (NCES district)
- District
- Uvalde CISD
- NCES district ID
- 4843720
- Math proficiency
- 19% ▼ -9.00%
- Reading proficiency
- 26% ▼ -3.00%
- Median HH income
- $36,054
- Composite
- 18.63/100
- National rank
- #8897
- State rank
- #760 of 826 in TX
Livability — Uvalde
- Score
- 74/100
- State rank
- #187
- US rank
- #4844
Category grades
Schools grade is shown separately in the Schools card above.
Census & demographics
- Census place
- Uvalde, TX
- Population (ZIP)
- 21,487
Population outlook (Uvalde County) Hauer SSP2
- Today (2025)
- 28,865 people
- By 2030
- 29,675 · +2.8%
- By 2040
- 31,256 · +8.3%
- By 2050
- 32,790 · +13.6%
- By 2075
- 37,013 · +28.2%
- By 2100
- 37,306 · +29.2%
Race, ethnicity, and origin ACS 2023
- Neighborhood character
- Predominantly Hispanic (76%)
- Race & ethnicity
- Hispanic / Latino 76% White 20% Two or more races 18% Native American 1% Asian 1%
- Hispanic origin (detail)
- Mexican 69% Puerto Rican 1%
- Common ancestry
- Lithuanian 2% Serbian 1% Slovak 1%
- Foreign-born
- 11% · Canada
- Languages at home
- 48% English-only · Spanish 51% Other Asian/Pacific 1%
Political lean MEDSL · Uvalde
- 2024 margin
- Solid R (+33.4) · D 32.9% · R 66.3%
- 2008→2024 swing
- -28.1pp toward R · 2008: -5.3pp · 2024: -33.4pp
- All cycles
- 2024: R+33.4 2020: R+20.3 2016: R+10.8 2012: R+8.3 2008: R+5.3
Not yet ingested
- Civics
- —
Market trends
- HPI YoY
- ▼ -113.65%
- Current HPI
- 152.7777
- Rent YoY
- —
- Metro
- —
- State GDP YoY
- ▲ 3.95%
- F500 in state
- 110
Industry mix (Fortune 500 HQ in TX)
| Industry | F500 HQs | Revenue |
|---|---|---|
| Energy | 16 | $1,198B |
|
||
| Technology | 5 | $198B |
|
||
| Engineering / Construction | 4 | $72B |
|
||
| Energy Services | 3 | $60B |
|
||
| Utilities | 3 | $41B |
|
||
| Healthcare | 2 | $330B |
|
||
Price history
-5.6% since first listed3 events — show timeline
- 2026-06-04 Price Changed $99,000 LERA
- 2026-04-24 Listed $104,900 LERA
- 1904-04-01 Sold (Public Records) — Public Records
Property tax history
+1.8%/yrLatest (2025): $1,734 · +6.5% YoY. Source: county tax records.
Cash-flow waterfall
monthlySold comps — $/sqft
last 12 mo · ≤1 miLoading sold comps…