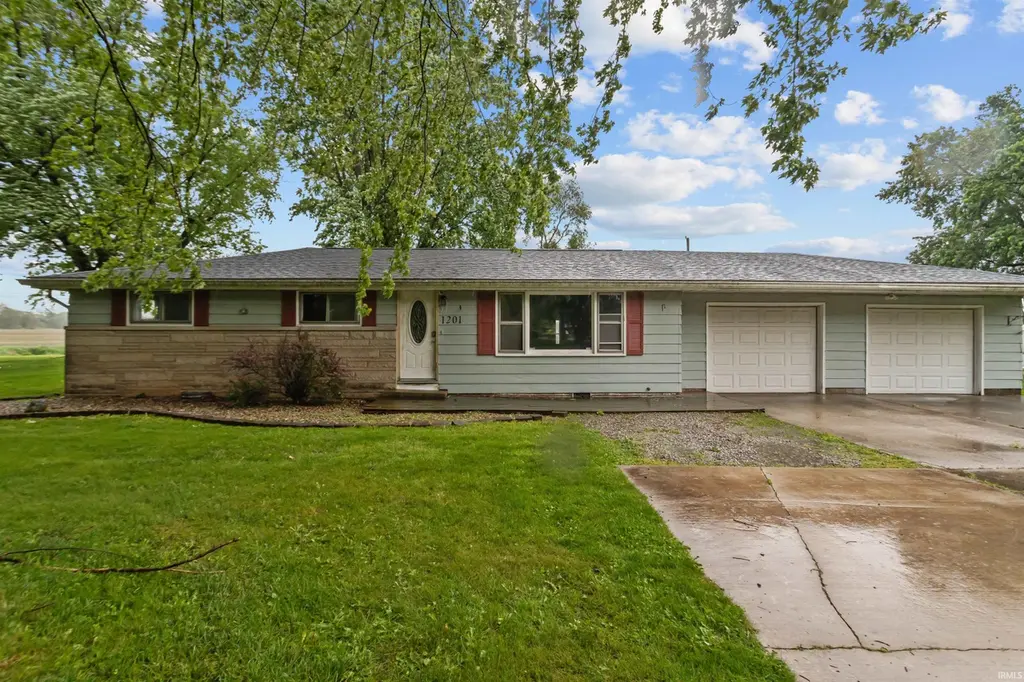
1201 E Alto Rd · Kokomo, IN
Flood risk 7/10 · Major
- FEMA flood zone
- X (unshaded)
- Chance of flooding over 30 yrs
- 0.76%
- Est. flood insurance / yr
- $507 – $1,088
Fire risk 1/10 · Minimal
- Est. fire insurance / yr
- $717 – $1,331
Heat risk 3/10 · Minor
- Hot days now (above 101°F)
- 7 days/yr
- Hot days in 30 yrs
- 16 days/yr
Wind risk 2/10 · Minimal
- Chance of severe wind over 30 yrs
- 0.0%
Air-quality risk 3/10 · Minor
- Unhealthy air days now
- 2 days/yr
- Unhealthy air days in 30 yrs
- 4 days/yr
Risk factors via First Street. Map © Google.
Why this score? — see what drove the D+ grade
The composite is a weighted blend of 9 inputs, each scored 0–100. Each bar is that input's sub-score; the figure is the points it added to the 100-point composite (weight × sub-score).
- Cash flow +15.4/30.0
- ARV discount +15.0/15.0
- DSCR +4.7/10.0
- 1% rule +3.6/10.0
- Livability +3.4/5.0
- Rent growth +3.0/5.0
- Condition / age +2.5/5.0
- Schools +1.8/10.0
- Appreciation +0.0/10.0
$164,900
🖨 Deal sheet (PDF) 📄 Offer letter ✓ Due diligence
Listing remarks MLS
Come check out this 1500 sq ft 3 bedroom home with an additional 364 sq ft mother-in laws quarter which could be the 4th bedroom. This home offers a fully appliance eat-in kitchen. Spacious living room along with family room with fireplace. All this plus 2 car attached garage. Updates include paint, flooring and new septic.
Key facts
- 0.46 acre lot
- 2 garage spots
- Built 1960
Property features AI
Exterior
- Parking: Detached 2-car garage
- Utilities: Private well water; Septic tank sewer
- Home design: Single-story, site-built single family home; Residential property
- Construction: Vinyl siding
- Exterior features: Rolling slope lot; Lot dimensions approximately 100 x 176
Interior
- Bathrooms: 1 full bathroom (main level)
- Heating & cooling: Forced air heating; Central air conditioning
- Interior features: Crawl space basement; Total of 5 rooms
- Laundry & utility: Laundry on the main level
Neighborhood map
What this means for you Summary
Snapshot
- This is a 3-bed/1.0-bath single-family listed at $165k.
Deal economics
- At list price, monthly cash flow is $-4 ($-52/yr) — negative.
- To cash-flow at today's rent, offer at most $164k (0.5% below list).
- To meet the 1% rule (rent ≥ 1% of price), the offer needs to be $142k (13.6% below list).
- Recommended offer: $142k (13.6% below list) — sets the bar for 1% rule.
- Cap rate 6.7% vs local median 5.1% in Kokomo — top-decile yield for the area; either an underpriced asset or a hidden risk that comps aren't pricing in. Stress-test before assuming the spread holds.
Location & tenants
- Location reads 68/100 on livability (#227 in IN) — a middle-class / working-renter tenant base. Strengths: cost of living A+, housing A+, health & safety A; Watch: crime D, amenities F, commute F.
- Taylor Community School Corporation (rural): math 17% / reading 23% proficiency, ranked #272 of 301 in IN (top 90%) — low school quality limits family demand, transient renter base, plan for 1-2y turnover.
- Zoned schools: Taylor Elementary School (math 19% / reading 19%, grade F, #829 of 994 statewide, top 84%, 513 students, 78% FRL); Taylor Middle School (math 13% / reading 20%, grade F, #287 of 330 statewide, top 88%, 413 students, 76% FRL); Taylor High School (math 32% / reading 52%, grade F, #197 of 369 statewide, top 57%, 374 students, 67% FRL) — zoned schools average 74% FRL vs 45% district-wide (29 pts higher); higher-poverty schools than district average — tighter screening recommended.
- Market conditions: Rents rising (+1.8%/yr); 235 active listings in the ZIP; 1 comparable units currently listed for rent nearby; 194 units permitted in Howard County in 2024 (0 in 5+ unit buildings).
Forward outlook
- Local home prices are declining (-3.0%/yr); year-one equity from $1k of loan paydown is wiped out by about $5k of value loss. Plan a longer hold.
- Howard County population projected at -11% by 2050 — secular population decline; favor cash flow + early exit over multi-decade hold.
Negotiation context
- Only 3 days on market — expect competitive offers; lowballing is unlikely to land.
- 4 sale attempts since 11y ago with the ask held roughly flat each time — persistent listings suggest the price (not the market) is what's stuck; bring a comps-based counter.
- Current owner paid $103k; list at $165k implies a 60% gain — meaningful room to come down on a strong offer.
Risks & watch-outs
- Watch-outs: flood insurance adds $66/mo.
- Climate carrying-cost: major flood risk — expect insurance premiums to compound above CPI over the hold.
Questions for the listing agent
- What do current leases actually rent for vs. the listed asking? Can we see a recent rent roll and the last 12 months of T-12 income?
- Built in 1960 — when were the roof, HVAC, electrical panel, plumbing, and water heater last replaced?
- What's the actual annual flood-insurance premium (NFIP or private), and is the property in a SFHA with mandatory coverage?
- Is there a deadline driving the sale (1031 exchange, divorce, estate, relocation)? That informs how much negotiation room exists.
- Schools are F-rated, which usually means shorter tenancies and higher turnover. Who's the typical renter profile here, and what's been the actual vacancy rate?
- Crime grade is D in this area — have there been break-ins, vandalism, or insurance claims at this property in the last 3 years? What carrier currently insures it and at what premium?
- The area grade is low — what's the realistic commute time and amenity access for the typical tenant pool here? Any planned neighborhood developments (good or bad) we should know about?
- What's the average days-on-market for RENTAL listings here right now (not sales)? A rising rental-DOM trend means longer vacancies and softer asking-rent achievability than the comps imply.
- What's the recent tenant-quality profile in this submarket — average credit score on applications, eviction rate, late-payment / NSF rate, and stable-employment percentage? A property-management company in the area should have these aggregated.
- How much new for-sale + rental construction is in the pipeline within 1–3 miles? Heavy new supply typically softens prices + rents 12–24 months out; constrained supply supports both.
Investment metrics
- 1% rule
- 0.86% ✗
- Cap rate
- 6.75%
- Cash-on-cash
- 1.62%
- DSCR
- 1.07
- GRM
- 9.7
CMA / ARV
- ARV (on-the-fly)
- $204,816
- Comps found
- 12
Show comp detail 12 sales within ~0.75 mi
| Address | Dist | Beds/Ba | Sqft | Sold | Price | $/sf | Match |
|---|---|---|---|---|---|---|---|
| 1023 Linda Dr | 0.12mi | 3/2.0 | 1,488 (-1%) | 5mo | $182,900 | $123 | 84 |
| 3201 Alameda Blvd | 0.44mi | 3/1.5 | 1,504 (-0%) | 2mo | $228,900 | $152 | 76 |
| 3801 E Melody Ln | 0.29mi | 3/2.0 | 1,580 (+5%) | 5mo | $214,900 | $136 | 70 |
| 3812 Pamela Ct | 0.31mi | 3/2.0 | 1,560 (+4%) | 7mo | $95,000 | $61 | 70 |
| 3505 W Melody Ln | 0.51mi | 3/1.5 | 1,531 (+2%) | 2mo | $195,000 | $127 | 69 |
| 3816 Tulip Ln | 0.16mi | 3/2.0 | 1,310 (-13%) | 1mo | $235,500 | $180 | 66 |
| 3604 Candy Ln | 0.40mi | 3/2.0 | 1,418 (-6%) | 3mo | $244,900 | $173 | 66 |
| 709 Marsha Dr | 0.35mi | 3/2.0 | 1,408 (-6%) | 4mo | $218,000 | $155 | 65 |
| 707 Springwater Rd | 0.63mi | 3/2.0 | 1,560 (+4%) | 1mo | $249,900 | $160 | 60 |
| 3022 Highland Springs Dr | 0.51mi | 3/2.0 | 1,560 (+4%) | 8mo | $199,000 | $128 | 60 |
| 4908 Algonquin Trl | 0.70mi | 3/1.0 | 1,392 (-8%) | 2mo | $149,900 | $108 | 53 |
| 3601 Canyon Dr | 0.44mi | 3/2.0 | 1,695 (+12%) | 4mo | $195,000 | $115 | 51 |
Match score weights: distance 35% · size 25% · config 20% · recency 20%. Top-matched comps best support the ARV.
Projected returns pro-forma
-3.0% appreciation · 1.8% rent growth · sell at horizon
- IRR
- -17.8%
- Equity multiple
- 0.38×
- Total profit
- $-28,680
- Equity at exit
- $24,587
- IRR
- -12.4%
- Equity multiple
- 0.31×
- Total profit
- $-32,072
- Equity at exit
- $14,258
Cash invested: $46,172 (down + closing). Projections, not guarantees.
Landlord ↔ Tenant lean methodology
- Overall (STATE)
- 90 Strongly Landlord-Friendly
- State Indiana
- 90 Strongly Landlord-Friendly · R+11
- County
- — inherits STATE
- City
- — inherits STATE
ZIP-level market 46902
- Home prices YoY
- -20.7%
- Rents YoY
- 1.8%
- Active inventory
- 235
- Price-to-rent
- 9.7×
Monthly cashflow live
- Estimated rent
- $1,424 medium interval (Pro) →
- Mortgage (P&I)
- −$865
- Tax from tax record
- −$129 /mo · $1,552/yr
- Insurance
- −$69
- Flood insurance flood zone
- −$66 /mo · $798/yr
- HOA
- −$0
- Vacancy / Maint / Mgmt
- −$299
- Net cashflow
- $-4
Break-even live
Sensitivity live
| Price | -10% $89 | -5% $42 | +0% $-4 | +5% $-51 | +10% $-98 |
|---|---|---|---|---|---|
| Rent | -10% $-117 | -5% $-61 | +0% $-4 | +5% $52 | +10% $108 |
| Rate | -1.0pp $79 | -0.5pp $38 | base $-4 | +0.5pp $-47 | +1.0pp $-91 |
UW: 25.0% down · 7.5% · 30yr · 1.5% tax · 5.0% vac · 8.0% maint · 8.0% mgmt
Financing live
Cash to close
- Down payment
- $41,225
- Closing costs
- $4,947
- Reserves months
- —
- Total cash needed
- —
Loan-product check · same deal, 3 products live
Conventional
25% down · 7.5% · 30yr
- Down + closing
- —
- Monthly P&I
- —
- Monthly cashflow
- —
- DSCR
- —
- Eligible?
- —
Personal DTI + credit; lowest rate.
DSCR
20% down · 8.5% · 30yr
- Down + closing
- —
- Monthly P&I
- —
- Monthly cashflow
- —
- DSCR
- —
- Eligible?
- —
No personal income docs; deal must DSCR.
Hard money
10% down · 12.0% · 12mo
- Down + closing
- —
- Monthly P&I
- —
- Monthly cashflow
- —
- DSCR
- —
- Eligible?
- —
Short-term bridge; refi at stabilization.
Rent comps 1 comps
| Address | Beds | Baths | Sqft | Rent | $/sqft | DOM | Units | Dist |
|---|---|---|---|---|---|---|---|---|
| 3515 Melody Ln E Kokomo, IN | 3.0 | 1.5 | 1736 | $1,650 | $0.95 | 45d | 1 | 0.44mi |
Listing history 10 events
-
2026-05-22status Pending
-
2026-05-19$164,900 Active
-
2018-04-13soldstatus $103,000 325-char remark
Show marketing remark (325 chars)
Come check out this 1500 sq ft 3 bedroom home with an additional 364 sq ft mother-in laws quarter which could be the 4th bedroom. This home offers a fully appliance eat-in kitchen. Spacious living room along with family room with fireplace. All this plus 2 car attached garage. Updates include paint, flooring and new septic.
-
2018-01-29$103,000 325-char remark
Show marketing remark (325 chars)
Come check out this 1500 sq ft 3 bedroom home with an additional 364 sq ft mother-in laws quarter which could be the 4th bedroom. This home offers a fully appliance eat-in kitchen. Spacious living room along with family room with fireplace. All this plus 2 car attached garage. Updates include paint, flooring and new septic.
-
2016-03-08soldstatus $40,303
-
2016-02-23soldstatus $40,303 274-char remark
Show marketing remark (274 chars)
So much potential in this spacious 3 bedroom, 1 bath ranch! Never run out of room in the large eat in kitchen. Save on heating costs with the wood burning stove in the family room. Huge backyard is great for backyard bbqs and has 2 storage sheds! Convenient in law quarters!
-
2016-02-23soldstatus $40,303
Show marketing remark (274 chars)
So much potential in this spacious 3 bedroom, 1 bath ranch! Never run out of room in the large eat in kitchen. Save on heating costs with the wood burning stove in the family room. Huge backyard is great for backyard bbqs and has 2 storage sheds! Convenient in law quarters!
-
2015-09-01$39,900 274-char remark
Show marketing remark (274 chars)
So much potential in this spacious 3 bedroom, 1 bath ranch! Never run out of room in the large eat in kitchen. Save on heating costs with the wood burning stove in the family room. Huge backyard is great for backyard bbqs and has 2 storage sheds! Convenient in law quarters!
-
2015-08-28$39,900
-
1999-08-12soldstatus $118,500
ⓘ Source: listings_history table (triggers on properties + properties_extension) + one-shot
backfill from property_details.listing_events for pre-trigger history.
Tax reassessment forecast IN · Partial reset (capped growth)
- Current annual tax
- $1,552 · $129/mo
- Projected year-2 tax
- $1,552 · $129/mo
- Expected delta
- $0/yr ($0/mo · 0.0%)
ⓘ Screening estimate from a state-policy table — verify with the county assessor before closing.
Climate risk First Street
- Flood 7/10 Severe FEMA zone X (unshaded) · 76% chance over 30 yrs
- Wildfire 1/10 Low
- Heat 3/10 Moderate 7 d/yr ≥101°F today · 16 d/yr by 30 yrs out
- Wind 2/10 Low 0% chance of damaging wind over 30 yrs
- Air quality 3/10 Moderate 2 unhealthy d/yr today · 4 by 30 yrs out
Nearby sold comps map
Loading sold comps map…
Walkable amenities ~0.75 mi
Loading nearby amenities…
Taxation est. · year 1
- Rental income
- $17,088
- − Mortgage interest
- −$9,237
- − Property taxes
- −$1,552
- − Insurance
- −$1,622
- − Repairs & maintenance
- −$1,367
- − Management
- −$1,367
- − Depreciation
- −$4,797
- Taxable loss
- −$2,854
- Est. tax savings @ 24.0%
- +$685
- After-tax cash flow
- $633/yr
For passive investors: Depreciation is non-cash, so a rental often shows a tax loss while cash-flowing — sheltering income. Rental losses are passive: they offset passive income freely, and up to $25,000/yr can offset ordinary (W-2) income if you actively participate and your MAGI is under $100k (phasing out to $0 by $150k); unused losses carry forward. On sale, claimed depreciation is recaptured at up to 25%, and gains may owe capital-gains tax (a 1031 exchange can defer both). Figures are a year-1 estimate at your 24.0% rate — not tax advice; consult a CPA.
Schools (NCES district)
- District
- Taylor Community School Corporation
- NCES district ID
- 1811250
- Math proficiency
- 17% ▼ -10.00%
- Reading proficiency
- 23% ▼ -9.00%
- Median HH income
- $52,382
- Composite
- 18.12/100
- National rank
- #8969
- State rank
- #272 of 301 in IN
Livability — Kokomo
- Score
- 68/100
- State rank
- #227
- US rank
- #9912
Category grades
Schools grade is shown separately in the Schools card above.
Census & demographics
- Census place
- Kokomo, IN
- County
- Howard County · 75,099 people
- City population
- 75,099
- Metro
- Kokomo, IN
- Population (ZIP)
- 37,017
- Household income
- $62,126
- Rent vs Own
- Severe rent burden
- 1262.0
Population outlook (Howard County) Hauer SSP2
- Today (2025)
- 81,522 people
- By 2030
- 80,104 · -1.7%
- By 2040
- 76,708 · -5.9%
- By 2050
- 72,880 · -10.6%
- By 2075
- 64,016 · -21.5%
- By 2100
- 51,705 · -36.6%
Race, ethnicity, and origin ACS 2023
- Neighborhood character
- Predominantly White (81%)
- Race & ethnicity
- White 81% Black 9% Two or more races 5% Hispanic / Latino 4% Asian 3%
- Common ancestry
- Italian 2% Lithuanian 1% Slovak 1%
- Foreign-born
- 3% · Canada, Vietnam, China
- Languages at home
- 96% English-only · Vietnamese 1% Other Asian/Pacific 1% Spanish 1%
Political lean MEDSL · Howard
- 2024 margin
- Solid R (+35.3) · D 31.4% · R 66.7% · Other 1.8%
- 2008→2024 swing
- -29.1pp toward R · 2008: -6.2pp · 2024: -35.3pp
- All cycles
- 2024: R+35.3 2020: R+32.4 2016: R+33.9 2012: R+14.3 2008: R+6.2
Not yet ingested
- Civics
- —
Market trends
- HPI YoY
- ▼ -61.76%
- Current HPI
- 236.8237
- Rent YoY
- ▲ 1.80%
- Metro
- Kokomo, IN
- State GDP YoY
- ▲ 2.90%
- F500 in state
- 18
Industry mix (Fortune 500 HQ in IN)
| Industry | F500 HQs | Revenue |
|---|---|---|
| Industrial Machinery | 2 | $37B |
|
||
| Healthcare | 1 | $177B |
|
||
| Pharmaceuticals | 1 | $45B |
|
||
| Metals / Steel | 1 | $18B |
|
||
| Agriculture | 1 | $17B |
|
||
| Packaging | 1 | $12B |
|
||
Price history
+39.2% since first listed10 events — show timeline
- 2026-05-22 Pending — IRMLS
- 2026-05-19 Listed $164,900 IRMLS
- 2018-04-13 Sold (MLS) $103,000 IRMLS
- 2018-01-29 Listed $103,000 IRMLS
- 2016-03-08 Sold (Public Records) $40,303 Public Records
- 2016-02-23 Sold (MLS) $40,303 MIBOR as Distributed by MLS Grid
- 2016-02-23 Sold (MLS) $40,303 IRMLS
- 2015-09-01 Listed $39,900 IRMLS
- 2015-08-28 Listed $39,900 MIBOR as Distributed by MLS Grid
- 1999-08-12 Sold (Public Records) $118,500 Public Records
Property tax history
-1.4%/yrLatest (2024): $1,552 · +2.0% YoY. Source: county tax records.
Cash-flow waterfall
monthlySold comps — $/sqft
last 12 mo · ≤1 miLoading sold comps…