 Fourplex
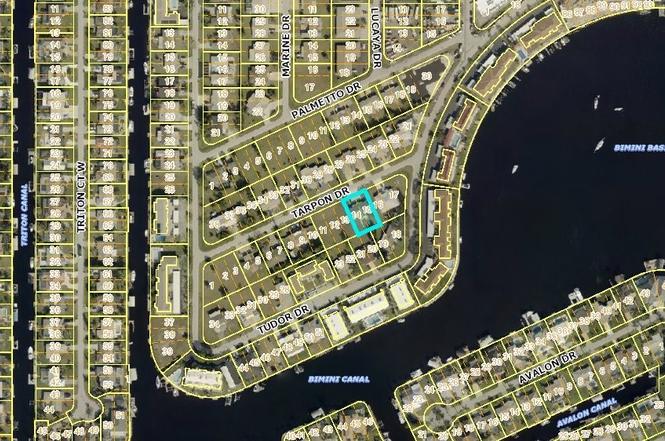
328 Tarpon Dr #1 · Cape Coral, FL
Flood risk 9/10 · Severe
- FEMA flood zone
- AE
- Chance of flooding over 30 yrs
- 0.99%
- Est. flood insurance / yr
- $1,737 – $8,500
Fire risk 1/10 · Minimal
- Est. fire insurance / yr
- $947 – $1,759
Heat risk 10/10 · Severe
- Hot days now (above 107°F)
- 7 days/yr
- Hot days in 30 yrs
- 30 days/yr
Wind risk 10/10 · Severe
- Chance of severe wind over 30 yrs
- 99.0%
Air-quality risk 2/10 · Minimal
- Unhealthy air days now
- 1 days/yr
- Unhealthy air days in 30 yrs
- 1 days/yr
Risk factors via First Street. Map © Google.
Why this score? — see what drove the C grade
The composite is a weighted blend of 9 inputs, each scored 0–100. Each bar is that input's sub-score; the figure is the points it added to the 100-point composite (weight × sub-score).
- Cash flow +23.2/30.0
- ARV discount +7.5/15.0
- DSCR +7.4/10.0
- 1% rule +6.1/10.0
- Schools +4.1/10.0
- Livability +3.9/5.0
- Condition / age +2.5/5.0
- Rent growth +1.1/5.0
- Appreciation +0.0/10.0
$435,000
🖨 Deal sheet (PDF) 📄 Offer letter ✓ Due diligence
Multi-family units
County records classify this as Multi-Family (2-4 Unit). Listing-text estimate: 4 units. confirmed
Listing remarks MLS
Investors Dream!!! Check out the Gross Revenue on this and the LOCATION. Recently professionally remodeled with new roof, bath and kitchen cabinets, appliances etc. LOCATED Adjacent to the Bimini Basin and within walking distance to downtown Cape Coral's, restaurants, shops and neighborhood park and more. This 4-plex is fully occupied and leases have been recently renewed until approximately the end of 2023.. .the tenants have been long term tenants. Call me today to view this great opportunity.
Key facts
- Move-in condition
- Two laundry rooms
- A c units are newer
Tags
Neighborhood map
What this means for you Summary
Snapshot
- This is a 4 × 1-bed/1.0-bath units multifamily listed at $435k.
Deal economics
- At list price, monthly cash flow is $360 ($4k/yr) — positive. Per door: $90/mo.
- The deal already cash-flows at list — no discount required.
- Meets the 1% rule at list price ($5k rent vs $435k).
- Recommended offer: $422k (3.0% below list) — sets the bar for market timing.
- Cap rate 8.5% vs local median 3.1% in Cape Coral — top-decile yield for the area; either an underpriced asset or a hidden risk that comps aren't pricing in. Stress-test before assuming the spread holds.
Location & tenants
- Location reads 77/100 on livability (#208 in FL, #3,098 nationally) — a middle-class / working-renter tenant base. Strengths: housing A+, health & safety A+, amenities B+; Watch: commute F.
- Lee (suburban): math 47% / reading 50% proficiency, ranked #42 of 73 in FL (top 58%) — families likely to look elsewhere, expect single-tenant / working-renter base with shorter leases.
- Market conditions: Rents falling (-5.5%/yr); 820 active listings in the ZIP; 40 comparable units currently listed for rent nearby; rentals at typical pace (median 25d on market — plan ~3-4 weeks tenant-placement turnaround); 15,411 units permitted in Lee County in 2024 (4,686 in 5+ unit buildings).
- At $4,821/mo this rent would consume 81% of the median local household income ($71k/yr) (locally 1182% of renters already pay >50% of income on rent) — very limited rent-growth headroom before tenants either downsize or default.
Forward outlook
- Local home prices are declining (-3.0%/yr); year-one equity from $3k of loan paydown is wiped out by about $13k of value loss. Plan a longer hold.
- Lee County population projected at +44% by 2050 — long-run rental-demand tailwind backs the buy-and-hold thesis.
Negotiation context
- It's been on market 43 days — a 3% lower offer ($422k) is reasonable based on typical stale-listing flexibility.
- 4 sale attempts since 9y ago; this cycle's ask has dropped $40k (8%) from the opening price — seller is motivated, your offer sets the floor, not the list.
Risks & watch-outs
- Watch-outs: flood insurance adds $427/mo.
- Climate carrying-cost: in FEMA flood zone AE (mandatory federal flood insurance); severe wind risk, 99% chance of damaging wind over 30y; extreme-heat days projected 7→30/yr by 2055 (HVAC capex compounding) — expect insurance premiums to compound above CPI over the hold.
Questions for the listing agent
- It's been on market 43 days. Have you received any prior offers? Is the seller open to a 3% concession, seller financing, or rate buy-down credit?
- Can we see the unit-by-unit rent roll, current vacancy, and any below-market leases? What's the average tenancy length?
- What capital expenditures (roof, boiler, parking lot, exteriors) have been made in the last 5 years, and what's planned in the next 2?
- Built in 1964 — when were the roof, HVAC, electrical panel, plumbing, and water heater last replaced?
- What's the actual annual flood-insurance premium (NFIP or private), and is the property in a SFHA with mandatory coverage?
- Is there a deadline driving the sale (1031 exchange, divorce, estate, relocation)? That informs how much negotiation room exists.
- Schools are B-rated — typically a magnet for longer-tenancy family renters. What's the average tenant stay here, and is there a school-zone premium baked into asking?
- What's the average days-on-market for RENTAL listings here right now (not sales)? A rising rental-DOM trend means longer vacancies and softer asking-rent achievability than the comps imply.
- What's the recent tenant-quality profile in this submarket — average credit score on applications, eviction rate, late-payment / NSF rate, and stable-employment percentage? A property-management company in the area should have these aggregated.
- How much new apartment / multifamily construction is in the pipeline within 1–3 miles? Heavy new supply (>2% of stock underway) typically softens rents 12–24 months out; light construction supports rent growth.
Investment metrics
- 1% rule
- 1.11% ✓
- Cap rate
- 8.46%
- Cash-on-cash
- 7.75%
- DSCR
- 1.34
- GRM
- 7.5
CMA / ARV
No comps found within radius.
Projected returns pro-forma
-3.0% appreciation · 0.0% rent growth · sell at horizon
- IRR
- -14.6%
- Equity multiple
- 0.50×
- Total profit
- $-61,359
- Equity at exit
- $64,860
- IRR
- -12.7%
- Equity multiple
- 0.37×
- Total profit
- $-77,127
- Equity at exit
- $37,611
Cash invested: $121,800 (down + closing). Projections, not guarantees.
Landlord ↔ Tenant lean methodology
- Overall (STATE)
- 87 Strongly Landlord-Friendly
- State Florida
- 87 Strongly Landlord-Friendly · R+3
- County
- — inherits STATE
- City
- — inherits STATE
ZIP-level market 33904
- Rents YoY
- -5.5%
- Active inventory
- 820
- Price-to-rent
- 30.1×
Monthly cashflow live
- Estimated rent
- $4,821 medium interval (Pro) →
- Mortgage (P&I)
- −$2,281
- Tax from tax record
- −$560 /mo · $6,718/yr
- Insurance
- −$181
- Flood insurance flood zone
- −$427 /mo · $5,118/yr
- HOA
- −$0
- Vacancy / Maint / Mgmt
- −$1,012
- Net cashflow
- $360
Break-even live
Sensitivity live
| Price | -10% $606 | -5% $483 | +0% $360 | +5% $237 | +10% $114 |
|---|---|---|---|---|---|
| Rent | -10% $-21 | -5% $169 | +0% $360 | +5% $550 | +10% $741 |
| Rate | -1.0pp $579 | -0.5pp $470 | base $360 | +0.5pp $247 | +1.0pp $132 |
4-unit breakdown (identical units grouped — click to expand)
| Units | Beds | Baths | Est. rent |
|---|---|---|---|
| 4× units | 1 | 1 | $4,820 |
| #1 | 1 | 1 | $1,205 |
| #2 | 1 | 1 | $1,205 |
| #3 | 1 | 1 | $1,205 |
| #4 | 1 | 1 | $1,205 |
| Total (4 units) | $4,821 | ||
UW: 25.0% down · 7.5% · 30yr · 1.5% tax · 5.0% vac · 8.0% maint · 8.0% mgmt
Financing live
Cash to close
- Down payment
- $108,750
- Closing costs
- $13,050
- Reserves months
- —
- Total cash needed
- —
Loan-product check · same deal, 3 products live
Conventional
25% down · 7.5% · 30yr
- Down + closing
- —
- Monthly P&I
- —
- Monthly cashflow
- —
- DSCR
- —
- Eligible?
- —
Personal DTI + credit; lowest rate.
DSCR
20% down · 8.5% · 30yr
- Down + closing
- —
- Monthly P&I
- —
- Monthly cashflow
- —
- DSCR
- —
- Eligible?
- —
No personal income docs; deal must DSCR.
Hard money
10% down · 12.0% · 12mo
- Down + closing
- —
- Monthly P&I
- —
- Monthly cashflow
- —
- DSCR
- —
- Eligible?
- —
Short-term bridge; refi at stabilization.
Rent comps 40 comps
| Address | Beds | Baths | Sqft | Rent | $/sqft | DOM | Units | Dist |
|---|---|---|---|---|---|---|---|---|
| 416 Tudor Dr Unit B-3 Cape Coral, FL | 2.0 | 2.0 | 1200 | $1,850 | $1.54 | 24d | 1 | 0.05mi |
| 408 Tudor Dr Cape Coral, FL | 2.0 | 2.0 | 1389 | $2,500 | $1.80 | 4d | 1 | 0.06mi |
| 329 Tudor Dr Unit R Cape Coral, FL | 2.0 | 2.0 | 1052 | $1,395 | $1.33 | 4d | 1 | 0.06mi |
| 4826 Marine Dr Unit 2 Cape Coral, FL | 3.0 | 2.0 | 1190 | $1,400 | $1.18 | 24d | 1 | 0.11mi |
| 4834 Tudor Dr Unit 4834 Cape Coral, FL | 2.0 | 2.0 | 1200 | $2,150 | $1.79 | 24d | 1 | 0.14mi |
| 4808 Lucaya Dr Unit 3 Cape Coral, FL | 2.0 | 2.0 | 1090 | $1,300 | $1.19 | 14d | 1 | 0.16mi |
| 4808 Lucaya Dr Unit 3 Cape Coral, FL | 2.0 | 2.0 | 1090 | $1,400 | $1.28 | 24d | 1 | 0.16mi |
| 4808 Lucaya Dr Unit 3 Cape Coral, FL | 2.0 | 2.0 | 1090 | $1,300 | $1.19 | 15d | 1 | 0.16mi |
| 440 Cape Coral Pkwy E Cape Coral, FL | 3.0 | 1.0–2.0 | 1003 | $3,567 | $3.55 | 2d | 95 | 0.22mi |
| 4803 Sunset Ct #402 Cape Coral, FL | 2.0 | 2.0 | 1158 | $1,550 | $1.34 | 11d | 1 | 0.26mi |
| 4711 SE 5th Ave #5 Cape Coral, FL | 2.0 | 2.0 | 1200 | $2,100 | $1.75 | 24d | 1 | 0.35mi |
| 632 Victoria Dr #201 Cape Coral, FL | 2.0 | 2.0 | 1165 | $1,500 | $1.29 | 24d | 1 | 0.40mi |
| 4815 Triton Ct E Unit 11 Cape Coral, FL | 2.0 | 2.0 | 1204 | $1,250 | $1.04 | 24d | 1 | 0.42mi |
| 4815 Triton Ct E Unit 11 Cape Coral, FL | 2.0 | 2.0 | 1204 | $1,250 | $1.04 | 3d | 1 | 0.42mi |
| 206 SE 46th Ter Cape Coral, FL | 3.0 | 2.0 | 1739 | $1,949 | $1.12 | 24d | 1 | 0.47mi |
| 4613 SE 5th Ave #203 Cape Coral, FL | 2.0 | 2.0 | 1117 | $1,500 | $1.34 | 24d | 1 | 0.48mi |
| 4711 Santa Barbara Blvd #1 Cape Coral, FL | 2.0 | 2.0 | 1272 | $2,500 | $1.97 | 24d | 1 | 0.49mi |
| 251 SE 46th St Cape Coral, FL | 3.0 | 2.5 | 1370 | $4,500 | $3.28 | 24d | 1 | 0.50mi |
| 728 Victoria Dr #101 Cape Coral, FL | 2.0 | 2.0 | 1193 | $2,250 | $1.89 | 24d | 1 | 0.52mi |
| 4525 Country Club Blvd #112 Cape Coral, FL | 2.0 | 2.0 | 1195 | $1,800 | $1.51 | 24d | 1 | 0.53mi |
| 724 Sesame Ct Cape Coral, FL | 2.0 | 1.0 | 1240 | $1,650 | $1.33 | 3d | 1 | 0.57mi |
| 712 SE 47th St Unit Left Side Cape Coral, FL | 2.0 | 1.0 | 1740 | $1,800 | $1.03 | 15d | 1 | 0.58mi |
| 120 SE 46th St Cape Coral, FL | 3.0 | 2.0 | 1993 | $2,926 | $1.47 | 4d | 1 | 0.58mi |
| 5105 Coronado Pkwy Apt 103 Cape Coral, FL | 3.0 | 2.0 | 1333 | $1,650 | $1.24 | 24d | 1 | 0.60mi |
| 4912 York St Unit 3 Cape Coral, FL | 2.0 | 2.0 | 1070 | $1,375 | $1.29 | 24d | 1 | 0.60mi |
| 621 SE 46th Ter Cape Coral, FL | 3.0 | 2.0 | 1360 | $1,450 | $1.07 | 15d | 1 | 0.62mi |
| 5135 Coronado Pkwy Cape Coral, FL | 2.0 | 2.0 | 1406 | $1,625 | $1.16 | 22d | 4 | 0.63mi |
| 718 SE 46th Ln #102 Cape Coral, FL | 2.0 | 2.0 | 1089 | $1,250 | $1.15 | 15d | 1 | 0.63mi |
| 131 SW 47th Ter #204 Cape Coral, FL | 2.0 | 2.0 | 1167 | $3,300 | $2.83 | 22d | 1 | 0.64mi |
| 131 SW 47th Ter Cape Coral, FL | 2.0 | 2.0 | 1167 | $2,275 | $1.95 | 24d | 2 | 0.64mi |
| 828 Victoria Dr Unit B14 Cape Coral, FL | 1.0 | 1.0 | 1334 | $1,500 | $1.12 | 4d | 1 | 0.69mi |
| 4528 SE 5th Pl Cape Coral, FL | 2.0 | 2.0 | 1107 | $1,495 | $1.35 | 24d | 1 | 0.71mi |
| 4528 SE 5th Pl #8 Cape Coral, FL | 2.0 | 2.0 | 1107 | $1,500 | $1.36 | 20d | 1 | 0.71mi |
| 159 SW 47th Ter #103 Cape Coral, FL | 2.0 | 2.0 | 1150 | $3,300 | $2.87 | 24d | 1 | 0.73mi |
| 4331 SE 1st Ave Cape Coral, FL | 3.0 | 2.0 | 1336 | $2,400 | $1.80 | 24d | 1 | 0.74mi |
| 130 SE 44th St Cape Coral, FL | 3.0 | 2.0 | 1841 | $5,000 | $2.72 | 24d | 1 | 0.76mi |
| 5221 York Ct Cape Coral, FL | 3.0 | 2.0 | 1300 | $2,600 | $2.00 | 24d | 1 | 0.77mi |
| 4425 SW Santa Barbara Pl Cape Coral, FL | 3.0 | 2.0 | 1170 | $1,695 | $1.45 | 2d | 1 | 0.78mi |
| 870 SE 47th Ter Cape Coral, FL | 2.0 | 1.0–2.0 | 795 | $2,005 | $2.52 | 2d | 17 | 0.80mi |
| 5367 Coral Ave Cape Coral, FL | 3.0 | 2.0 | 1436 | $1,900 | $1.32 | 20d | 1 | 0.81mi |
Listing history 25 events
-
2026-04-23status Pending
-
2026-03-31price $435,000
-
2026-03-18price $450,000
-
2026-03-11$475,000 Active
-
2023-06-12soldstatus $410,000 Closed 501-char remark
Show marketing remark (501 chars)
Investors Dream!!! Check out the Gross Revenue on this and the LOCATION. Recently professionally remodeled with new roof, bath and kitchen cabinets, appliances etc. LOCATED Adjacent to the Bimini Basin and within walking distance to downtown Cape Coral's, restaurants, shops and neighborhood park and more. This 4-plex is fully occupied and leases have been recently renewed until approximately the end of 2023.. .the tenants have been long term tenants. Call me today to view this great opportunity.
-
2023-04-29status Pending 501-char remark
Show marketing remark (501 chars)
Investors Dream!!! Check out the Gross Revenue on this and the LOCATION. Recently professionally remodeled with new roof, bath and kitchen cabinets, appliances etc. LOCATED Adjacent to the Bimini Basin and within walking distance to downtown Cape Coral's, restaurants, shops and neighborhood park and more. This 4-plex is fully occupied and leases have been recently renewed until approximately the end of 2023.. .the tenants have been long term tenants. Call me today to view this great opportunity.
-
2023-03-27price $475,000 501-char remark
Show marketing remark (501 chars)
Investors Dream!!! Check out the Gross Revenue on this and the LOCATION. Recently professionally remodeled with new roof, bath and kitchen cabinets, appliances etc. LOCATED Adjacent to the Bimini Basin and within walking distance to downtown Cape Coral's, restaurants, shops and neighborhood park and more. This 4-plex is fully occupied and leases have been recently renewed until approximately the end of 2023.. .the tenants have been long term tenants. Call me today to view this great opportunity.
-
2023-02-15$500,000 Active 501-char remark
Show marketing remark (501 chars)
Investors Dream!!! Check out the Gross Revenue on this and the LOCATION. Recently professionally remodeled with new roof, bath and kitchen cabinets, appliances etc. LOCATED Adjacent to the Bimini Basin and within walking distance to downtown Cape Coral's, restaurants, shops and neighborhood park and more. This 4-plex is fully occupied and leases have been recently renewed until approximately the end of 2023.. .the tenants have been long term tenants. Call me today to view this great opportunity.
-
2018-11-30soldstatus $270,000
-
2018-11-29soldstatus $270,000 Sold 485-char remark
Show marketing remark (485 chars)
Amazing cash returns on this updated legal 4 unit complex. Home offers two 1 bed and 1 bath apartments and two efficiency apartments with kitchenettes. Fantastic Bimini Basin neighborhood with high rental demands. Convenient location to downtown restaurants, clubs and festivals. Newer roof with plenty of parking. This is your cash cow! Cap rate is 8.4%. Cash on cash return is 14.6% with an 80% LTV. Financial Analysis attached. Call today for a showing, this one will not last long!
-
2018-10-26status Pending With Contingencies 485-char remark
Show marketing remark (485 chars)
Amazing cash returns on this updated legal 4 unit complex. Home offers two 1 bed and 1 bath apartments and two efficiency apartments with kitchenettes. Fantastic Bimini Basin neighborhood with high rental demands. Convenient location to downtown restaurants, clubs and festivals. Newer roof with plenty of parking. This is your cash cow! Cap rate is 8.4%. Cash on cash return is 14.6% with an 80% LTV. Financial Analysis attached. Call today for a showing, this one will not last long!
-
2018-10-17price $279,900 485-char remark
Show marketing remark (485 chars)
Amazing cash returns on this updated legal 4 unit complex. Home offers two 1 bed and 1 bath apartments and two efficiency apartments with kitchenettes. Fantastic Bimini Basin neighborhood with high rental demands. Convenient location to downtown restaurants, clubs and festivals. Newer roof with plenty of parking. This is your cash cow! Cap rate is 8.4%. Cash on cash return is 14.6% with an 80% LTV. Financial Analysis attached. Call today for a showing, this one will not last long!
-
2018-10-02$289,900 Active 485-char remark
Show marketing remark (485 chars)
Amazing cash returns on this updated legal 4 unit complex. Home offers two 1 bed and 1 bath apartments and two efficiency apartments with kitchenettes. Fantastic Bimini Basin neighborhood with high rental demands. Convenient location to downtown restaurants, clubs and festivals. Newer roof with plenty of parking. This is your cash cow! Cap rate is 8.4%. Cash on cash return is 14.6% with an 80% LTV. Financial Analysis attached. Call today for a showing, this one will not last long!
-
2018-01-22soldstatus $155,500
-
2018-01-09soldstatus $155,500 Sold
-
2017-12-01status Pending With Contingencies
-
2017-10-25$159,900 Active
-
2015-03-02price $52,000
-
2012-12-12soldstatus $425,000
-
2010-09-15soldstatus $55,700
-
2004-02-13soldstatus $164,500
-
2003-07-14soldstatus $118,000
-
2003-07-08soldstatus $118,000
-
2003-06-06price $129,000
-
1997-12-31soldstatus $82,000
ⓘ Source: listings_history table (triggers on properties + properties_extension) + one-shot
backfill from property_details.listing_events for pre-trigger history.
Tax reassessment forecast FL · Resets to sale price
- Current annual tax
- $6,718 · $560/mo
- Projected year-2 tax
- $6,718 · $560/mo
- Expected delta
- $0/yr ($0/mo · 0.0%)
ⓘ Screening estimate from a state-policy table — verify with the county assessor before closing.
Climate risk First Street
- Flood 9/10 Extreme FEMA zone AE · 99% chance over 30 yrs
- Wildfire 1/10 Low
- Heat 10/10 Extreme 7 d/yr ≥107°F today · 30 d/yr by 30 yrs out
- Wind 10/10 Extreme 99% chance of damaging wind over 30 yrs
- Air quality 2/10 Low 1 unhealthy d/yr today · 1 by 30 yrs out
Nearby sold comps map
Loading sold comps map…
Walkable amenities ~0.75 mi
Loading nearby amenities…
Taxation est. · year 1
- Rental income
- $57,852
- − Mortgage interest
- −$24,367
- − Property taxes
- −$6,718
- − Insurance
- −$7,294
- − Repairs & maintenance
- −$4,628
- − Management
- −$4,628
- − Depreciation
- −$12,655
- Taxable loss
- −$2,437
- Est. tax savings @ 24.0%
- +$585
- After-tax cash flow
- $4,902/yr
For passive investors: Depreciation is non-cash, so a rental often shows a tax loss while cash-flowing — sheltering income. Rental losses are passive: they offset passive income freely, and up to $25,000/yr can offset ordinary (W-2) income if you actively participate and your MAGI is under $100k (phasing out to $0 by $150k); unused losses carry forward. On sale, claimed depreciation is recaptured at up to 25%, and gains may owe capital-gains tax (a 1031 exchange can defer both). Figures are a year-1 estimate at your 24.0% rate — not tax advice; consult a CPA.
Schools (NCES district)
- District
- Lee
- NCES district ID
- 1201080
- Math proficiency
- 47% ▼ -11.00%
- Reading proficiency
- 50% ▼ -4.00%
- Median HH income
- $49,518
- Composite
- 41.49/100
- National rank
- #3458
- State rank
- #42 of 73 in FL
Livability — Cape Coral
- Score
- 77/100
- State rank
- #208
- US rank
- #3098
Category grades
Schools grade is shown separately in the Schools card above.
Census & demographics
- Census place
- Cape Coral, FL
- County
- Lee County · 788,662 people
- City population
- 217,388
- Metro
- Cape Coral-Fort Myers, FL
- Population (ZIP)
- 33,599
- Household income
- $71,190
- Rent vs Own
- Severe rent burden
- 1182.0
Population outlook (Lee County) Hauer SSP2
- Today (2025)
- 871,946 people
- By 2030
- 955,468 · +9.6%
- By 2040
- 1,113,587 · +27.7%
- By 2050
- 1,256,891 · +44.1%
- By 2075
- 1,560,270 · +78.9%
- By 2100
- 1,726,848 · +98.0%
Race, ethnicity, and origin ACS 2023
- Neighborhood character
- Predominantly White (76%)
- Race & ethnicity
- White 76% Hispanic / Latino 16% Two or more races 11% Black 3% Asian 2%
- Hispanic origin (detail)
- Mexican 2% Puerto Rican 2% Cuban 9%
- Common ancestry
- Romanian 4% Lithuanian 2% Slovak 2%
- Foreign-born
- 14% · Canada, China, Jamaica
- Languages at home
- 82% English-only · Spanish 13% Other Indo-European 1% Chinese 1%
Political lean MEDSL · Lee
- 2024 margin
- Strong R (+28.4) · D 35.5% · R 63.9%
- 2008→2024 swing
- -18.0pp toward R · 2008: -10.4pp · 2024: -28.4pp
- All cycles
- 2024: R+28.4 2020: R+19.2 2016: R+20.4 2012: R+16.6 2008: R+10.4
Not yet ingested
- Civics
- —
Market trends
- HPI YoY
- ▼ -190.05%
- Current HPI
- 266.3458
- Rent YoY
- ▼ -5.48%
- Metro
- Cape Coral-Fort Myers, FL
- State GDP YoY
- ▲ 3.28%
- F500 in state
- 36
Industry mix (Fortune 500 HQ in FL)
| Industry | F500 HQs | Revenue |
|---|---|---|
| Industrial Technology | 2 | $29B |
|
||
| Insurance | 2 | $17B |
|
||
| Retail | 1 | $60B |
|
||
| Technology Distribution | 1 | $58B |
|
||
| Homebuilding | 1 | $35B |
|
||
| Technology Manufacturing | 1 | $35B |
|
||
Price history
+430.5% since first listed25 events — show timeline
- 2026-04-23 Pending — FORTMLS
- 2026-03-31 Price Changed $435,000 FORTMLS
- 2026-03-18 Price Changed $450,000 FORTMLS
- 2026-03-11 Listed $475,000 FORTMLS
- 2023-06-12 Sold (MLS) $410,000 FORTMLS
- 2023-04-29 Pending — FORTMLS
- 2023-03-27 Price Changed $475,000 FORTMLS
- 2023-02-15 Listed $500,000 FORTMLS
- 2018-11-30 Sold (Public Records) $270,000 Public Records
- 2018-11-29 Sold (MLS) $270,000 FORTMLS
- 2018-10-26 Pending — FORTMLS
- 2018-10-17 Price Changed $279,900 FORTMLS
- 2018-10-02 Listed $289,900 FORTMLS
- 2018-01-22 Sold (Public Records) $155,500 Public Records
- 2018-01-09 Sold (MLS) $155,500 FORTMLS
- 2017-12-01 Pending — FORTMLS
- 2017-10-25 Listed $159,900 FORTMLS
- 2015-03-02 Price Changed $52,000 FORTMLS
- 2012-12-12 Sold (Public Records) $425,000 Public Records
- 2010-09-15 Sold (MLS) $55,700 FORTMLS
- 2004-02-13 Sold (Public Records) $164,500 Public Records
- 2003-07-14 Sold (Public Records) $118,000 Public Records
- 2003-07-08 Sold (MLS) $118,000 FORTMLS
- 2003-06-06 Price Changed $129,000 FORTMLS
- 1997-12-31 Sold (Public Records) $82,000 Public Records
Property tax history
+9.9%/yrLatest (2025): $6,718 · +11.3% YoY. Source: county tax records.
Cash-flow waterfall
monthlySold comps — $/sqft
last 12 mo · ≤1 miLoading sold comps…