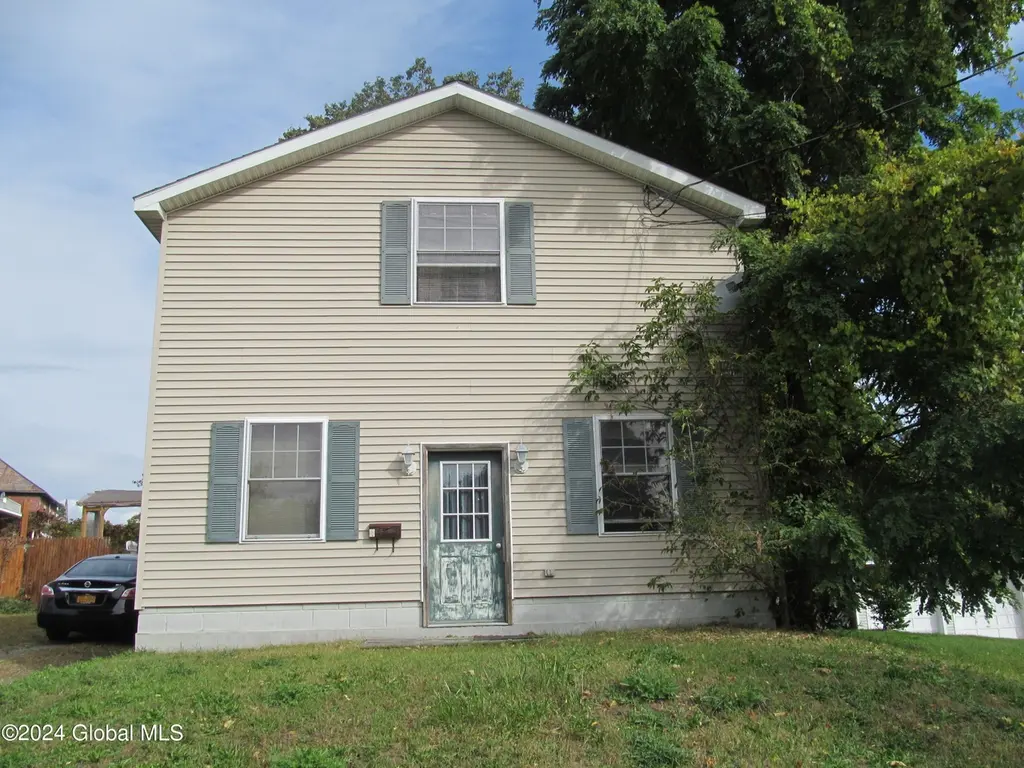
4 Bridge St · Greenwich, NY
Flood risk 1/10 · Minimal
- FEMA flood zone
- X
- Chance of flooding over 30 yrs
- 0.0%
- Est. flood insurance / yr
- $507 – $1,088
Fire risk 3/10 · Minor
- Est. fire insurance / yr
- $691 – $1,283
Heat risk 3/10 · Minor
- Hot days now (above 94°F)
- 7 days/yr
- Hot days in 30 yrs
- 17 days/yr
Wind risk 2/10 · Minimal
- Chance of severe wind over 30 yrs
- 4.0%
Air-quality risk 2/10 · Minimal
- Unhealthy air days now
- 0 days/yr
- Unhealthy air days in 30 yrs
- 1 days/yr
Risk factors via First Street. Map © Google.
Why this score? — see what drove the F grade
The composite is a weighted blend of 9 inputs, each scored 0–100. Each bar is that input's sub-score; the figure is the points it added to the 100-point composite (weight × sub-score).
- Appreciation +10.0/10.0
- ARV discount +7.5/15.0
- Schools +5.3/10.0
- Livability +3.5/5.0
- Rent growth +2.5/5.0
- Condition / age +2.5/5.0
- 1% rule +1.2/10.0
- Cash flow +0.9/30.0
- DSCR +0.0/10.0
$143,000
🖨 Deal sheet (PDF) 📄 Offer letter ✓ Due diligence
Listing remarks MLS
Many possibilities await this highly traffic area property. Zoned residential/commercial. Live upstairs & have your business on 1st floor! Battenkill River nearby and walk to all the local conveniences. Get your business started & live efficiently in this historical tourist community.
Key facts
- Zoned residential
- Zoned commercial
- 3,049 sq ft lot
Tags
Neighborhood map
What this means for you Summary
Snapshot
- This is a 1-bed/1.0-bath single-family listed at $143k.
Deal economics
- At list price, monthly cash flow is $-596 ($-7k/yr) — negative.
- To cash-flow at today's rent, offer at most $102k (28.6% below list).
- To meet the 1% rule (rent ≥ 1% of price), the offer needs to be $89k (37.5% below list).
- Recommended offer: $89k (37.5% below list) — sets the bar for 1% rule.
Location & tenants
- Location reads 69/100 on livability (#507 in NY) — a middle-class / working-renter tenant base. Strengths: housing A+, crime A-, employment A-; Watch: health & safety D, amenities F, commute F.
- Greenwich Central School District (town): math 59% / reading 60% proficiency, ranked #266 of 755 in NY (top 35%) — acceptable for families but not a draw, mixed tenant base, ~2y average lease.
- Zoned schools: Greenwich Elementary School (math 44% / reading 64%, grade C, #908 of 2,108 statewide, top 46%, 466 students, 37% FRL); Greenwich Junior-Senior High School (math 98% / reading 87%, grade A+, #158 of 1,100 statewide, top 15%, 429 students, 32% FRL).
- Zoned-school proficiency averages 73% at this address vs 60% district-wide (+14 pts) — the actual schools serving this property are materially stronger than the Greenwich Central School District average implies; a family-tenant draw the district grade alone would hide.
- Market conditions: 24 active listings in the ZIP; 106 units permitted in Washington County in 2024 (0 in 5+ unit buildings).
Forward outlook
- In year one you build about $15k of equity ($989 loan paydown + $14k appreciation (10.0% local appreciation)).
- Washington County population projected at -20% by 2050 — secular population decline; favor cash flow + early exit over multi-decade hold.
- By year 3, paydown + projected appreciation supports a ~$39k cash-out refi (75% LTV) — recoverable capital for the next deal without selling this one.
Negotiation context
- It's been on market 242 days — a 12% lower offer ($126k) is reasonable based on typical stale-listing flexibility.
- 4 sale attempts since 14y ago; this cycle's ask has dropped $10k (7%) from the opening price — seller is motivated, your offer sets the floor, not the list.
Risks & watch-outs
- Watch-outs: property tax is 4.1% of price.
Questions for the listing agent
- What do current leases actually rent for vs. the listed asking? Can we see a recent rent roll and the last 12 months of T-12 income?
- It's been on market 242 days. Have you received any prior offers? Is the seller open to a 38% concession, seller financing, or rate buy-down credit?
- Property tax is high relative to price — has the assessment been appealed recently, and will the sale trigger a re-assessment?
- Why hasn't it sold? Are there any deal-killer items the seller is aware of (foundation, flood, title, zoning, code violations)?
- Is there a deadline driving the sale (1031 exchange, divorce, estate, relocation)? That informs how much negotiation room exists.
- Schools are B-rated — typically a magnet for longer-tenancy family renters. What's the average tenant stay here, and is there a school-zone premium baked into asking?
- The area grade is low — what's the realistic commute time and amenity access for the typical tenant pool here? Any planned neighborhood developments (good or bad) we should know about?
- What's the average days-on-market for RENTAL listings here right now (not sales)? A rising rental-DOM trend means longer vacancies and softer asking-rent achievability than the comps imply.
- What's the recent tenant-quality profile in this submarket — average credit score on applications, eviction rate, late-payment / NSF rate, and stable-employment percentage? A property-management company in the area should have these aggregated.
- How much new for-sale + rental construction is in the pipeline within 1–3 miles? Heavy new supply typically softens prices + rents 12–24 months out; constrained supply supports both.
Investment metrics
- 1% rule
- 0.62% ✗
- Cap rate
- 1.29%
- Cash-on-cash
- -17.88%
- DSCR
- 0.20
- GRM
- 13.3
CMA / ARV
- ARV (median comp)
- $290,735
- List price
- $143,000
- Delta
- -50.81%
- Verdict
- UNDERPRICED
- Comps
- 3 within 2.0 mi
Projected returns pro-forma
10.0% appreciation · 3.0% rent growth · sell at horizon
- IRR
- 12.0%
- Equity multiple
- 2.00×
- Total profit
- $40,100
- Equity at exit
- $128,826
- IRR
- 12.7%
- Equity multiple
- 4.71×
- Total profit
- $148,371
- Equity at exit
- $277,818
Cash invested: $40,040 (down + closing). Projections, not guarantees.
Landlord ↔ Tenant lean methodology
- Overall (STATE)
- 15 Strongly Tenant-Friendly
- State New York
- 15 Strongly Tenant-Friendly · D+10
- County
- — inherits STATE
- City
- — inherits STATE
ZIP-level market 12834
- Home prices YoY
- 21.5%
- Active inventory
- 24
- Price-to-rent
- 13.3×
Monthly cashflow live
- Estimated rent
- $893 medium interval (Pro) →
- Mortgage (P&I)
- −$750
- Tax from tax record
- −$493 /mo · $5,911/yr
- Insurance
- −$60
- HOA
- −$0
- Vacancy / Maint / Mgmt
- −$188
- Net cashflow
- $-596
Break-even live
Sensitivity live
| Price | -10% $-515 | -5% $-556 | +0% $-596 | +5% $-637 | +10% $-677 |
|---|---|---|---|---|---|
| Rent | -10% $-667 | -5% $-632 | +0% $-596 | +5% $-561 | +10% $-526 |
| Rate | -1.0pp $-524 | -0.5pp $-560 | base $-596 | +0.5pp $-634 | +1.0pp $-671 |
UW: 25.0% down · 7.5% · 30yr · 1.5% tax · 5.0% vac · 8.0% maint · 8.0% mgmt
Financing live
Cash to close
- Down payment
- $35,750
- Closing costs
- $4,290
- Reserves months
- —
- Total cash needed
- —
Loan-product check · same deal, 3 products live
Conventional
25% down · 7.5% · 30yr
- Down + closing
- —
- Monthly P&I
- —
- Monthly cashflow
- —
- DSCR
- —
- Eligible?
- —
Personal DTI + credit; lowest rate.
DSCR
20% down · 8.5% · 30yr
- Down + closing
- —
- Monthly P&I
- —
- Monthly cashflow
- —
- DSCR
- —
- Eligible?
- —
No personal income docs; deal must DSCR.
Hard money
10% down · 12.0% · 12mo
- Down + closing
- —
- Monthly P&I
- —
- Monthly cashflow
- —
- DSCR
- —
- Eligible?
- —
Short-term bridge; refi at stabilization.
Listing history 34 events
-
2026-06-21days on market $143,000 Active 242 DOM
-
2026-06-21days on market $143,000 Active 241 DOM
-
2026-06-18days on market $143,000 Active 239 DOM
-
2026-06-17days on market $143,000 Active 238 DOM
-
2026-06-16days on market $143,000 Active 237 DOM
-
2026-06-15days on market $143,000 Active 236 DOM
-
2026-06-13days on market $143,000 Active 234 DOM
-
2026-06-12days on market $143,000 Active 233 DOM
-
2026-06-09days on market $143,000 Active 230 DOM
-
2026-06-08days on market $143,000 Active 229 DOM
-
2026-06-07days on market $143,000 Active 228 DOM
-
2026-06-07days on market $143,000 Active 227 DOM
-
2026-06-04days on market $143,000 Active 224 DOM
-
2026-06-02days on market $143,000 Active 223 DOM
-
2026-06-01days on market $143,000 Active 222 DOM
-
2026-05-31days on market $143,000 Active 221 DOM
-
2025-12-02price $143,000 294-char remark
Show marketing remark (294 chars)
Many possibilities await this highly traffic area property. Zoned residential/commercial. Live upstairs & have your business on 1st floor! Battenkill River nearby and walk to all the local conveniences. Get your business started & live efficiently in this historical tourist community.
-
2025-10-28price $149,000 294-char remark
Show marketing remark (294 chars)
Many possibilities await this highly traffic area property. Zoned residential/commercial. Live upstairs & have your business on 1st floor! Battenkill River nearby and walk to all the local conveniences. Get your business started & live efficiently in this historical tourist community.
-
2025-10-22$153,000 Active 294-char remark
Show marketing remark (294 chars)
Many possibilities await this highly traffic area property. Zoned residential/commercial. Live upstairs & have your business on 1st floor! Battenkill River nearby and walk to all the local conveniences. Get your business started & live efficiently in this historical tourist community.
-
2025-05-23status Pending
-
2025-05-23historical
-
2025-04-15price $139,900
-
2025-03-25price $159,900
-
2025-01-13price $165,000
-
2024-12-09price $169,900
-
2024-12-02price $179,900
-
2024-11-19price $189,900
-
2024-11-09price $199,900
-
2024-10-25price $249,900
-
2024-10-03$262,000 Active
-
2013-06-21historical
-
2013-06-20historical
-
2013-01-28$129,000
-
2012-12-21$129,000
ⓘ Source: listings_history table (triggers on properties + properties_extension) + one-shot
backfill from property_details.listing_events for pre-trigger history.
Tax reassessment forecast NY · Partial reset (capped growth)
- Current annual tax
- $5,911 · $493/mo
- Projected year-2 tax
- $5,911 · $493/mo
- Expected delta
- $0/yr ($0/mo · -0.0%)
ⓘ Screening estimate from a state-policy table — verify with the county assessor before closing.
Climate risk First Street
- Flood 1/10 Low FEMA zone X · 0% chance over 30 yrs
- Wildfire 3/10 Moderate
- Heat 3/10 Moderate 7 d/yr ≥94°F today · 17 d/yr by 30 yrs out
- Wind 2/10 Low 4% chance of damaging wind over 30 yrs
- Air quality 2/10 Low 0 unhealthy d/yr today · 1 by 30 yrs out
Nearby sold comps map
Loading sold comps map…
Walkable amenities ~0.75 mi
Loading nearby amenities…
Taxation est. · year 1
- Rental income
- $10,719
- − Mortgage interest
- −$8,010
- − Property taxes
- −$5,911
- − Insurance
- −$715
- − Repairs & maintenance
- −$857
- − Management
- −$857
- − Depreciation
- −$4,160
- Taxable loss
- −$9,793
- Est. tax savings @ 24.0%
- +$2,350
- After-tax cash flow
- $-4,807/yr
For passive investors: Depreciation is non-cash, so a rental often shows a tax loss while cash-flowing — sheltering income. Rental losses are passive: they offset passive income freely, and up to $25,000/yr can offset ordinary (W-2) income if you actively participate and your MAGI is under $100k (phasing out to $0 by $150k); unused losses carry forward. On sale, claimed depreciation is recaptured at up to 25%, and gains may owe capital-gains tax (a 1031 exchange can defer both). Figures are a year-1 estimate at your 24.0% rate — not tax advice; consult a CPA.
Schools (NCES district)
- District
- Greenwich Central School District
- NCES district ID
- 3612900
- Math proficiency
- 59% ▲ 2.00%
- Reading proficiency
- 60% ▼ -2.00%
- Median HH income
- $62,128
- Composite
- 53.45/100
- National rank
- #3147
- State rank
- #266 of 755 in NY
Livability — Greenwich
- Score
- 69/100
- State rank
- #507
- US rank
- #8929
Category grades
Schools grade is shown separately in the Schools card above.
Census & demographics
- Census place
- Greenwich, NY
- Population (ZIP)
- 6,137
Population outlook (Washington County) Hauer SSP2
- Today (2025)
- 59,576 people
- By 2030
- 57,618 · -3.3%
- By 2040
- 52,751 · -11.5%
- By 2050
- 47,514 · -20.2%
- By 2075
- 35,690 · -40.1%
- By 2100
- 24,807 · -58.4%
Race, ethnicity, and origin ACS 2023
- Neighborhood character
- Predominantly White (95%)
- Race & ethnicity
- White 95% Hispanic / Latino 3% Two or more races 2% Asian 1%
- Common ancestry
- Lithuanian 6% Romanian 4% Iranian 3%
- Foreign-born
- 4% · Canada, China
- Languages at home
- 96% English-only · Chinese 1% French/Haitian/Cajun 1% Spanish 1%
Political lean MEDSL · Washington
- 2024 margin
- Strong R (+21.2) · D 39.4% · R 60.6%
- 2008→2024 swing
- -22.0pp toward R · 2008: 0.8pp · 2024: -21.2pp
- All cycles
- 2024: R+21.2 2020: R+15.6 2016: R+20.2 2012: D+1.6 2008: D+0.8
Not yet ingested
- Civics
- —
Market trends
- HPI YoY
- ▲ 66.00%
- Current HPI
- 373.2809
- Rent YoY
- —
- Metro
- —
- State GDP YoY
- ▲ 2.60%
- F500 in state
- 92
Industry mix (Fortune 500 HQ in NY)
| Industry | F500 HQs | Revenue |
|---|---|---|
| Financial Services | 10 | $950B |
|
||
| Consumer Goods | 9 | $162B |
|
||
| Insurance | 4 | $225B |
|
||
| Telecommunications | 2 | $144B |
|
||
| Pharmaceuticals | 2 | $112B |
|
||
| Media / Entertainment | 2 | $69B |
|
||
Price history
+10.9% since first listed18 events — show timeline
- 2025-12-02 Price Changed $143,000 Global MLS
- 2025-10-28 Price Changed $149,000 Global MLS
- 2025-10-22 Listed $153,000 Global MLS
- 2025-05-23 Pending — Global MLS
- 2025-05-23 Listing Removed — Global MLS
- 2025-04-15 Price Changed $139,900 Global MLS
- 2025-03-25 Price Changed $159,900 Global MLS
- 2025-01-13 Price Changed $165,000 Global MLS
- 2024-12-09 Price Changed $169,900 Global MLS
- 2024-12-02 Price Changed $179,900 Global MLS
- 2024-11-19 Price Changed $189,900 Global MLS
- 2024-11-09 Price Changed $199,900 Global MLS
- 2024-10-25 Price Changed $249,900 Global MLS
- 2024-10-03 Listed $262,000 Global MLS
- 2013-06-21 Listing Removed — Global MLS
- 2013-06-20 Listing Removed — Global MLS
- 2013-01-28 Listed $129,000 Global MLS
- 2012-12-21 Listed $129,000 Global MLS
Property tax history
+3.3%/yrLatest (2025): $5,911 · +8.1% YoY. Source: county tax records.
Cash-flow waterfall
monthlySold comps — $/sqft
last 12 mo · ≤1 miLoading sold comps…