 Triplex
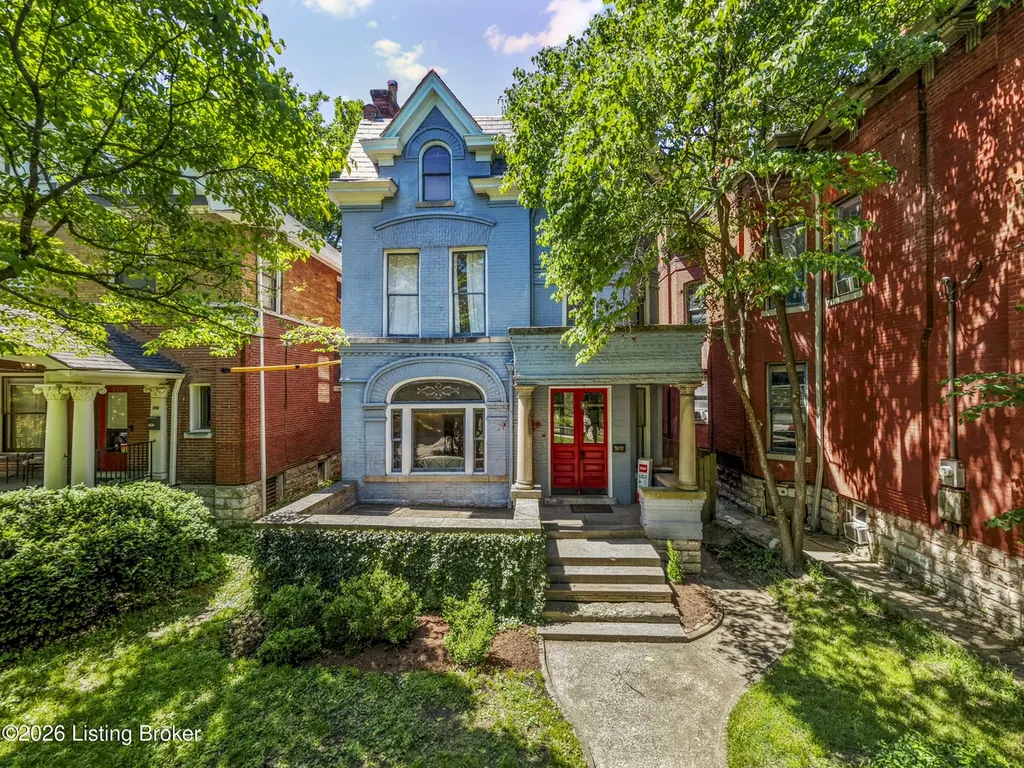
920 Cherokee Rd · Louisville, KY
Flood risk 1/10 · Minimal
- FEMA flood zone
- X (unshaded)
- Chance of flooding over 30 yrs
- 0.0%
- Est. flood insurance / yr
- $473 – $860
Fire risk 1/10 · Minimal
- Est. fire insurance / yr
- $839 – $1,559
Heat risk 5/10 · Moderate
- Hot days now (above 105°F)
- 7 days/yr
- Hot days in 30 yrs
- 20 days/yr
Wind risk 2/10 · Minimal
- Chance of severe wind over 30 yrs
- 2.0%
Air-quality risk 3/10 · Minor
- Unhealthy air days now
- 3 days/yr
- Unhealthy air days in 30 yrs
- 5 days/yr
Risk factors via First Street. Map © Google.
Why this score? — see what drove the C- grade
The composite is a weighted blend of 9 inputs, each scored 0–100. Each bar is that input's sub-score; the figure is the points it added to the 100-point composite (weight × sub-score).
- Cash flow +20.9/30.0
- ARV discount +7.5/15.0
- DSCR +6.6/10.0
- 1% rule +5.1/10.0
- Rent growth +3.9/5.0
- Livability +3.2/5.0
- Condition / age +2.5/5.0
- Schools +2.3/10.0
- Appreciation +0.0/10.0
$500,000
🖨 Deal sheet 📄 Offer letter ✓ Due diligence
Multi-family units
County records classify this as Multi-Family (5+ Unit). Listing-text estimate: 3 units. estimate disagrees with records
5+ unit building — per-unit beds/baths from public records are typically unavailable; the breakdown below (if shown) is an estimate from the listing text.
Listing remarks
Investor opportunity in the heart of Cherokee Triangle! This classic triplex is back on the market—now offered at a lower price after the seller completed a brand-new slate roof. Full of character and potential, this property features three separate units plus a cellar, making it a strong value-add opportunity. The first-floor unit offers 1 bedroom and 1 full bath, the second-floor unit includes 2 bedrooms and 1 full bath, and the third-floor unit features 1 bedroom and 1 full bath. Beautiful original details can be found throughout, including hardwood floors, tall ceilings, and decorative fireplaces. Situated in one of Louisville's most desirable historic neighborhoods, this property
Key facts
- Brand new slate roof
- Basement
- Rear parking pad
Tags
Property features AI
Finance
- HOA & community: No association fee
Exterior
- Parking: 3 parking spaces
- Utilities: Natural gas and electric service; Separate meters for units
- Home design: Triplex; Traditional architectural style; Built in 1900
- Construction: Brick construction; Slate and rolled/hot mop roofing
- Exterior features: No notable exterior features listed; Sidewalk along the lot
Interior
- Kitchen: Kitchen on first, second, and third levels; Ranges and refrigerators included on each level; Dishwasher on first and second levels
- Bedrooms: 4 bedrooms total; Third level has 1 bedroom; Second level has 2 bedrooms; First level has 1 bedroom
- Bathrooms: Full bath on each of the first, second, and third levels
- Heating & cooling: Forced air and electric heating; natural gas fuel; Central air conditioning
- Interior features: Traditional style; Basement present
- Laundry & utility: Separate meters (multi-unit); 3 furnaces
Neighborhood map
What this means for you Summary
Snapshot
- This is a 3 × 4-bed/3.0-bath units multifamily listed at $500k.
Deal economics
- At list price, monthly cash flow is $691 ($8k/yr) — positive. Per door: $230/mo.
- The deal already cash-flows at list — no discount required.
- Meets the 1% rule at list price ($5k rent vs $500k).
- Recommended offer: $485k (3.0% below list) — sets the bar for market timing.
- Cap rate 8.0% vs local median 5.0% in Louisville — top-decile yield for the area; either an underpriced asset or a hidden risk that comps aren't pricing in. Stress-test before assuming the spread holds.
Location & tenants
- Location reads 63/100 on livability (#333 in KY) — a middle-class / working-renter tenant base. Strengths: cost of living A+, housing A+; Watch: employment C-, health & safety D+, schools D-.
- Jefferson County (urban): math 19% / reading 35% proficiency, ranked #121 of 165 in KY (top 73%) — low school quality limits family demand, transient renter base, plan for 1-2y turnover.
- Market conditions: Rents rising fast (+5.8%/yr); 99 active listings in the ZIP; 2,836 units permitted in Jefferson County in 2024 (1,558 in 5+ unit buildings).
- At $5,049/mo this rent would consume 85% of the median local household income ($71k/yr) (locally 761% of renters already pay >50% of income on rent) — very limited rent-growth headroom before tenants either downsize or default.
Forward outlook
- Local home prices are declining (-3.0%/yr); year-one equity from $3k of loan paydown is wiped out by about $15k of value loss. Plan a longer hold.
- Jefferson County population projected at +13% by 2050 — modest demand growth; plan on rents tracking national, not racing it.
Negotiation context
- It's been on market 52 days — a 3% lower offer ($485k) is reasonable based on typical stale-listing flexibility.
Risks & watch-outs
- Watch-outs: built in 1900 — expect roof / HVAC / electrical / plumbing capex.
- Climate carrying-cost: extreme-heat days projected 7→20/yr by 2055 (HVAC capex compounding) — expect insurance premiums to compound above CPI over the hold.
Questions for the listing agent
- It's been on market 52 days. Have you received any prior offers? Is the seller open to a 3% concession, seller financing, or rate buy-down credit?
- Can we see the unit-by-unit rent roll, current vacancy, and any below-market leases? What's the average tenancy length?
- What capital expenditures (roof, boiler, parking lot, exteriors) have been made in the last 5 years, and what's planned in the next 2?
- Built in 1900 — when were the roof, HVAC, electrical panel, plumbing, and water heater last replaced?
- Is there a deadline driving the sale (1031 exchange, divorce, estate, relocation)? That informs how much negotiation room exists.
- Schools are D-rated, which usually means shorter tenancies and higher turnover. Who's the typical renter profile here, and what's been the actual vacancy rate?
- Crime grade is F in this area — have there been break-ins, vandalism, or insurance claims at this property in the last 3 years? What carrier currently insures it and at what premium?
- What's the average days-on-market for RENTAL listings here right now (not sales)? A rising rental-DOM trend means longer vacancies and softer asking-rent achievability than the comps imply.
- What's the recent tenant-quality profile in this submarket — average credit score on applications, eviction rate, late-payment / NSF rate, and stable-employment percentage? A property-management company in the area should have these aggregated.
- How much new apartment / multifamily construction is in the pipeline within 1–3 miles? Heavy new supply (>2% of stock underway) typically softens rents 12–24 months out; light construction supports rent growth.
Investment metrics
- 1% rule
- 1.01% ✓
- Cap rate
- 7.95%
- Cash-on-cash
- 5.92%
- DSCR
- 1.26
- GRM
- 8.3
CMA / ARV
No comps found within radius.
Projected returns pro-forma
-3.0% appreciation · 5.76% rent growth · sell at horizon
- IRR
- -4.2%
- Equity multiple
- 0.84×
- Total profit
- $-22,620
- Equity at exit
- $74,552
- IRR
- 8.3%
- Equity multiple
- 1.71×
- Total profit
- $99,461
- Equity at exit
- $43,231
Cash invested: $140,000 (down + closing). Projections, not guarantees.
Landlord ↔ Tenant lean methodology
- Overall (STATE)
- 83 Strongly Landlord-Friendly
- State Kentucky
- 83 Strongly Landlord-Friendly · R+16
- County
- — inherits STATE
- City
- — inherits STATE
ZIP-level market 40204
- Rents YoY
- 5.8%
- Active inventory
- 99
- Price-to-rent
- 24.8×
Monthly cashflow live
- Estimated rent
- $5,049 medium interval (Pro) →
- Mortgage (P&I)
- −$2,622
- Tax from tax record
- −$467 /mo · $5,607/yr
- Insurance
- −$208
- HOA
- −$0
- Vacancy / Maint / Mgmt
- −$1,060
- Net cashflow
- $691
Break-even live
3-unit breakdown (identical units grouped — click to expand)
| Units | Beds | Baths | Est. rent |
|---|---|---|---|
| 3× units | 4 | 3 | $5,049 |
| #1 | 4 | 3 | $1,683 |
| #2 | 4 | 3 | $1,683 |
| #3 | 4 | 3 | $1,683 |
| Total (3 units) | $5,049 | ||
UW: 25.0% down · 7.5% · 30yr · 1.5% tax · 5.0% vac · 8.0% maint · 8.0% mgmt
Financing live
Cash to close
- Down payment
- $125,000
- Closing costs
- $15,000
- Reserves months
- —
- Total cash needed
- —
Loan-product check · same deal, 3 products live
Conventional
25% down · 7.5% · 30yr
- Down + closing
- —
- Monthly P&I
- —
- Monthly cashflow
- —
- DSCR
- —
- Eligible?
- —
Personal DTI + credit; lowest rate.
DSCR
20% down · 8.5% · 30yr
- Down + closing
- —
- Monthly P&I
- —
- Monthly cashflow
- —
- DSCR
- —
- Eligible?
- —
No personal income docs; deal must DSCR.
Hard money
10% down · 12.0% · 12mo
- Down + closing
- —
- Monthly P&I
- —
- Monthly cashflow
- —
- DSCR
- —
- Eligible?
- —
Short-term bridge; refi at stabilization.
Listing history 16 events
-
2026-06-18days on market $500,000 Active 52 DOM
-
2026-06-17days on market $500,000 Active 51 DOM
-
2026-06-16days on market $500,000 Active 50 DOM
-
2026-06-15days on market $500,000 Active 49 DOM
-
2026-06-13statusdays on market $500,000 Active 47 DOM
-
2026-06-10days on market $500,000 Active Under Contract 44 DOM
-
2026-06-09days on market $500,000 Active Under Contract 43 DOM
-
2026-06-08days on market $500,000 Active Under Contract 42 DOM
-
2026-06-07days on market $500,000 Active Under Contract 41 DOM
-
2026-06-03days on market $500,000 Active Under Contract 37 DOM
-
2026-06-02days on market $500,000 Active Under Contract 36 DOM
-
2026-06-01days on market $500,000 Active Under Contract 35 DOM
-
2026-05-31days on market $500,000 Active Under Contract 34 DOM
-
2026-05-21historical Active Under Contract
-
2026-04-27$500,000 Active
-
2025-05-21price $540,000
ⓘ Source: listings_history table (triggers on properties + properties_extension) + one-shot
backfill from property_details.listing_events for pre-trigger history.
Tax reassessment forecast KY · Resets to sale price
- Current annual tax
- $5,607 · $467/mo
- Projected year-2 tax
- $5,607 · $467/mo
- Expected delta
- $0/yr ($0/mo · 0.0%)
ⓘ Screening estimate from a state-policy table — verify with the county assessor before closing.
Climate risk First Street
- Flood 1/10 Low FEMA zone X (unshaded) · 0% chance over 30 yrs
- Wildfire 1/10 Low
- Heat 5/10 Major 7 d/yr ≥105°F today · 20 d/yr by 30 yrs out
- Wind 2/10 Low 2% chance of damaging wind over 30 yrs
- Air quality 3/10 Moderate 3 unhealthy d/yr today · 5 by 30 yrs out
Nearby sold comps map
Loading sold comps map…
Walkable amenities ~0.75 mi
Loading nearby amenities…
Taxation est. · year 1
- Rental income
- $60,588
- − Mortgage interest
- −$28,008
- − Property taxes
- −$5,607
- − Insurance
- −$2,500
- − Repairs & maintenance
- −$4,847
- − Management
- −$4,847
- − Depreciation
- −$14,545
- Taxable income
- $234
- Est. tax owed @ 24.0%
- −$56
- After-tax cash flow
- $8,237/yr
For passive investors: Depreciation is non-cash, so a rental often shows a tax loss while cash-flowing — sheltering income. Rental losses are passive: they offset passive income freely, and up to $25,000/yr can offset ordinary (W-2) income if you actively participate and your MAGI is under $100k (phasing out to $0 by $150k); unused losses carry forward. On sale, claimed depreciation is recaptured at up to 25%, and gains may owe capital-gains tax (a 1031 exchange can defer both). Figures are a year-1 estimate at your 24.0% rate — not tax advice; consult a CPA.
Schools (NCES district)
- District
- Jefferson County
- NCES district ID
- 2102990
- Math proficiency
- 19% ▼ -17.00%
- Reading proficiency
- 35% ▼ -11.00%
- Median HH income
- $47,885
- Composite
- 23.45/100
- National rank
- #7884
- State rank
- #121 of 165 in KY
Livability — Louisville
- Score
- 63/100
- State rank
- #333
- US rank
- #15887
Category grades
Schools grade is shown separately in the Schools card above.
Census & demographics
- Census place
- Louisville, KY
- County
- Jefferson County · 790,184 people
- City population
- 769,292
- Metro
- Louisville/Jefferson County, KY-IN
- Population (ZIP)
- 14,034
- Household income
- $71,116
- Rent vs Own
- Severe rent burden
- 761.0
Population outlook (Jefferson County) Hauer SSP2
- Today (2025)
- 823,112 people
- By 2030
- 849,343 · +3.2%
- By 2040
- 895,696 · +8.8%
- By 2050
- 933,630 · +13.4%
- By 2075
- 1,028,262 · +24.9%
- By 2100
- 1,072,675 · +30.3%
Race, ethnicity, and origin ACS 2023
- Neighborhood character
- Predominantly White (84%)
- Race & ethnicity
- White 84% Black 6% Two or more races 5% Hispanic / Latino 4% Asian 2%
- Common ancestry
- Slovak 3% Serbian 3% Romanian 3%
- Foreign-born
- 4% · Canada, South Korea, China
- Languages at home
- 95% English-only · Spanish 2% Korean 1% Chinese 1%
Political lean MEDSL · Jefferson
- 2024 margin
- D (+16.6) · D 57.4% · R 40.9% · Other 1.7%
- 2008→2024 swing
- +4.5pp toward D · 2008: 12.0pp · 2024: 16.6pp
- All cycles
- 2024: D+16.6 2020: D+20.1 2016: D+13.3 2012: D+11.1 2008: D+12.0
Not yet ingested
- Civics
- —
Market trends
- HPI YoY
- ▼ -475.25%
- Current HPI
- 246.3191
- Rent YoY
- ▲ 5.76%
- Metro
- Louisville/Jefferson County, KY-IN
- State GDP YoY
- ▲ 1.81%
- F500 in state
- 4
Industry mix (Fortune 500 HQ in KY)
| Industry | F500 HQs | Revenue |
|---|---|---|
| Healthcare | 1 | $118B |
|
||
| Food / Beverage | 1 | $7B |
|
||
Price history
-7.4% since first listed3 events — show timeline
- 2026-05-21 Contingent — Metro Search MLS
- 2026-04-27 Listed $500,000 Metro Search MLS
- 2025-05-21 Price Changed $540,000 Metro Search MLS
Property tax history
+3.8%/yrLatest (2025): $5,607 · -1.9% YoY. Source: county tax records.
Cash-flow waterfall
monthlySold comps — $/sqft
last 12 mo · ≤1 miLoading sold comps…