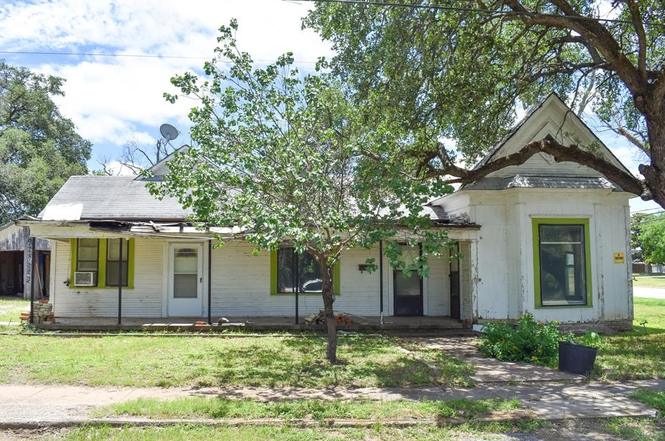
200 E 7th St · Brady, TX
Flood risk 1/10 · Minimal
- FEMA flood zone
- X
- Chance of flooding over 30 yrs
- 0.0%
- Est. flood insurance / yr
- $507 – $1,088
Fire risk 5/10 · Moderate
- Est. fire insurance / yr
- $1,222 – $2,270
Heat risk 6/10 · Moderate
- Hot days now (above 105°F)
- 6 days/yr
- Hot days in 30 yrs
- 20 days/yr
Wind risk 6/10 · Moderate
- Chance of severe wind over 30 yrs
- 27.0%
Air-quality risk 1/10 · Minimal
- Unhealthy air days now
- 0 days/yr
- Unhealthy air days in 30 yrs
- 0 days/yr
Risk factors via First Street. Map © Google.
Why this score? — see what drove the B+ grade
The composite is a weighted blend of 9 inputs, each scored 0–100. Each bar is that input's sub-score; the figure is the points it added to the 100-point composite (weight × sub-score).
- Cash flow +30.0/30.0
- 1% rule +10.0/10.0
- DSCR +10.0/10.0
- Appreciation +8.3/10.0
- ARV discount +7.5/15.0
- Schools +4.0/10.0
- Livability +3.6/5.0
- Rent growth +2.5/5.0
- Condition / age +2.5/5.0
$40,000
🖨 Deal sheet 📄 Offer letter ✓ Due diligence
Listing remarks MLS
Folks, if you are looking for a great place to call home, at a very reasonable price, here it is!!! This older 3bd 2bth, 1746sf (per CAD) frame home, is in good condition, but is in need of some of your TLC, to make it a great house to call yours! Home has been recently used as a duplex, so has 2 kitchens. One side can be used as a separate dining area. Home is spacious. Don't miss this neat home, in a quaint, older neighborhood!!
Key facts
- Original woodwork
- 0.23 acre lot
- Built 1940
Tags
Property features AI
Finance
- Other: Subdivision: LUHR; Directions: From the Brady Square, head south on Bridge St., turn left onto 7th St., the house is on your right.
- Financial info: Treat as clear loan type; No second mortgage
- HOA & community: No homeowners association
Exterior
- Parking: Driveway parking
- Utilities: City water; City sewer; Electricity available; Not in a municipal utility district
- Home design: Single-family residence; One story; Property attached
- Construction: Built in 1940; Wood construction; Shingle roof; Pillar/post/pier foundation
- Exterior features: Driveway; Lot under 0.5 acre (approximately 0.23 acre)
Interior
- Kitchen: No appliances included
- Bedrooms: Primary bedroom (15 x 15)
- Flooring: Wood flooring
- Bathrooms: 2 full bathrooms
- Interior features: High-speed internet available; Wood paneling
- Laundry & utility: No laundry appliances listed
Neighborhood map
What this means for you Summary
Snapshot
- This is a 3-bed/2.0-bath single-family listed at $40k.
Deal economics
- At list price, monthly cash flow is $587 ($7k/yr) — positive.
- The deal already cash-flows at list — no discount required.
- Meets the 1% rule at list price ($1k rent vs $40k).
- Cap rate 23.9% vs local median 3.5% in Brady — top-decile yield for the area; either an underpriced asset or a hidden risk that comps aren't pricing in. Stress-test before assuming the spread holds.
Location & tenants
- Location reads 72/100 on livability (#270 in TX) — a middle-class / working-renter tenant base. Strengths: cost of living A+, housing A+, health & safety A+; Watch: employment D, amenities F, commute F.
- Brady ISD (rural): math 50% / reading 46% proficiency, ranked #238 of 826 in TX (top 29%) — families likely to look elsewhere, expect single-tenant / working-renter base with shorter leases.
- Zoned schools: Brady El (math 33% / reading 34%, grade F, #2,174 of 4,322 statewide, top 51%, 476 students, 74% FRL) — zoned schools average 74% FRL vs 52% district-wide (22 pts higher); higher-poverty schools than district average — tighter screening recommended.
- Zoned-school proficiency averages 34% at this address vs 48% district-wide (-14 pts) — the specific schools serving this property underperform the Brady ISD average; the district grade overstates school quality for this exact location.
- Market conditions: 105 active listings in the ZIP; 2 units permitted in McCulloch County in 2024 (0 in 5+ unit buildings).
Forward outlook
- In year one you build about $3k of equity ($277 loan paydown + $3k appreciation (6.5% local appreciation)).
- At projected returns (6.5% appreciation + 3.0% rent growth), your $11k cash investment doubles in ~2 years — after that, you're playing with house money.
- By year 10, paydown + projected appreciation supports a ~$30k cash-out refi (75% LTV) — recoverable capital for the next deal without selling this one.
Negotiation context
- Only 3 days on market — expect competitive offers; lowballing is unlikely to land.
- 3 sale attempts since 3y ago with the ask held roughly flat each time — persistent listings suggest the price (not the market) is what's stuck; bring a comps-based counter.
Risks & watch-outs
- Watch-outs: property tax is 3.6% of price; built in 1940 — expect roof / HVAC / electrical / plumbing capex.
- Climate carrying-cost: major wind risk, 27% chance of damaging wind over 30y; moderate wildfire risk; extreme-heat days projected 6→20/yr by 2055 (HVAC capex compounding) — expect insurance premiums to compound above CPI over the hold.
Questions for the listing agent
- Built in 1940 — when were the roof, HVAC, electrical panel, plumbing, and water heater last replaced?
- Property tax is high relative to price — has the assessment been appealed recently, and will the sale trigger a re-assessment?
- Is there a deadline driving the sale (1031 exchange, divorce, estate, relocation)? That informs how much negotiation room exists.
- Schools are D-rated, which usually means shorter tenancies and higher turnover. Who's the typical renter profile here, and what's been the actual vacancy rate?
- What's the average days-on-market for RENTAL listings here right now (not sales)? A rising rental-DOM trend means longer vacancies and softer asking-rent achievability than the comps imply.
- What's the recent tenant-quality profile in this submarket — average credit score on applications, eviction rate, late-payment / NSF rate, and stable-employment percentage? A property-management company in the area should have these aggregated.
- How much new for-sale + rental construction is in the pipeline within 1–3 miles? Heavy new supply typically softens prices + rents 12–24 months out; constrained supply supports both.
Investment metrics
- 1% rule
- 2.95% ✓
- Cap rate
- 23.92%
- Cash-on-cash
- 62.94%
- DSCR
- 3.80
- GRM
- 2.8
CMA / ARV
- ARV (on-the-fly)
- $221,742
- Comps found
- 4
Show comp detail 4 sales within ~0.75 mi
| Address | Dist | Beds/Ba | Sqft | Sold | Price | $/sf | Match |
|---|---|---|---|---|---|---|---|
| 1404 S China | 0.59mi | 3/2.0 | 1,862 (+7%) | 2mo | $249,900 | $134 | 59 |
| 1508 S Wall | 0.70mi | 3/2.0 | 1,680 (-4%) | 15mo | $185,000 | $110 | 48 |
| 1509 S China St | 0.64mi | 3/2.0 | 1,802 (+3%) | 22mo | $229,000 | $127 | 46 |
| 1506 Wall | 0.69mi | 3/2.0 | 2,000 (+14%) | 9mo | $165,000 | $83 | 36 |
Match score weights: distance 35% · size 25% · config 20% · recency 20%. Top-matched comps best support the ARV.
Projected returns pro-forma
6.53% appreciation · 3.0% rent growth · sell at horizon
- IRR
- 71.3%
- Equity multiple
- 5.49×
- Total profit
- $50,289
- Equity at exit
- $26,492
- IRR
- 68.0%
- Equity multiple
- 11.58×
- Total profit
- $118,453
- Equity at exit
- $49,248
Cash invested: $11,200 (down + closing). Projections, not guarantees.
Landlord ↔ Tenant lean methodology
- Overall (STATE)
- 87 Strongly Landlord-Friendly
- State Texas
- 87 Strongly Landlord-Friendly · R+5
- County
- — inherits STATE
- City
- — inherits STATE
ZIP-level market 76825
- Home prices YoY
- 4.2%
- Active inventory
- 105
- Price-to-rent
- 2.8×
Monthly cashflow live
- Estimated rent
- $1,181 medium interval (Pro) →
- Mortgage (P&I)
- −$210
- Tax from tax record
- −$119 /mo · $1,433/yr
- Insurance
- −$17
- HOA
- −$0
- Vacancy / Maint / Mgmt
- −$248
- Net cashflow
- $587
Break-even live
UW: 25.0% down · 7.5% · 30yr · 1.5% tax · 5.0% vac · 8.0% maint · 8.0% mgmt
Financing live
Cash to close
- Down payment
- $10,000
- Closing costs
- $1,200
- Reserves months
- —
- Total cash needed
- —
Loan-product check · same deal, 3 products live
Conventional
25% down · 7.5% · 30yr
- Down + closing
- —
- Monthly P&I
- —
- Monthly cashflow
- —
- DSCR
- —
- Eligible?
- —
Personal DTI + credit; lowest rate.
DSCR
20% down · 8.5% · 30yr
- Down + closing
- —
- Monthly P&I
- —
- Monthly cashflow
- —
- DSCR
- —
- Eligible?
- —
No personal income docs; deal must DSCR.
Hard money
10% down · 12.0% · 12mo
- Down + closing
- —
- Monthly P&I
- —
- Monthly cashflow
- —
- DSCR
- —
- Eligible?
- —
Short-term bridge; refi at stabilization.
Listing history 4 events
-
2026-06-18days on market $40,000 Active 3 DOM
-
2026-06-17days on market $40,000 Active 2 DOM
-
2026-06-16remarks 641-char remark
-
2026-06-16$40,000 Active 1 DOM
ⓘ Source: listings_history table (triggers on properties + properties_extension) + one-shot
backfill from property_details.listing_events for pre-trigger history.
Tax reassessment forecast TX · Resets to sale price
- Current annual tax
- $1,433 · $119/mo
- Projected year-2 tax
- $1,433 · $119/mo
- Expected delta
- $0/yr ($0/mo · 0.0%)
ⓘ Screening estimate from a state-policy table — verify with the county assessor before closing.
Climate risk First Street
- Flood 1/10 Low FEMA zone X · 0% chance over 30 yrs
- Wildfire 5/10 Major
- Heat 6/10 Major 6 d/yr ≥105°F today · 20 d/yr by 30 yrs out
- Wind 6/10 Major 27% chance of damaging wind over 30 yrs
- Air quality 1/10 Low 0 unhealthy d/yr today · 0 by 30 yrs out
Nearby sold comps map
Loading sold comps map…
Walkable amenities ~0.75 mi
Loading nearby amenities…
Taxation est. · year 1
- Rental income
- $14,176
- − Mortgage interest
- −$2,241
- − Property taxes
- −$1,433
- − Insurance
- −$200
- − Repairs & maintenance
- −$1,134
- − Management
- −$1,134
- − Depreciation
- −$1,164
- Taxable income
- $6,871
- Est. tax owed @ 24.0%
- −$1,649
- After-tax cash flow
- $5,400/yr
For passive investors: Depreciation is non-cash, so a rental often shows a tax loss while cash-flowing — sheltering income. Rental losses are passive: they offset passive income freely, and up to $25,000/yr can offset ordinary (W-2) income if you actively participate and your MAGI is under $100k (phasing out to $0 by $150k); unused losses carry forward. On sale, claimed depreciation is recaptured at up to 25%, and gains may owe capital-gains tax (a 1031 exchange can defer both). Figures are a year-1 estimate at your 24.0% rate — not tax advice; consult a CPA.
Schools (NCES district)
- District
- Brady ISD
- NCES district ID
- 4811110
- Math proficiency
- 50% ▼ -2.00%
- Reading proficiency
- 46% ▲ 2.00%
- Median HH income
- $38,179
- Composite
- 40.02/100
- National rank
- #3826
- State rank
- #238 of 826 in TX
Livability — Brady
- Score
- 72/100
- State rank
- #270
- US rank
- #6336
Category grades
Schools grade is shown separately in the Schools card above.
Census & demographics
- Census place
- Brady, TX
- Population (ZIP)
- 6,595
Population outlook (McCulloch County) Hauer SSP2
- Today (2025)
- 8,509 people
- By 2030
- 8,544 · +0.4%
- By 2040
- 8,555 · +0.5%
- By 2050
- 8,486 · -0.3%
- By 2075
- 8,089 · -4.9%
- By 2100
- 6,599 · -22.4%
Race, ethnicity, and origin ACS 2023
- Neighborhood character
- Majority White (60%)
- Race & ethnicity
- White 60% Hispanic / Latino 33% Two or more races 21%
- Hispanic origin (detail)
- Mexican 30%
- Common ancestry
- Italian 8% Lithuanian 3% Portuguese 2%
- Foreign-born
- 6% · Canada, Vietnam
- Languages at home
- 72% English-only · Spanish 27%
Political lean MEDSL · McCulloch
- 2024 margin
- Solid R (+73.4) · D 12.9% · R 86.3%
- 2008→2024 swing
- -22.4pp toward R · 2008: -51.0pp · 2024: -73.4pp
- All cycles
- 2024: R+73.4 2020: R+70.3 2016: R+67.0 2012: R+62.9 2008: R+51.0
Not yet ingested
- Civics
- —
Market trends
- HPI YoY
- ▲ 6.53%
- Current HPI
- 161.5061
- Rent YoY
- —
- Metro
- —
- State GDP YoY
- ▲ 3.95%
- F500 in state
- 110
Industry mix (Fortune 500 HQ in TX)
| Industry | F500 HQs | Revenue |
|---|---|---|
| Energy | 16 | $1,198B |
|
||
| Technology | 5 | $198B |
|
||
| Engineering / Construction | 4 | $72B |
|
||
| Energy Services | 3 | $60B |
|
||
| Utilities | 3 | $41B |
|
||
| Healthcare | 2 | $330B |
|
||
Price history
-26.9% since first listed6 events — show timeline
- 2026-06-12 Listed $40,000 NTREIS
- 2023-09-25 Sold (MLS) — NTREIS
- 2023-08-24 Pending — NTREIS
- 2023-06-10 Relisted — NTREIS
- 2023-03-17 Pending — NTREIS
- 2023-02-09 Listed $54,750 NTREIS
Property tax history
+5.4%/yrLatest (2025): $1,433 · +13.2% YoY. Source: county tax records.
Cash-flow waterfall
monthlySold comps — $/sqft
last 12 mo · ≤1 miLoading sold comps…