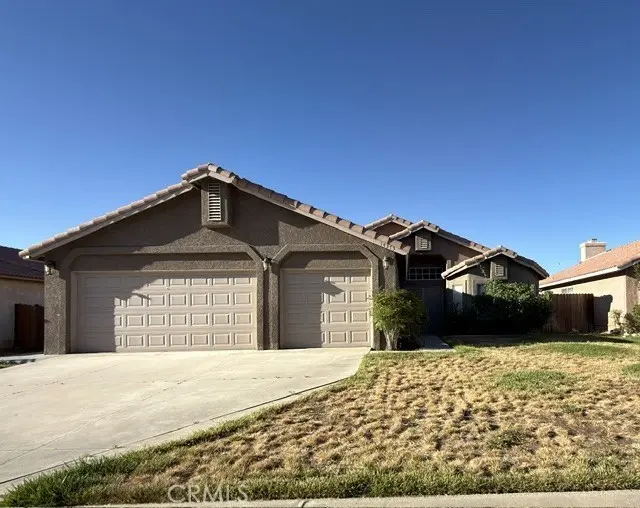
14373 Hillsborough · Victorville, CA
Flood risk 1/10 · Minimal
- FEMA flood zone
- X (unshaded)
- Chance of flooding over 30 yrs
- 0.0%
- Est. flood insurance / yr
- $507 – $1,088
Fire risk 5/10 · Moderate
- Est. fire insurance / yr
- $659 – $1,223
Heat risk 6/10 · Moderate
- Hot days now (above 98°F)
- 1 days/yr
- Hot days in 30 yrs
- 3 days/yr
Wind risk 1/10 · Minimal
- Chance of severe wind over 30 yrs
- —
Air-quality risk 9/10 · Severe
- Unhealthy air days now
- 22 days/yr
- Unhealthy air days in 30 yrs
- 28 days/yr
Risk factors via First Street. Map © Google.
Why this score? — see what drove the C grade
The composite is a weighted blend of 9 inputs, each scored 0–100. Each bar is that input's sub-score; the figure is the points it added to the 100-point composite (weight × sub-score).
- Cash flow +20.2/30.0
- ARV discount +15.0/15.0
- DSCR +6.4/10.0
- 1% rule +5.0/10.0
- Rent growth +2.9/5.0
- Livability +2.7/5.0
- Condition / age +2.5/5.0
- Schools +2.2/10.0
- Appreciation +0.0/10.0
$249,000
🖨 Deal sheet (PDF) 📄 Offer letter ✓ Due diligence
Listing remarks MLS
LIKE NEW! Stunning single story Victorville home with everything you've been looking for. .. large lot, 3 CAR GARAGE, tile roof, great front landscaping, NEW CARPET, TILE FLOORS, NEW PAINT, NEW BLINDS, NEW COUNTERTOPS, SOME NEW APPLIANCES. .. CUSTOM KITCHEN WITH UNDER CABINET LIGHTING, formal dining room, large living room with WARM BRICK FIREPLACE & separate laundry room. 3 Large bedrooms, 2 baths with custom mirrors and the master bedroom has an attached bonus room that could be great for office or nursery along with a huge walk-in closet. Standard seller so you can expect a quick response to your offer. Contact a Realtor for details. Association Amenities: None # of RV Spaces: 0 Special Features: CC, NONE Lot Location Type: Standard Location Special Features: Garage Door Opener # of Attached Spaces: 3 # of Detached Spaces: 0
Key facts
- Laundry room
- Close to shopping
- 7,800 sq ft lot
Tags
Property features AI
Exterior
- Parking: Attached garage with 3 parking spaces
- Utilities: Public/district water; Sewer: unknown (sewer or septic)
- Home design: Single-story; No common walls; No accessory dwelling unit
- Construction: Year built (per assessor); Living area and lot information sourced from assessor
- Exterior features: House structure; No pool; Lot sized in the 6,500–9,999 sq ft range; Sidewalks in the neighborhood
Interior
- Bedrooms: Three bedrooms on the main level
- Bathrooms: Two full bathrooms
- Interior features: One-level home; All bedrooms on the main level; Main level entry; Two bathrooms on the main level; Living room fireplace; Central furnace heating; Central cooling
- Laundry & utility: Laundry available (see remarks)
Neighborhood map
What this means for you Summary
Snapshot
- This is a 3-bed/2.0-bath single-family listed at $249k.
Deal economics
- At list price, monthly cash flow is $314 ($4k/yr) — positive.
- The deal already cash-flows at list — no discount required.
- To meet the 1% rule (rent ≥ 1% of price), the offer needs to be $248k (0.3% below list).
- Recommended offer: $248k (0.3% below list) — sets the bar for 1% rule.
- Cap rate 7.8% vs local median 4.2% in Victorville — top-decile yield for the area; either an underpriced asset or a hidden risk that comps aren't pricing in. Stress-test before assuming the spread holds.
Location & tenants
- Location reads 54/100 on livability (#906 in CA) — a working-class tenant base; expect higher turnover. Strengths: housing A+; Watch: employment D+, crime F, amenities F.
- Victor Elementary (urban): math 25% / reading 25% proficiency, ranked #408 of 517 in CA (top 79%) — low school quality limits family demand, transient renter base, plan for 1-2y turnover; 70% free/reduced lunch — lower-income household profile, screen leases tightly.
- Zoned schools: Liberty Elementary (980 students, 89% FRL); Imogene Garner Hook Junior High (1,000 students, 76% FRL); Silverado High (2,175 students, 59% FRL) — zoned schools at 75% FRL track the district average.
- Market conditions: Rents rising (+1.7%/yr); 374 active listings in the ZIP; 16 comparable units currently listed for rent nearby; rentals leasing fast (median 1d on market — plan ~1-2 weeks tenant-placement turnaround); solid renter incomes; 5,458 units permitted in San Bernardino County in 2024 (1,500 in 5+ unit buildings).
- This rent runs 34% of the median local income ($88k/yr) — at the standard rent-burdened threshold; future hikes will face affordability resistance.
Forward outlook
- Local home prices are declining (-3.0%/yr); year-one equity from $2k of loan paydown is wiped out by about $7k of value loss. Plan a longer hold.
- San Bernardino County population projected at +15% by 2050 — modest demand growth; plan on rents tracking national, not racing it.
Negotiation context
- Only 13 days on market — expect competitive offers; lowballing is unlikely to land.
- 4 sale attempts since 11y ago with the ask held roughly flat each time — persistent listings suggest the price (not the market) is what's stuck; bring a comps-based counter.
- Current owner paid $196k; 27% above their basis — modest negotiation headroom, anchor on the comps not their cost.
Risks & watch-outs
- Climate carrying-cost: moderate wildfire risk; extreme-heat days projected 1→3/yr by 2055 (HVAC capex compounding) — expect insurance premiums to compound above CPI over the hold.
Questions for the listing agent
- Is there a deadline driving the sale (1031 exchange, divorce, estate, relocation)? That informs how much negotiation room exists.
- Schools are D-rated, which usually means shorter tenancies and higher turnover. Who's the typical renter profile here, and what's been the actual vacancy rate?
- Crime grade is F in this area — have there been break-ins, vandalism, or insurance claims at this property in the last 3 years? What carrier currently insures it and at what premium?
- What's the average days-on-market for RENTAL listings here right now (not sales)? A rising rental-DOM trend means longer vacancies and softer asking-rent achievability than the comps imply.
- What's the recent tenant-quality profile in this submarket — average credit score on applications, eviction rate, late-payment / NSF rate, and stable-employment percentage? A property-management company in the area should have these aggregated.
- How much new for-sale + rental construction is in the pipeline within 1–3 miles? Heavy new supply typically softens prices + rents 12–24 months out; constrained supply supports both.
Investment metrics
- 1% rule
- 1.00% ✗
- Cap rate
- 7.81%
- Cash-on-cash
- 5.41%
- DSCR
- 1.24
- GRM
- 8.4
CMA / ARV
- ARV (on-the-fly)
- $419,016
- Comps found
- 12
Show comp detail 12 sales within ~0.75 mi
| Address | Dist | Beds/Ba | Sqft | Sold | Price | $/sf | Match |
|---|---|---|---|---|---|---|---|
| 14463 Hillsborough Dr | 0.12mi | 3/2.0 | 1,768 (0%) | 3mo | $420,000 | $238 | 92 |
| 14671 Ponderosa Ranch Rd | 0.40mi | 3/2.0 | 1,783 (+1%) | 4mo | $385,000 | $216 | 77 |
| 14392 Del Amo Dr | 0.20mi | 3/2.0 | 1,560 (-12%) | 2mo | $415,000 | $266 | 70 |
| 14133 Pacoima | 0.34mi | 3/2.0 | 1,860 (+5%) | 8mo | $375,250 | $202 | 69 |
| 14698 King Canyon Rd | 0.40mi | 4/2.0 (+1) | 1,697 (-4%) | 4mo | $400,000 | $236 | 66 |
| 14240 Piedmont | 0.19mi | 4/2.0 (+1) | 2,033 (+15%) | 3mo | $443,000 | $218 | 58 |
| 14583 Owens River Rd | 0.30mi | 4/2.0 (+1) | 1,968 (+11%) | 5mo | $420,000 | $213 | 58 |
| 14745 Manzano | 0.69mi | 3/2.0 | 1,660 (-6%) | 4mo | $420,000 | $253 | 54 |
| 12441 Petaluma | 0.35mi | 4/2.0 (+1) | 1,526 (-14%) | 3mo | $339,000 | $222 | 53 |
| 12960 El Rio Rd | 0.69mi | 4/2.0 (+1) | 1,669 (-6%) | 4mo | $410,777 | $246 | 50 |
| 12668 Galaxy St | 0.67mi | 4/2.0 (+1) | 1,560 (-12%) | 6mo | $424,000 | $272 | 39 |
| 14609 Olivera Rd | 0.70mi | 2/2.0 (-1) | 1,559 (-12%) | 5mo | $370,000 | $237 | 38 |
Match score weights: distance 35% · size 25% · config 20% · recency 20%. Top-matched comps best support the ARV.
Projected returns pro-forma
-3.0% appreciation · 1.69% rent growth · sell at horizon
- IRR
- -9.4%
- Equity multiple
- 0.66×
- Total profit
- $-23,569
- Equity at exit
- $37,127
- IRR
- -1.7%
- Equity multiple
- 0.89×
- Total profit
- $-7,690
- Equity at exit
- $21,529
Cash invested: $69,720 (down + closing). Projections, not guarantees.
Landlord ↔ Tenant lean methodology
- Overall (STATE)
- 18 Strongly Tenant-Friendly
- State California
- 18 Strongly Tenant-Friendly · D+13
- County
- — inherits STATE
- City
- — inherits STATE
ZIP-level market 92392
- Home prices YoY
- -9.0%
- Rents YoY
- 1.7%
- Active inventory
- 374
- Price-to-rent
- 8.4×
Monthly cashflow live
- Estimated rent
- $2,483 high interval (Pro) →
- Mortgage (P&I)
- −$1,306
- Tax from tax record
- −$238 /mo · $2,853/yr
- Insurance
- −$104
- HOA
- −$0
- Vacancy / Maint / Mgmt
- −$521
- Net cashflow
- $314
Break-even live
Sensitivity live
| Price | -10% $455 | -5% $385 | +0% $314 | +5% $244 | +10% $173 |
|---|---|---|---|---|---|
| Rent | -10% $118 | -5% $216 | +0% $314 | +5% $412 | +10% $510 |
| Rate | -1.0pp $440 | -0.5pp $378 | base $314 | +0.5pp $250 | +1.0pp $184 |
UW: 25.0% down · 7.5% · 30yr · 1.5% tax · 5.0% vac · 8.0% maint · 8.0% mgmt
Financing live
Cash to close
- Down payment
- $62,250
- Closing costs
- $7,470
- Reserves months
- —
- Total cash needed
- —
Loan-product check · same deal, 3 products live
Conventional
25% down · 7.5% · 30yr
- Down + closing
- —
- Monthly P&I
- —
- Monthly cashflow
- —
- DSCR
- —
- Eligible?
- —
Personal DTI + credit; lowest rate.
DSCR
20% down · 8.5% · 30yr
- Down + closing
- —
- Monthly P&I
- —
- Monthly cashflow
- —
- DSCR
- —
- Eligible?
- —
No personal income docs; deal must DSCR.
Hard money
10% down · 12.0% · 12mo
- Down + closing
- —
- Monthly P&I
- —
- Monthly cashflow
- —
- DSCR
- —
- Eligible?
- —
Short-term bridge; refi at stabilization.
Rent comps 16 comps
| Address | Beds | Baths | Sqft | Rent | $/sqft | DOM | Units | Dist |
|---|---|---|---|---|---|---|---|---|
| 12579 Santa Fe Trl Victorville, CA | 4.0 | 3.0 | 1766 | $2,395 | $1.36 | 0d | 1 | 0.25mi |
| 12579 Santa Fe Trl Victorville, CA | 4.0 | 3.0 | 1766 | $2,200 | $1.25 | 21d | 1 | 0.25mi |
| 14599 Santa Fe Trl Victorville, CA | 3.0 | 2.0 | 1521 | $2,250 | $1.48 | 0d | 1 | 0.31mi |
| 14172 Northstar Ave Victorville, CA | 4.0 | 2.0 | 1560 | $2,295 | $1.47 | 0d | 1 | 0.31mi |
| 12179 Galaxy St Victorville, CA | 3.0 | 2.0 | 1517 | $2,250 | $1.48 | 0d | 1 | 0.87mi |
| 13741 Starshine Dr Victorville, CA | 4.0 | 3.0 | 2114 | $2,799 | $1.32 | 0d | 1 | 0.93mi |
| 13602 Ironstone Ave Victorville, CA | 3.0 | 2.0 | 1584 | $950 | $0.60 | 0d | 1 | 0.94mi |
| 12735 Sundown Rd Victorville, CA | 3.0 | 2.0 | 1295 | $1,200 | $0.93 | 0d | 1 | 0.96mi |
| 12375 Sundown Rd Victorville, CA | 3.0 | 2.0 | 1295 | $2,300 | $1.78 | 12d | 1 | 0.96mi |
| 13560 Ironstone Cir Victorville, CA | 3.0 | 2.5 | 1760 | $2,497 | $1.42 | 0d | 1 | 1.03mi |
| 13629 Dry Creek Rd Victorville, CA | 3.0 | 2.0 | 1512 | $2,400 | $1.59 | 0d | 1 | 1.08mi |
| 13257 Blue Mesa Ct Victorville, CA | 3.0 | 2.0 | 1651 | $2,350 | $1.42 | 4d | 1 | 1.37mi |
| 13250 Sundance Cir Victorville, CA | 4.0 | 3.0 | 1687 | $2,850 | $1.69 | 0d | 1 | 1.43mi |
| 11515 Mariposa Rd Hesperia, CA | 4.0 | 3.0 | 2032 | $2,250 | $1.11 | 26d | 1 | 1.46mi |
| 12381 Kirkwood Dr Victorville, CA | 4.0 | 2.0 | 2095 | $3,000 | $1.43 | 0d | 1 | 1.48mi |
| 11577 Halter St Victorville, CA | 4.0 | 3.0 | 2534 | $3,000 | $1.18 | 1d | 1 | 1.48mi |
Listing history 9 events
-
2026-06-21days on market $249,000 Active 13 DOM
-
2026-06-18days on market $249,000 Active 10 DOM
-
2026-06-17days on market $249,000 Active 9 DOM
-
2026-06-16days on market $249,000 Active 8 DOM
-
2026-06-15days on market $249,000 Active 7 DOM
-
2026-06-13days on market $249,000 Active 5 DOM
-
2026-06-13days on market $249,000 Active 4 DOM
-
2026-06-08remarks 348-char remark
-
2026-06-08$249,000 Active 1 DOM
ⓘ Source: listings_history table (triggers on properties + properties_extension) + one-shot
backfill from property_details.listing_events for pre-trigger history.
Tax reassessment forecast CA · Resets to sale price
- Current annual tax
- $2,853 · $238/mo
- Projected year-2 tax
- $2,853 · $238/mo
- Expected delta
- $0/yr ($0/mo · 0.0%)
ⓘ Screening estimate from a state-policy table — verify with the county assessor before closing.
Climate risk First Street
- Flood 1/10 Low FEMA zone X (unshaded) · 0% chance over 30 yrs
- Wildfire 5/10 Major
- Heat 6/10 Major 1 d/yr ≥98°F today · 3 d/yr by 30 yrs out
- Wind 1/10 Low
- Air quality 9/10 Extreme 22 unhealthy d/yr today · 28 by 30 yrs out
Nearby sold comps map
Loading sold comps map…
Walkable amenities ~0.75 mi
Loading nearby amenities…
Taxation est. · year 1
- Rental income
- $29,797
- − Mortgage interest
- −$13,948
- − Property taxes
- −$2,853
- − Insurance
- −$1,245
- − Repairs & maintenance
- −$2,384
- − Management
- −$2,384
- − Depreciation
- −$7,244
- Taxable loss
- −$261
- Est. tax savings @ 24.0%
- +$63
- After-tax cash flow
- $3,834/yr
For passive investors: Depreciation is non-cash, so a rental often shows a tax loss while cash-flowing — sheltering income. Rental losses are passive: they offset passive income freely, and up to $25,000/yr can offset ordinary (W-2) income if you actively participate and your MAGI is under $100k (phasing out to $0 by $150k); unused losses carry forward. On sale, claimed depreciation is recaptured at up to 25%, and gains may owe capital-gains tax (a 1031 exchange can defer both). Figures are a year-1 estimate at your 24.0% rate — not tax advice; consult a CPA.
Schools (NCES district)
- District
- Victor Elementary
- NCES district ID
- 0641040
- Math proficiency
- 25% ▬ 0.00%
- Reading proficiency
- 25% ▼ -9.00%
- Median HH income
- $44,949
- Composite
- 21.58/100
- National rank
- #8304
- State rank
- #408 of 517 in CA
Livability — Victorville
- Score
- 54/100
- State rank
- #906
- US rank
- #24038
Category grades
Schools grade is shown separately in the Schools card above.
Census & demographics
- Census place
- Victorville, CA
- County
- San Bernardino County · 2,030,291 people
- City population
- 154,418
- Metro
- Riverside-San Bernardino-Ontario, CA
- Population (ZIP)
- 65,429
- Household income
- $87,681
- Rent vs Own
- Severe rent burden
- 1879.0
Population outlook (San Bernardino County) Hauer SSP2
- Today (2025)
- 2,300,329 people
- By 2030
- 2,378,907 · +3.4%
- By 2040
- 2,523,137 · +9.7%
- By 2050
- 2,642,388 · +14.9%
- By 2075
- 2,880,769 · +25.2%
- By 2100
- 2,909,436 · +26.5%
Race, ethnicity, and origin ACS 2023
- Neighborhood character
- Diverse neighborhood (Simpson 0.62)
- Race & ethnicity
- Hispanic / Latino 55% Two or more races 24% White 22% Black 14% Asian 4% Native American 2%
- Hispanic origin (detail)
- Mexican 47%
- Common ancestry
- Portuguese 1% Romanian 1%
- Foreign-born
- 20% · Canada, China, Vietnam
- Languages at home
- 57% English-only · Spanish 38% Tagalog/Filipino 2% Other Indo-European 1%
Political lean MEDSL · San Bernardino
- 2024 margin
- Toss-up / Even · D 47.5% · R 49.7% · Other 2.8%
- 2008→2024 swing
- -8.5pp toward R · 2008: 6.3pp · 2024: -2.1pp
- All cycles
- 2024: R+2.1 2020: D+10.7 2016: D+9.8 2012: D+5.4 2008: D+6.3
Not yet ingested
- Civics
- —
Market trends
- HPI YoY
- ▼ -35.57%
- Current HPI
- 358.5152
- Rent YoY
- ▲ 1.69%
- Metro
- Riverside-San Bernardino-Ontario, CA
- State GDP YoY
- ▲ 3.21%
- F500 in state
- 116
Industry mix (Fortune 500 HQ in CA)
| Industry | F500 HQs | Revenue |
|---|---|---|
| Technology | 27 | $1,492B |
|
||
| Financial Services | 3 | $174B |
|
||
| Retail | 3 | $44B |
|
||
| Insurance | 3 | $26B |
|
||
| Media / Entertainment | 2 | $115B |
|
||
| Pharmaceuticals / Biotech | 2 | $62B |
|
||
Price history
+99.2% since first listed10 events — show timeline
- 2026-06-08 Listed $249,000 CRMLS
- 2015-07-02 Sold (Public Records) $195,500 Public Records
- 2015-07-02 Sold (MLS) $195,500 CRMLS
- 2015-07-02 Sold (MLS) $195,500 CRMLS
- 2015-05-28 Pending — CRMLS
- 2015-04-15 Relisted — CRMLS
- 2015-03-31 Pending — CRMLS
- 2015-01-21 Listed $195,500 CRMLS
- 2015-01-20 Listed $195,500 CRMLS
- 1990-01-17 Sold (Public Records) $125,000 Public Records
Property tax history
+2.1%/yrLatest (2025): $2,853 · +6.9% YoY. Source: county tax records.
Cash-flow waterfall
monthlySold comps — $/sqft
last 12 mo · ≤1 miLoading sold comps…