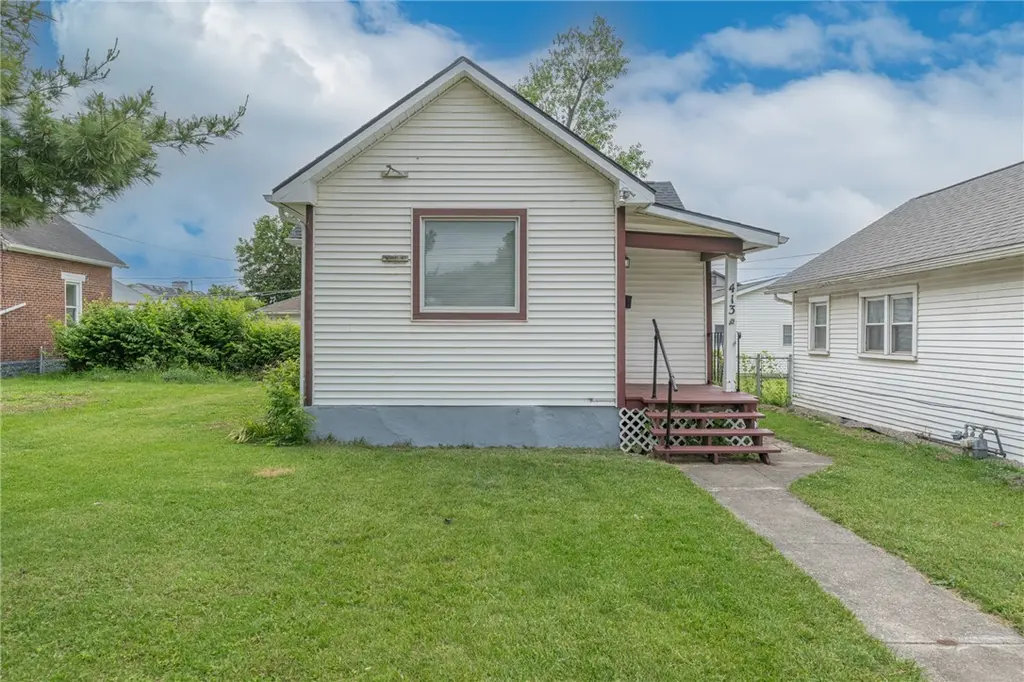
413 Brandt St · Dayton, OH
Flood risk 6/10 · Moderate
- FEMA flood zone
- X (unshaded)
- Chance of flooding over 30 yrs
- 0.65%
- Est. flood insurance / yr
- $473 – $860
Fire risk 1/10 · Minimal
- Est. fire insurance / yr
- $713 – $1,323
Heat risk 4/10 · Minor
- Hot days now (above 102°F)
- 7 days/yr
- Hot days in 30 yrs
- 18 days/yr
Wind risk 2/10 · Minimal
- Chance of severe wind over 30 yrs
- —
Air-quality risk 3/10 · Minor
- Unhealthy air days now
- 2 days/yr
- Unhealthy air days in 30 yrs
- 4 days/yr
Risk factors via First Street. Map © Google.
Why this score? — see what drove the B- grade
The composite is a weighted blend of 9 inputs, each scored 0–100. Each bar is that input's sub-score; the figure is the points it added to the 100-point composite (weight × sub-score).
- Cash flow +29.5/30.0
- ARV discount +13.0/15.0
- DSCR +10.0/10.0
- 1% rule +7.6/10.0
- Livability +3.2/5.0
- Rent growth +2.5/5.0
- Condition / age +2.5/5.0
- Schools +1.3/10.0
- Appreciation +0.0/10.0
$69,900
🖨 Deal sheet 📄 Offer letter ✓ Due diligence
Listing remarks
Motivated Seller! Discover the charm and comfort of this cozy bungalow located in the Old North Dayton neighborhood. This bungalow is conveniently located near Dayton Children's Hospital, Citgo and Cintas. This inviting home features one spacious bedroom, a full bath, a generously sized kitchen with a large pantry, plus a separate dining room and comfortable living area perfect for relaxing or entertaining. For going out, The Amber Rose restaurant, a Dayton treasure, and the 201Tavern are nearby. This home was part of an estate. Recent updates include a newer roof, updated electric panel, fresh paint, new carpet, and modern ceiling fans—making this home move-in ready with added peace
Key facts
- Separate dining room
- Newer roof
- Large pantry
Tags
Property features AI
Finance
- Financial info: Offered for sale
Exterior
- Parking: Detached two-car garage
- Utilities: Public water and sewer (assumed from residential zoning and typical service); Electric service
- Home design: Single-story home
- Construction: Aluminum siding; Vinyl siding; Home warranty included
- Exterior features: Residential lot (approximately 0.096 acres / 4,199 sq ft); Buses run nearby
Interior
- Kitchen: Range; Refrigerator
- Bathrooms: One full bathroom (on main level)
- Heating & cooling: Natural gas heating; Central air conditioning
- Interior features: Aluminum window frames; Double-pane windows; Laminate countertops; Partial basement
- Laundry & utility: Washer; Dryer
Neighborhood map
What this means for you Summary
Snapshot
- This is a 1-bed/1.0-bath single-family listed at $70k.
Deal economics
- At list price, monthly cash flow is $251 ($3k/yr) — positive.
- The deal already cash-flows at list — no discount required.
- Meets the 1% rule at list price ($882 rent vs $70k).
- Recommended offer: $68k (3.0% below list) — sets the bar for market timing.
- Cap rate 10.6% vs local median 7.4% in Dayton — top-decile yield for the area; either an underpriced asset or a hidden risk that comps aren't pricing in. Stress-test before assuming the spread holds.
Location & tenants
- Location reads 65/100 on livability (#716 in OH) — a middle-class / working-renter tenant base. Strengths: cost of living A+, housing A+, health & safety A; Watch: schools C-, amenities C-, crime F.
- Dayton City (urban): math 12% / reading 21% proficiency, ranked #641 of 656 in OH (top 98%) — low school quality limits family demand, transient renter base, plan for 1-2y turnover; 74% free/reduced lunch — lower-income household profile, screen leases tightly.
- Market conditions: 66 active listings in the ZIP; 17 comparable units currently listed for rent nearby; rentals at typical pace (median 24d on market — plan ~3-4 weeks tenant-placement turnaround); lower-income renter base — watch delinquency; 907 units permitted in Montgomery County in 2024 (416 in 5+ unit buildings).
Forward outlook
- Local home prices are declining (-3.0%/yr); year-one equity from $483 of loan paydown is wiped out by about $2k of value loss. Plan a longer hold.
- Montgomery County population projected at -10% by 2050 — secular population decline; favor cash flow + early exit over multi-decade hold.
- At projected returns (-3.0% appreciation + 3.0% rent growth), your $20k cash investment doubles in ~8 years — after that, you're playing with house money.
Negotiation context
- It's been on market 31 days — a 3% lower offer ($68k) is reasonable based on typical stale-listing flexibility.
- Current owner paid $35k; list at $70k implies a 100% gain — meaningful room to come down on a strong offer.
Risks & watch-outs
- Watch-outs: built in 1910 — expect roof / HVAC / electrical / plumbing capex.
- Climate carrying-cost: major flood risk — expect insurance premiums to compound above CPI over the hold.
Questions for the listing agent
- It's been on market 31 days. Have you received any prior offers? Is the seller open to a 3% concession, seller financing, or rate buy-down credit?
- Built in 1910 — when were the roof, HVAC, electrical panel, plumbing, and water heater last replaced?
- Is there a deadline driving the sale (1031 exchange, divorce, estate, relocation)? That informs how much negotiation room exists.
- Crime grade is F in this area — have there been break-ins, vandalism, or insurance claims at this property in the last 3 years? What carrier currently insures it and at what premium?
- What's the average days-on-market for RENTAL listings here right now (not sales)? A rising rental-DOM trend means longer vacancies and softer asking-rent achievability than the comps imply.
- What's the recent tenant-quality profile in this submarket — average credit score on applications, eviction rate, late-payment / NSF rate, and stable-employment percentage? A property-management company in the area should have these aggregated.
- How much new for-sale + rental construction is in the pipeline within 1–3 miles? Heavy new supply typically softens prices + rents 12–24 months out; constrained supply supports both.
Investment metrics
- 1% rule
- 1.26% ✓
- Cap rate
- 10.60%
- Cash-on-cash
- 15.40%
- DSCR
- 1.69
- GRM
- 6.6
CMA / ARV
- ARV (on-the-fly)
- $79,590
- Comps found
- 10
Show comp detail 10 sales within ~0.75 mi
| Address | Dist | Beds/Ba | Sqft | Sold | Price | $/sf | Match |
|---|---|---|---|---|---|---|---|
| 2056 Stegman Ave | 0.10mi | 2/1.0 (+1) | 728 (-4%) | 0mo | $117,000 | $161 | 83 |
| 1000 Dodgson Ct | 0.34mi | 2/1.0 (+1) | 749 (-1%) | 24mo | $64,900 | $87 | 58 |
| 22 Macready Ave | 0.43mi | 2/1.0 (+1) | 748 (-1%) | 21mo | $63,000 | $84 | 55 |
| 1266 Deeds Ave | 0.69mi | 2/1.0 (+1) | 763 (+1%) | 9mo | $80,000 | $105 | 54 |
| 2040 Bellefontaine Ave | 0.11mi | 2/1.0 (+1) | 672 (-11%) | 21mo | $15,500 | $23 | 53 |
| 1527 Leo St | 0.57mi | 2/1.0 (+1) | 728 (-4%) | 11mo | $42,000 | $58 | 52 |
| 2022 Bickmore Ave | 0.11mi | 2/1.0 (+1) | 858 (+13%) | 23mo | $115,000 | $134 | 49 |
| 18 Macready Ave | 0.44mi | 2/1.0 (+1) | 802 (+6%) | 21mo | $105,000 | $131 | 47 |
| 1626 Leo St | 0.52mi | 2/1.0 (+1) | 792 (+4%) | 22mo | $88,000 | $111 | 45 |
| 232 Notre Dame Ave | 0.51mi | 2/1.0 (+1) | 694 (-8%) | 22mo | $51,000 | $73 | 39 |
Match score weights: distance 35% · size 25% · config 20% · recency 20%. Top-matched comps best support the ARV.
Projected returns pro-forma
-3.0% appreciation · 3.0% rent growth · sell at horizon
- IRR
- 6.1%
- Equity multiple
- 1.24×
- Total profit
- $4,658
- Equity at exit
- $10,422
- IRR
- 15.5%
- Equity multiple
- 2.26×
- Total profit
- $24,613
- Equity at exit
- $6,044
Cash invested: $19,572 (down + closing). Projections, not guarantees.
Landlord ↔ Tenant lean methodology
- Overall (STATE)
- 73 Landlord-Friendly
- State Ohio
- 73 Landlord-Friendly · R+6
- County
- — inherits STATE
- City
- — inherits STATE
ZIP-level market 45404
- Home prices YoY
- -24.2%
- Active inventory
- 66
- Price-to-rent
- 6.6×
Monthly cashflow live
- Estimated rent
- $882 high interval (Pro) →
- Mortgage (P&I)
- −$367
- Tax from tax record
- −$50 /mo · $600/yr
- Insurance
- −$29
- HOA
- −$0
- Vacancy / Maint / Mgmt
- −$185
- Net cashflow
- $251
Break-even live
UW: 25.0% down · 7.5% · 30yr · 1.5% tax · 5.0% vac · 8.0% maint · 8.0% mgmt
Financing live
Cash to close
- Down payment
- $17,475
- Closing costs
- $2,097
- Reserves months
- —
- Total cash needed
- —
Loan-product check · same deal, 3 products live
Conventional
25% down · 7.5% · 30yr
- Down + closing
- —
- Monthly P&I
- —
- Monthly cashflow
- —
- DSCR
- —
- Eligible?
- —
Personal DTI + credit; lowest rate.
DSCR
20% down · 8.5% · 30yr
- Down + closing
- —
- Monthly P&I
- —
- Monthly cashflow
- —
- DSCR
- —
- Eligible?
- —
No personal income docs; deal must DSCR.
Hard money
10% down · 12.0% · 12mo
- Down + closing
- —
- Monthly P&I
- —
- Monthly cashflow
- —
- DSCR
- —
- Eligible?
- —
Short-term bridge; refi at stabilization.
Rent comps 17 comps
| Address | Beds | Baths | Sqft | Rent | $/sqft | DOM | Units | Dist |
|---|---|---|---|---|---|---|---|---|
| 2034 Leo St Dayton, OH | 2.0 | 1.0 | 888 | $1,100 | $1.24 | 21d | 1 | 0.19mi |
| 623 Hart St Dayton, OH | — | 1.0 | 528 | $699 | $1.32 | 44d | 1 | 0.73mi |
| 623 Troy St Unit D Dayton, OH | 1.0 | 1.0 | 550 | $725 | $1.32 | 3d | 1 | 0.77mi |
| 623 Troy St Unit A Dayton, OH | 1.0 | 1.0 | 550 | $695 | $1.26 | 44d | 1 | 0.77mi |
| 502 Hart St Unit 504 Dayton, OH | 1.0 | 1.0 | 900 | $700 | $0.78 | 44d | 1 | 0.79mi |
| 528 Troy St Unit B Dayton, OH | 1.0 | 1.0 | 850 | $750 | $0.88 | 23d | 1 | 0.79mi |
| 224 Deeds Ave Dayton, OH | 2.0 | 1.0 | 1124 | $950 | $0.85 | 23d | 1 | 1.00mi |
| 101 N Irwin St Dayton, OH | 2.0 | 1.0 | 900 | $1,100 | $1.22 | 3d | 1 | 1.19mi |
| 451 Hunter Ave Dayton, OH | 2.0 | 1.0 | 974 | $800 | $0.82 | 23d | 1 | 1.30mi |
| 809 Herman Ave Dayton, OH | 2.0 | 1.0 | 747 | $700 | $0.94 | 3d | 1 | 1.38mi |
| 11 S Sperling Ave Dayton, OH | 1.0 | 1.0 | 650 | $725 | $1.12 | 23d | 1 | 1.40mi |
| 120 S Monmouth St Dayton, OH | 2.0 | 1.0 | 1000 | $950 | $0.95 | 44d | 1 | 1.44mi |
| 211 N Cherrywood Ave Unit 2 Dayton, OH | 2.0 | 1.0 | 950 | $795 | $0.84 | 3d | 1 | 1.45mi |
| 334 Blackwood Ave Unit 3 Dayton, OH | 2.0 | 1.0 | 1000 | $850 | $0.85 | 3d | 1 | 1.46mi |
| 334 Blackwood Ave Unit 2 Dayton, OH | 2.0 | 1.0 | 1000 | $850 | $0.85 | 23d | 1 | 1.46mi |
| 423 Briarwood Ave #2 Dayton, OH | 1.0 | 1.0 | 650 | $700 | $1.08 | 44d | 1 | 1.48mi |
| 423 Briarwood Ave Apt 8 Dayton, OH | 1.0 | 1.0 | 650 | $700 | $1.08 | 3d | 1 | 1.48mi |
Listing history 19 events
-
2026-06-18days on market $69,900 Active 31 DOM
-
2026-06-17days on market $69,900 Active 30 DOM
-
2026-06-16days on market $69,900 Active 29 DOM
-
2026-06-15pricedays on market $69,900 Active 28 DOM
-
2026-06-14days on market $72,000 Active 26 DOM
-
2026-06-13days on market $72,000 Active 25 DOM
-
2026-06-10days on market $72,000 Active 23 DOM
-
2026-06-09days on market $72,000 Active 22 DOM
-
2026-06-08days on market $72,000 Active 21 DOM
-
2026-06-07pricedays on market $72,000 Active 20 DOM
-
2026-06-05days on market $74,900 Active 17 DOM
-
2026-06-03days on market $74,900 Active 16 DOM
-
2026-06-02days on market $74,900 Active 15 DOM
-
2026-06-01days on market $74,900 Active 14 DOM
-
2026-05-31days on market $74,900 Active 13 DOM
-
2026-05-18$74,900 Active
-
2005-08-03soldstatus $35,000
-
1985-05-20soldstatus $7,500
-
1983-11-14soldstatus $5,000
ⓘ Source: listings_history table (triggers on properties + properties_extension) + one-shot
backfill from property_details.listing_events for pre-trigger history.
Tax reassessment forecast OH · Partial reset (capped growth)
- Current annual tax
- $600 · $50/mo
- Projected year-2 tax
- $845 · $70/mo
- Expected delta
- +$245/yr (+$20/mo · 40.9%)
ⓘ Screening estimate from a state-policy table — verify with the county assessor before closing.
Climate risk First Street
- Flood 6/10 Major FEMA zone X (unshaded) · 65% chance over 30 yrs
- Wildfire 1/10 Low
- Heat 4/10 Moderate 7 d/yr ≥102°F today · 18 d/yr by 30 yrs out
- Wind 2/10 Low
- Air quality 3/10 Moderate 2 unhealthy d/yr today · 4 by 30 yrs out
Nearby sold comps map
Loading sold comps map…
Walkable amenities ~0.75 mi
Loading nearby amenities…
Taxation est. · year 1
- Rental income
- $10,585
- − Mortgage interest
- −$3,915
- − Property taxes
- −$600
- − Insurance
- −$350
- − Repairs & maintenance
- −$847
- − Management
- −$847
- − Depreciation
- −$2,033
- Taxable income
- $1,993
- Est. tax owed @ 24.0%
- −$478
- After-tax cash flow
- $2,535/yr
For passive investors: Depreciation is non-cash, so a rental often shows a tax loss while cash-flowing — sheltering income. Rental losses are passive: they offset passive income freely, and up to $25,000/yr can offset ordinary (W-2) income if you actively participate and your MAGI is under $100k (phasing out to $0 by $150k); unused losses carry forward. On sale, claimed depreciation is recaptured at up to 25%, and gains may owe capital-gains tax (a 1031 exchange can defer both). Figures are a year-1 estimate at your 24.0% rate — not tax advice; consult a CPA.
Schools (NCES district)
- District
- Dayton City
- NCES district ID
- 3904384
- Math proficiency
- 12% ▼ -12.00%
- Reading proficiency
- 21% ▼ -11.00%
- Median HH income
- $28,688
- Composite
- 12.94/100
- National rank
- #9579
- State rank
- #641 of 656 in OH
Livability — Dayton
- Score
- 65/100
- State rank
- #716
- US rank
- #12895
Category grades
Schools grade is shown separately in the Schools card above.
Census & demographics
- Census place
- Dayton, OH
- County
- Montgomery County · 459,541 people
- City population
- 164,387
- Metro
- Dayton-Kettering, OH
- Population (ZIP)
- 9,826
- Household income
- $38,874
- Rent vs Own
- Severe rent burden
- 702.0
Population outlook (Montgomery County) Hauer SSP2
- Today (2025)
- 523,241 people
- By 2030
- 514,948 · -1.6%
- By 2040
- 493,378 · -5.7%
- By 2050
- 469,639 · -10.2%
- By 2075
- 418,360 · -20.0%
- By 2100
- 353,315 · -32.5%
Race, ethnicity, and origin ACS 2023
- Neighborhood character
- Predominantly White (70%)
- Race & ethnicity
- White 70% Black 19% Two or more races 7% Hispanic / Latino 4% Asian 1%
- Common ancestry
- Iranian 3% Slovak 2% Serbian 1%
- Foreign-born
- 9% · Canada
- Languages at home
- 88% English-only · Spanish 4% Arabic 4% Other Asian/Pacific 3%
Political lean MEDSL · Montgomery
- 2024 margin
- Toss-up / Even · D 49.8% · R 49.3%
- 2008→2024 swing
- -5.8pp toward R · 2008: 6.2pp · 2024: 0.5pp
- All cycles
- 2024: D+0.5 2020: D+2.2 2016: R+1.2 2012: D+3.1 2008: D+6.2
Not yet ingested
- Civics
- —
Market trends
- HPI YoY
- ▼ -67.48%
- Current HPI
- 210.9571
- Rent YoY
- —
- Metro
- Dayton-Kettering, OH
- State GDP YoY
- ▲ 1.98%
- F500 in state
- 48
Industry mix (Fortune 500 HQ in OH)
| Industry | F500 HQs | Revenue |
|---|---|---|
| Insurance | 3 | $145B |
|
||
| Industrial Machinery | 3 | $49B |
|
||
| Financial Services | 3 | $24B |
|
||
| Consumer Goods | 2 | $93B |
|
||
| Aerospace / Defense | 2 | $47B |
|
||
| Utilities | 2 | $33B |
|
||
Price history
+1398.0% since first listed4 events — show timeline
- 2026-05-18 Listed $74,900 Dayton MLS
- 2005-08-03 Sold (Public Records) $35,000 Public Records
- 1985-05-20 Sold (Public Records) $7,500 Public Records
- 1983-11-14 Sold (Public Records) $5,000 Public Records
Property tax history
+0.9%/yrLatest (2025): $600 · -0.2% YoY. Source: county tax records.
Cash-flow waterfall
monthlySold comps — $/sqft
last 12 mo · ≤1 miLoading sold comps…