110 Hollow Point Ln · Cottageville, SC
Flood risk 1/10 · Minimal
- FEMA flood zone
- X (unshaded)
- Chance of flooding over 30 yrs
- 0.0%
- Est. flood insurance / yr
- $507 – $1,088
Fire risk 5/10 · Moderate
- Est. fire insurance / yr
- $783 – $1,453
Heat risk 8/10 · Major
- Hot days now (above 107°F)
- 7 days/yr
- Hot days in 30 yrs
- 18 days/yr
Wind risk 8/10 · Major
- Chance of severe wind over 30 yrs
- 90.0%
Air-quality risk 3/10 · Minor
- Unhealthy air days now
- 3 days/yr
- Unhealthy air days in 30 yrs
- 3 days/yr
Risk factors via First Street. Map © Google.
Why this score? — see what drove the B grade
The composite is a weighted blend of 9 inputs, each scored 0–100. Each bar is that input's sub-score; the figure is the points it added to the 100-point composite (weight × sub-score).
- Cash flow +30.0/30.0
- 1% rule +10.0/10.0
- DSCR +10.0/10.0
- ARV discount +7.5/15.0
- Appreciation +4.2/10.0
- Livability +3.2/5.0
- Rent growth +2.5/5.0
- Condition / age +2.5/5.0
- Schools +1.7/10.0
$50,000
🖨 Deal sheet (PDF) 📄 Offer letter ✓ Due diligence
Listing remarks
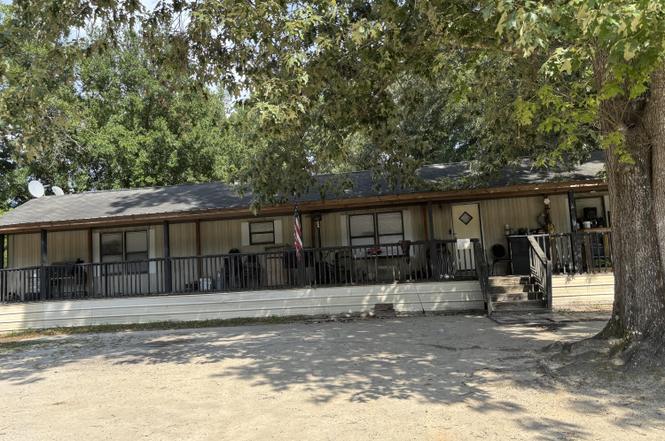
Owner occupied 1989 2 bdrm/2 bath manufactured home situated on . 6 acres with a large front porch.
Key facts
- 0.6 acre lot
- Built 1989
- Listed 3 days
Property features AI
Exterior
- Parking: Off-street parking
- Utilities: Septic tank
- Home design: Manufactured/mobile home (single wide); Ground-level entry; Fee simple ownership
- Construction: Vinyl skirting
- Exterior features: Metal roof; Level lot; Lot between 0.5 and 1 acre
Interior
- Kitchen: Eat-in kitchen
- Bedrooms: 2 bedrooms; Master bedroom with ceiling fan(s)
- Bathrooms: 2 bathrooms
- Heating & cooling: Natural gas heating; Window unit(s) for cooling
- Interior features: Eat-in kitchen; Family room
- Laundry & utility: Washer hookup; Dedicated laundry room
Neighborhood map
What this means for you Summary
Snapshot
- This is a 2-bed/1.0-bath manufactured listed at $50k.
Deal economics
- At list price, monthly cash flow is $354 ($4k/yr) — positive.
- The deal already cash-flows at list — no discount required.
- Meets the 1% rule at list price ($885 rent vs $50k).
Location & tenants
- Location reads 64/100 on livability (#156 in SC) — a middle-class / working-renter tenant base. Strengths: cost of living A+, housing A+, crime A; Watch: health & safety C-, employment D+, amenities F.
- Colleton 01 (rural): math 13% / reading 28% proficiency, ranked #69 of 80 in SC (top 86%) — low school quality limits family demand, transient renter base, plan for 1-2y turnover; 69% free/reduced lunch — lower-income household profile, screen leases tightly.
- Zoned schools: Cottageville Elementary (math 16% / reading 27%, grade F, #487 of 597 statewide, top 82%, 465 students, 100% FRL); Colleton County Middle (math 8% / reading 18%, grade F, #210 of 229 statewide, top 93%, 1,121 students, 100% FRL); Colleton County High (math 28% / reading 80%, grade C-, #137 of 196 statewide, top 70%, 1,497 students, 100% FRL) — zoned schools average 100% FRL vs 69% district-wide (31 pts higher); higher-poverty schools than district average — tighter screening recommended.
- Market conditions: 32 active listings in the ZIP; 50 units permitted in Colleton County in 2024 (0 in 5+ unit buildings).
Forward outlook
- Local home prices are declining (-1.6%/yr); year-one equity from $346 of loan paydown is wiped out by about $796 of value loss. Plan a longer hold.
- Colleton County population projected at -28% by 2050 — secular population decline; favor cash flow + early exit over multi-decade hold.
- At projected returns (-1.6% appreciation + 3.0% rent growth), your $14k cash investment doubles in ~4 years — after that, you're playing with house money.
Negotiation context
- Only 4 days on market — expect competitive offers; lowballing is unlikely to land.
Risks & watch-outs
- Climate carrying-cost: severe wind risk, 90% chance of damaging wind over 30y; moderate wildfire risk; extreme-heat days projected 7→18/yr by 2055 (HVAC capex compounding) — expect insurance premiums to compound above CPI over the hold.
Questions for the listing agent
- Is there a deadline driving the sale (1031 exchange, divorce, estate, relocation)? That informs how much negotiation room exists.
- Schools are F-rated, which usually means shorter tenancies and higher turnover. Who's the typical renter profile here, and what's been the actual vacancy rate?
- What's the average days-on-market for RENTAL listings here right now (not sales)? A rising rental-DOM trend means longer vacancies and softer asking-rent achievability than the comps imply.
- What's the recent tenant-quality profile in this submarket — average credit score on applications, eviction rate, late-payment / NSF rate, and stable-employment percentage? A property-management company in the area should have these aggregated.
- How much new for-sale + rental construction is in the pipeline within 1–3 miles? Heavy new supply typically softens prices + rents 12–24 months out; constrained supply supports both.
Investment metrics
- 1% rule
- 1.77% ✓
- Cap rate
- 14.78%
- Cash-on-cash
- 30.31%
- DSCR
- 2.35
- GRM
- 4.7
CMA / ARV
No comps found within radius.
Projected returns pro-forma
-1.59% appreciation · 3.0% rent growth · sell at horizon
- IRR
- 27.8%
- Equity multiple
- 2.25×
- Total profit
- $17,445
- Equity at exit
- $10,661
- IRR
- 33.5%
- Equity multiple
- 4.36×
- Total profit
- $46,988
- Equity at exit
- $10,034
Cash invested: $14,000 (down + closing). Projections, not guarantees.
Landlord ↔ Tenant lean methodology
- Overall (STATE)
- 90 Strongly Landlord-Friendly
- State South Carolina
- 90 Strongly Landlord-Friendly · R+6
- County
- — inherits STATE
- City
- — inherits STATE
ZIP-level market 29435
- Home prices YoY
- -0.6%
- Active inventory
- 32
- Price-to-rent
- 4.7×
Monthly cashflow live
- Estimated rent
- $885 medium interval (Pro) →
- Mortgage (P&I)
- −$262
- Tax est. 1.5%
- −$62 /mo · $750/yr
- Insurance
- −$21
- HOA
- −$0
- Vacancy / Maint / Mgmt
- −$186
- Net cashflow
- $354
Break-even live
Sensitivity live
| Price | -10% $388 | -5% $371 | +0% $354 | +5% $336 | +10% $319 |
|---|---|---|---|---|---|
| Rent | -10% $284 | -5% $319 | +0% $354 | +5% $389 | +10% $424 |
| Rate | -1.0pp $379 | -0.5pp $366 | base $354 | +0.5pp $341 | +1.0pp $327 |
UW: 25.0% down · 7.5% · 30yr · 1.5% tax · 5.0% vac · 8.0% maint · 8.0% mgmt
Financing live
Cash to close
- Down payment
- $12,500
- Closing costs
- $1,500
- Reserves months
- —
- Total cash needed
- —
Loan-product check · same deal, 3 products live
Conventional
25% down · 7.5% · 30yr
- Down + closing
- —
- Monthly P&I
- —
- Monthly cashflow
- —
- DSCR
- —
- Eligible?
- —
Personal DTI + credit; lowest rate.
DSCR
20% down · 8.5% · 30yr
- Down + closing
- —
- Monthly P&I
- —
- Monthly cashflow
- —
- DSCR
- —
- Eligible?
- —
No personal income docs; deal must DSCR.
Hard money
10% down · 12.0% · 12mo
- Down + closing
- —
- Monthly P&I
- —
- Monthly cashflow
- —
- DSCR
- —
- Eligible?
- —
Short-term bridge; refi at stabilization.
Listing history 4 events
-
2026-06-21days on market $50,000 Active 4 DOM
-
2026-06-21days on market $50,000 Active 3 DOM
-
2026-06-18remarks 99-char remark
-
2026-06-18$50,000 Active 1 DOM
ⓘ Source: listings_history table (triggers on properties + properties_extension) + one-shot
backfill from property_details.listing_events for pre-trigger history.
Climate risk First Street
- Flood 1/10 Low FEMA zone X (unshaded) · 0% chance over 30 yrs
- Wildfire 5/10 Major
- Heat 8/10 Severe 7 d/yr ≥107°F today · 18 d/yr by 30 yrs out
- Wind 8/10 Severe 90% chance of damaging wind over 30 yrs
- Air quality 3/10 Moderate 3 unhealthy d/yr today · 3 by 30 yrs out
Nearby sold comps map
Loading sold comps map…
Walkable amenities ~0.75 mi
Loading nearby amenities…
Taxation est. · year 1
- Rental income
- $10,620
- − Mortgage interest
- −$2,801
- − Property taxes
- −$750
- − Insurance
- −$250
- − Repairs & maintenance
- −$850
- − Management
- −$850
- − Depreciation
- −$1,455
- Taxable income
- $3,665
- Est. tax owed @ 24.0%
- −$880
- After-tax cash flow
- $3,363/yr
For passive investors: Depreciation is non-cash, so a rental often shows a tax loss while cash-flowing — sheltering income. Rental losses are passive: they offset passive income freely, and up to $25,000/yr can offset ordinary (W-2) income if you actively participate and your MAGI is under $100k (phasing out to $0 by $150k); unused losses carry forward. On sale, claimed depreciation is recaptured at up to 25%, and gains may owe capital-gains tax (a 1031 exchange can defer both). Figures are a year-1 estimate at your 24.0% rate — not tax advice; consult a CPA.
Schools (NCES district)
- District
- Colleton 01
- NCES district ID
- 4501830
- Math proficiency
- 13% ▼ -10.00%
- Reading proficiency
- 28% ▬ 0.00%
- Median HH income
- $33,128
- Composite
- 16.66/100
- National rank
- #9171
- State rank
- #69 of 80 in SC
Livability — Cottageville
- Score
- 64/100
- State rank
- #156
- US rank
- #14613
Category grades
Schools grade is shown separately in the Schools card above.
Census & demographics
- Population (ZIP)
- 4,579
Population outlook (Colleton County) Hauer SSP2
- Today (2025)
- 34,932 people
- By 2030
- 33,078 · -5.3%
- By 2040
- 29,017 · -16.9%
- By 2050
- 25,029 · -28.3%
- By 2075
- 16,894 · -51.6%
- By 2100
- 10,518 · -69.9%
Race, ethnicity, and origin ACS 2023
- Neighborhood character
- Predominantly White (65%)
- Race & ethnicity
- White 65% Black 17% Hispanic / Latino 11% Two or more races 8% Native American 2%
- Hispanic origin (detail)
- Mexican 11%
- Common ancestry
- Italian 4% Romanian 2% Lithuanian 1%
- Foreign-born
- 7% · Canada
- Languages at home
- 90% English-only · Spanish 10%
Political lean MEDSL · Colleton
- 2024 margin
- R (+18.2) · D 40.4% · R 58.5% · Other 1.1%
- 2008→2024 swing
- -18.7pp toward R · 2008: 0.5pp · 2024: -18.2pp
- All cycles
- 2024: R+18.2 2020: R+9.5 2016: R+8.5 2012: D+0.2 2008: D+0.5
Not yet ingested
- Civics
- —
Market trends
- HPI YoY
- ▼ -1.59%
- Current HPI
- 268.7276
- Rent YoY
- —
- Metro
- —
- State GDP YoY
- ▲ 4.51%
- F500 in state
- 2
Industry mix (Fortune 500 HQ in SC)
| Industry | F500 HQs | Revenue |
|---|---|---|
| Packaging | 1 | $7B |
|
||
Price history
1 event — show timeline
- 2026-06-17 Listed $50,000 Charleston Trident MLS
Property tax history
-16.5%/yrLatest (2025): $85 · +0.0% YoY. Source: county tax records.
Cash-flow waterfall
monthlySold comps — $/sqft
last 12 mo · ≤1 miLoading sold comps…