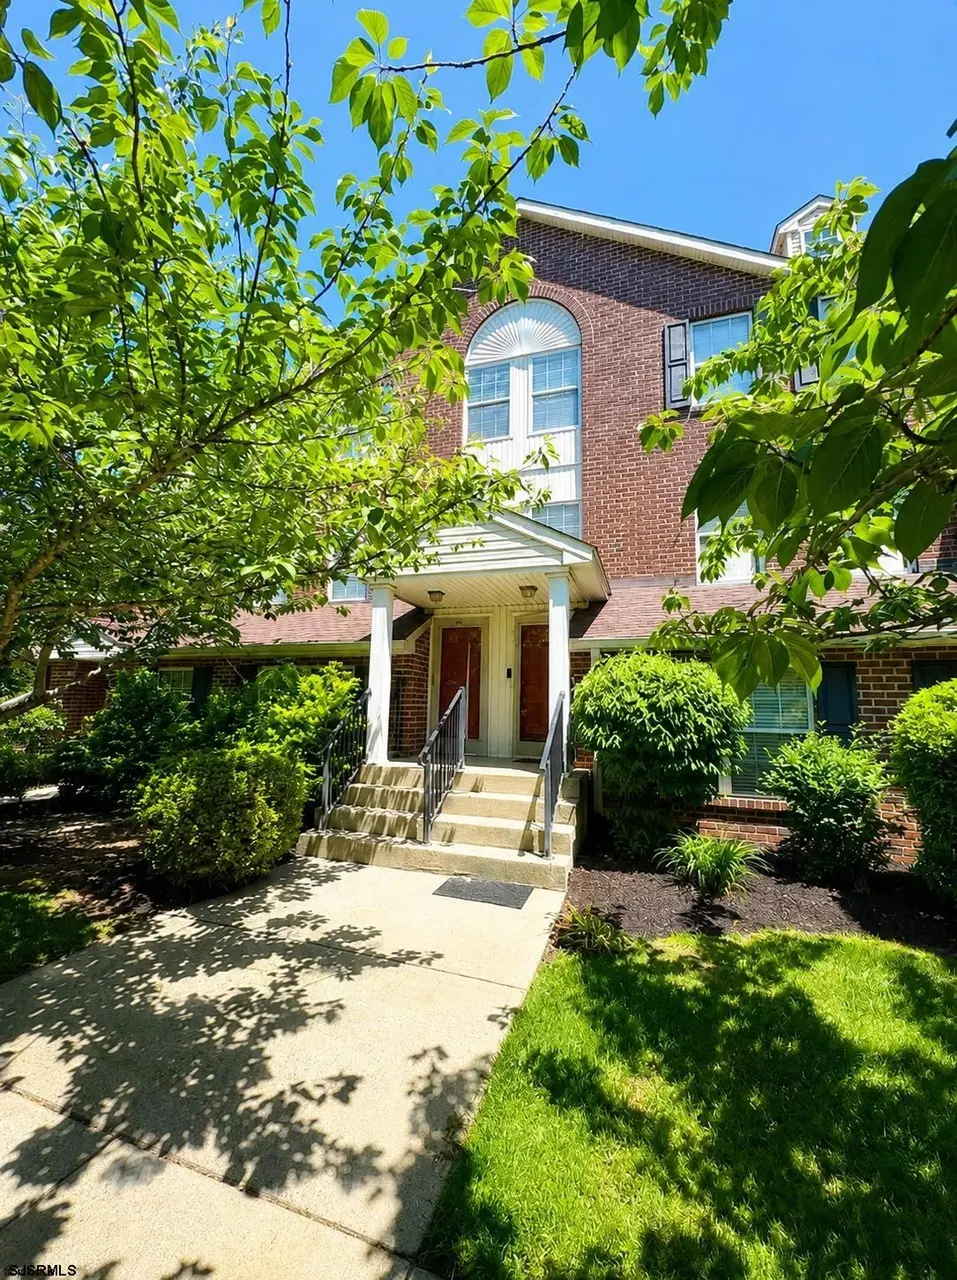
1536 Thomas Jefferson Ct #436 · Hamilton, NJ
Flood risk 1/10 · Minimal
- FEMA flood zone
- X (unshaded)
- Chance of flooding over 30 yrs
- 0.0%
- Est. flood insurance / yr
- $507 – $1,088
Fire risk 5/10 · Moderate
- Est. fire insurance / yr
- $526 – $976
Heat risk 7/10 · Major
- Hot days now (above 101°F)
- 7 days/yr
- Hot days in 30 yrs
- 15 days/yr
Wind risk 7/10 · Major
- Chance of severe wind over 30 yrs
- 79.0%
Air-quality risk 3/10 · Minor
- Unhealthy air days now
- 1 days/yr
- Unhealthy air days in 30 yrs
- 4 days/yr
Risk factors via First Street. Map © Google.
Why this score? — see what drove the D grade
The composite is a weighted blend of 9 inputs, each scored 0–100. Each bar is that input's sub-score; the figure is the points it added to the 100-point composite (weight × sub-score).
- Appreciation +10.0/10.0
- ARV discount +7.8/15.0
- Cash flow +7.6/30.0
- 1% rule +3.9/10.0
- Rent growth +2.5/5.0
- Livability +2.5/5.0
- Condition / age +2.5/5.0
- Schools +2.1/10.0
- DSCR +1.7/10.0
$283,000
🖨 Deal sheet (PDF) 📄 Offer letter ✓ Due diligence
Listing remarks
Beautifully renovated 3-bedroom, 2.5-bath Liberty Model townhouse offering the perfect blend of comfort, style, and convenience. Freshly painted and move-in-ready residence features brand-new flooring throughout, stainless steel appliances including a Samsung Hub refrigerator, and thoughtfully updated vanities and toilets in both the primary and powder bathrooms. The bright and inviting dining area opens to a private balcony, creating an ideal setting for morning coffee, outdoor dining, or entertaining guests. The main level also features a convenient laundry area and additional storage space tucked neatly beneath the staircase. Upstairs, the spacious primary suite offers a walk-in closet a
Key facts
- Extra storage
- New flooring
- Outdoor living
Tags
Property features AI
Finance
- HOA & community: Monthly association fee of $358; Association fee covers amenities, insurance, maintenance, management, sewer, trash, water, and pool; Association managed off-site by professionals; Community amenities include bus service, clubhouse/clubroom, outside shower, playground, and pool
Exterior
- Parking: Assigned exterior parking; No garage
- Utilities: Public water; Public sewer
- Home design: Condo unit in Mays Ldg Vill; 2-story unit; Building has 2 stories; Age: 25+ years
- Construction: Brick face siding/exterior
- Exterior features: Brick face exterior; No waterfront; Not in a floodplain
Interior
- Kitchen: Dishwasher; Gas stove; Microwave; Refrigerator; Disposal
- Bedrooms: Unit has 2 levels
- Bathrooms: 2 full bathrooms; 1 half bathroom
- Heating & cooling: Central air conditioning; Natural gas heating
- Interior features: Disposal; Dishwasher; Gas stove; Microwave; Refrigerator; Dining area
- Laundry & utility: Washer; Dryer
Neighborhood map
What this means for you Summary
Snapshot
- This is a 3-bed/2.5-bath townhouse listed at $283k.
Deal economics
- At list price, monthly cash flow is $-342 ($-4k/yr) — negative.
- To cash-flow at today's rent, offer at most $223k (21.3% below list).
- To meet the 1% rule (rent ≥ 1% of price), the offer needs to be $252k (11.1% below list).
- Recommended offer: $223k (21.3% below list) — sets the bar for cash-flow.
Location & tenants
- Location reads: area grade D — affects rentability + tenant quality, not the cash-flow math above.
- Hamilton Township School District (suburban): math 9% / reading 37% proficiency, ranked #401 of 472 in NJ (top 85%) — low school quality limits family demand, transient renter base, plan for 1-2y turnover.
- Zoned schools: George L. Hess Educational Complex (math 8% / reading 32%, grade F, #990 of 1,303 statewide, top 76%, 1,363 students, 53% FRL); William Davies Middle School (math 10% / reading 41%, grade F, #359 of 431 statewide, top 84%, 930 students, 51% FRL); Oakcrest High School (math 9% / reading 36%, grade F, #342 of 399 statewide, top 86%, 914 students, 61% FRL) — zoned schools average 55% FRL vs 37% district-wide (18 pts higher); higher-poverty schools than district average — tighter screening recommended.
- Market conditions: 244 active listings in the ZIP; 1 comparable units currently listed for rent nearby; solid renter incomes; 672 units permitted in Atlantic County in 2024 (258 in 5+ unit buildings).
- This rent runs 39% of the median local income ($77k/yr) — at the standard rent-burdened threshold; future hikes will face affordability resistance.
Forward outlook
- In year one you build about $30k of equity ($2k loan paydown + $28k appreciation (10.0% local appreciation)).
- Atlantic County population projected at -12% by 2050 — secular population decline; favor cash flow + early exit over multi-decade hold.
- By year 2, paydown + projected appreciation supports a ~$49k cash-out refi (75% LTV) — recoverable capital for the next deal without selling this one.
Negotiation context
- It's been on market 32 days — a 3% lower offer ($275k) is reasonable based on typical stale-listing flexibility.
- Current owner paid $108k; list at $283k implies a 162% gain — meaningful room to come down on a strong offer.
Risks & watch-outs
- Climate carrying-cost: major wind risk, 79% chance of damaging wind over 30y; moderate wildfire risk; extreme-heat days projected 7→15/yr by 2055 (HVAC capex compounding) — expect insurance premiums to compound above CPI over the hold.
Questions for the listing agent
- What do current leases actually rent for vs. the listed asking? Can we see a recent rent roll and the last 12 months of T-12 income?
- It's been on market 32 days. Have you received any prior offers? Is the seller open to a 21% concession, seller financing, or rate buy-down credit?
- What does the HOA fee cover, when was the last increase, and are there any pending special assessments or reserve-fund shortfalls?
- Is there a deadline driving the sale (1031 exchange, divorce, estate, relocation)? That informs how much negotiation room exists.
- The area grade is low — what's the realistic commute time and amenity access for the typical tenant pool here? Any planned neighborhood developments (good or bad) we should know about?
- What's the average days-on-market for RENTAL listings here right now (not sales)? A rising rental-DOM trend means longer vacancies and softer asking-rent achievability than the comps imply.
- What's the recent tenant-quality profile in this submarket — average credit score on applications, eviction rate, late-payment / NSF rate, and stable-employment percentage? A property-management company in the area should have these aggregated.
- How much new for-sale + rental construction is in the pipeline within 1–3 miles? Heavy new supply typically softens prices + rents 12–24 months out; constrained supply supports both.
Investment metrics
- 1% rule
- 0.89% ✗
- Cap rate
- 4.84%
- Cash-on-cash
- -5.17%
- DSCR
- 0.77
- GRM
- 9.4
CMA / ARV
- ARV (on-the-fly)
- $285,192
- Comps found
- 12
Show comp detail 12 sales within ~0.75 mi
| Address | Dist | Beds/Ba | Sqft | Sold | Price | $/sf | Match |
|---|---|---|---|---|---|---|---|
| 1544 Benjamin Franklin Ct | 0.06mi | 3/2.5 | 1,398 (0%) | 0mo | $289,000 | $207 | 97 |
| 1515 Benjamin Franklin Ct #515 | 0.09mi | 3/2.5 | 1,398 (0%) | 2mo | $290,000 | $207 | 94 |
| 1574 John Adams Ct #1574 | 0.10mi | 3/2.5 | 1,398 (0%) | 6mo | $285,000 | $204 | 90 |
| 1553 John Adams Ct #653 | 0.12mi | 3/2.5 | 1,398 (0%) | 7mo | $237,500 | $170 | 89 |
| 1551 John Adams Ct | 0.12mi | 3/2.5 | 1,494 (+7%) | 0mo | $285,000 | $191 | 83 |
| 1536 Madison Ct | 0.03mi | 3/2.5 | 1,456 (+4%) | 13mo | $305,000 | $209 | 81 |
| 1556 Benjamin Franklin Ct | 0.05mi | 3/2.5 | 1,494 (+7%) | 9mo | $295,000 | $197 | 79 |
| 1556 Benjamin Franklin Ct #1556 | 0.05mi | 3/2.5 | 1,494 (+7%) | 9mo | $295,000 | $197 | 79 |
| 1516 Thomas Jefferson Ct #1516 | 0.03mi | 3/2.5 | 1,500 (+7%) | 11mo | $305,900 | $204 | 78 |
| 1537 Benjamin Franklin Ct | 0.08mi | 3/2.5 | 1,494 (+7%) | 11mo | $300,000 | $201 | 76 |
| 1553 Madison Ct | 0.04mi | 2/2.5 (-1) | 1,216 (-13%) | 6mo | $259,900 | $214 | 66 |
| 75 Sorrentino Way | 0.64mi | 2/2.0 (-1) | 1,486 (+6%) | 15mo | $290,000 | $195 | 40 |
Match score weights: distance 35% · size 25% · config 20% · recency 20%. Top-matched comps best support the ARV.
Projected returns pro-forma
10.0% appreciation · 3.0% rent growth · sell at horizon
- IRR
- 20.6%
- Equity multiple
- 2.67×
- Total profit
- $132,639
- Equity at exit
- $254,949
- IRR
- 18.8%
- Equity multiple
- 6.15×
- Total profit
- $408,242
- Equity at exit
- $549,807
Cash invested: $79,240 (down + closing). Projections, not guarantees.
Landlord ↔ Tenant lean methodology
- Overall (STATE)
- 21 Tenant-Leaning
- State New Jersey
- 21 Tenant-Leaning · D+6
- County
- — inherits STATE
- City
- — inherits STATE
ZIP-level market 08330
- Home prices YoY
- 3.9%
- Active inventory
- 244
- Price-to-rent
- 9.4×
Monthly cashflow live
- Estimated rent
- $2,516 medium interval (Pro) →
- Mortgage (P&I)
- −$1,484
- Tax from tax record
- −$369 /mo · $4,428/yr
- Insurance
- −$118
- HOA
- −$358
- Vacancy / Maint / Mgmt
- −$528
- Net cashflow
- $-342
Break-even live
Sensitivity live
| Price | -10% $-181 | -5% $-262 | +0% $-342 | +5% $-422 | +10% $-502 |
|---|---|---|---|---|---|
| Rent | -10% $-540 | -5% $-441 | +0% $-342 | +5% $-242 | +10% $-143 |
| Rate | -1.0pp $-199 | -0.5pp $-270 | base $-342 | +0.5pp $-415 | +1.0pp $-490 |
UW: 25.0% down · 7.5% · 30yr · 1.5% tax · 5.0% vac · 8.0% maint · 8.0% mgmt
Financing live
Cash to close
- Down payment
- $70,750
- Closing costs
- $8,490
- Reserves months
- —
- Total cash needed
- —
Loan-product check · same deal, 3 products live
Conventional
25% down · 7.5% · 30yr
- Down + closing
- —
- Monthly P&I
- —
- Monthly cashflow
- —
- DSCR
- —
- Eligible?
- —
Personal DTI + credit; lowest rate.
DSCR
20% down · 8.5% · 30yr
- Down + closing
- —
- Monthly P&I
- —
- Monthly cashflow
- —
- DSCR
- —
- Eligible?
- —
No personal income docs; deal must DSCR.
Hard money
10% down · 12.0% · 12mo
- Down + closing
- —
- Monthly P&I
- —
- Monthly cashflow
- —
- DSCR
- —
- Eligible?
- —
Short-term bridge; refi at stabilization.
Rent comps 1 comps
| Address | Beds | Baths | Sqft | Rent | $/sqft | DOM | Units | Dist |
|---|---|---|---|---|---|---|---|---|
| 1932 Cologne Ave Mays Landing, NJ | 1.0–2.0 | 1.0–2.0 | 775 | $1,825 | $2.35 | 15d | 1 | 0.98mi |
HOA detail
- Monthly dues
- $358 · $4,296/yr
Listing history 19 events
-
2026-06-21days on market $283,000 Active 32 DOM
-
2026-06-19days on market $283,000 Active 30 DOM
-
2026-06-18days on market $283,000 Active 29 DOM
-
2026-06-17days on market $283,000 Active 28 DOM
-
2026-06-16days on market $283,000 Active 27 DOM
-
2026-06-15days on market $283,000 Active 26 DOM
-
2026-06-14days on market $283,000 Active 24 DOM
-
2026-06-13days on market $283,000 Active 23 DOM
-
2026-06-10days on market $283,000 Active 21 DOM
-
2026-06-09days on market $283,000 Active 20 DOM
-
2026-06-08days on market $283,000 Active 19 DOM
-
2026-06-07days on market $283,000 Active 18 DOM
-
2026-06-03days on market $283,000 Active 14 DOM
-
2026-06-02days on market $283,000 Active 13 DOM
-
2026-06-01days on market $283,000 Active 12 DOM
-
2026-05-31days on market $283,000 Active 11 DOM
-
2026-05-30days on market $283,000 Active 10 DOM
-
2026-05-19$283,000 Active
-
2017-06-29soldstatus $108,000
ⓘ Source: listings_history table (triggers on properties + properties_extension) + one-shot
backfill from property_details.listing_events for pre-trigger history.
Tax reassessment forecast NJ · Partial reset (capped growth)
- Current annual tax
- $4,428 · $369/mo
- Projected year-2 tax
- $5,737 · $478/mo
- Expected delta
- +$1,309/yr (+$109/mo · 29.6%)
ⓘ Screening estimate from a state-policy table — verify with the county assessor before closing.
Climate risk First Street
- Flood 1/10 Low FEMA zone X (unshaded) · 0% chance over 30 yrs
- Wildfire 5/10 Major
- Heat 7/10 Severe 7 d/yr ≥101°F today · 15 d/yr by 30 yrs out
- Wind 7/10 Severe 79% chance of damaging wind over 30 yrs
- Air quality 3/10 Moderate 1 unhealthy d/yr today · 4 by 30 yrs out
Nearby sold comps map
Loading sold comps map…
Walkable amenities ~0.75 mi
Loading nearby amenities…
Taxation est. · year 1
- Rental income
- $30,188
- − Mortgage interest
- −$15,852
- − Property taxes
- −$4,428
- − Insurance
- −$1,415
- − Repairs & maintenance
- −$2,415
- − Management
- −$2,415
- − HOA
- −$4,296
- − Depreciation
- −$8,233
- Taxable loss
- −$8,866
- Est. tax savings @ 24.0%
- +$2,128
- After-tax cash flow
- $-1,971/yr
For passive investors: Depreciation is non-cash, so a rental often shows a tax loss while cash-flowing — sheltering income. Rental losses are passive: they offset passive income freely, and up to $25,000/yr can offset ordinary (W-2) income if you actively participate and your MAGI is under $100k (phasing out to $0 by $150k); unused losses carry forward. On sale, claimed depreciation is recaptured at up to 25%, and gains may owe capital-gains tax (a 1031 exchange can defer both). Figures are a year-1 estimate at your 24.0% rate — not tax advice; consult a CPA.
Schools (NCES district)
- District
- Hamilton Township School District
- NCES district ID
- 3406510
- Math proficiency
- 9% ▼ -20.00%
- Reading proficiency
- 37% ▼ -9.00%
- Median HH income
- $60,997
- Composite
- 21.34/100
- National rank
- #8372
- State rank
- #401 of 472 in NJ
Livability — Hamilton
No livability data for this city. (Only ~50 U.S. cities are tracked.)
Census & demographics
- Census place
- Mays Landing, NJ
- County
- Atlantic County · 143,611 people
- Metro
- Atlantic City-Hammonton, NJ
- Population (ZIP)
- 29,972
- Household income
- $77,167
- Rent vs Own
- Severe rent burden
- 1003.0
Population outlook (Atlantic County) Hauer SSP2
- Today (2025)
- 268,948 people
- By 2030
- 264,497 · -1.7%
- By 2040
- 252,261 · -6.2%
- By 2050
- 237,846 · -11.6%
- By 2075
- 210,650 · -21.7%
- By 2100
- 180,234 · -33.0%
Race, ethnicity, and origin ACS 2023
- Neighborhood character
- Diverse neighborhood (Simpson 0.62)
- Race & ethnicity
- White 58% Hispanic / Latino 16% Black 14% Two or more races 13% Asian 4%
- Hispanic origin (detail)
- Puerto Rican 7% Dominican 4%
- Common ancestry
- Romanian 3% Italian 2% Lithuanian 1%
- Foreign-born
- 9% · Canada, Vietnam, Guatemala
- Languages at home
- 84% English-only · Spanish 10% Tagalog/Filipino 1% Other Indo-European 1%
Political lean MEDSL · Atlantic
- 2024 margin
- Toss-up / Even · D 47.7% · R 50.7% · Other 1.6%
- 2008→2024 swing
- -18.1pp toward R · 2008: 15.1pp · 2024: -3.0pp
- All cycles
- 2024: R+3.0 2020: D+6.7 2016: D+6.2 2012: D+17.2 2008: D+15.1
Not yet ingested
- Civics
- —
Market trends
- HPI YoY
- ▲ 11.58%
- Current HPI
- 308.5148
- Rent YoY
- —
- Metro
- Atlantic City-Hammonton, NJ
- State GDP YoY
- ▲ 2.05%
- F500 in state
- 34
Industry mix (Fortune 500 HQ in NJ)
| Industry | F500 HQs | Revenue |
|---|---|---|
| Consumer Goods | 3 | $31B |
|
||
| Pharmaceuticals | 2 | $153B |
|
||
| Technology | 2 | $21B |
|
||
| Insurance | 2 | $20B |
|
||
| Healthcare | 2 | $19B |
|
||
| Financial Services | 1 | $70B |
|
||
Price history
+162.0% since first listed2 events — show timeline
- 2026-05-19 Listed $283,000 SJSRMLS
- 2017-06-29 Sold (Public Records) $108,000 Public Records
Property tax history
+1.2%/yrLatest (2025): $4,428 · +2.6% YoY. Source: county tax records.
Cash-flow waterfall
monthlySold comps — $/sqft
last 12 mo · ≤1 miLoading sold comps…