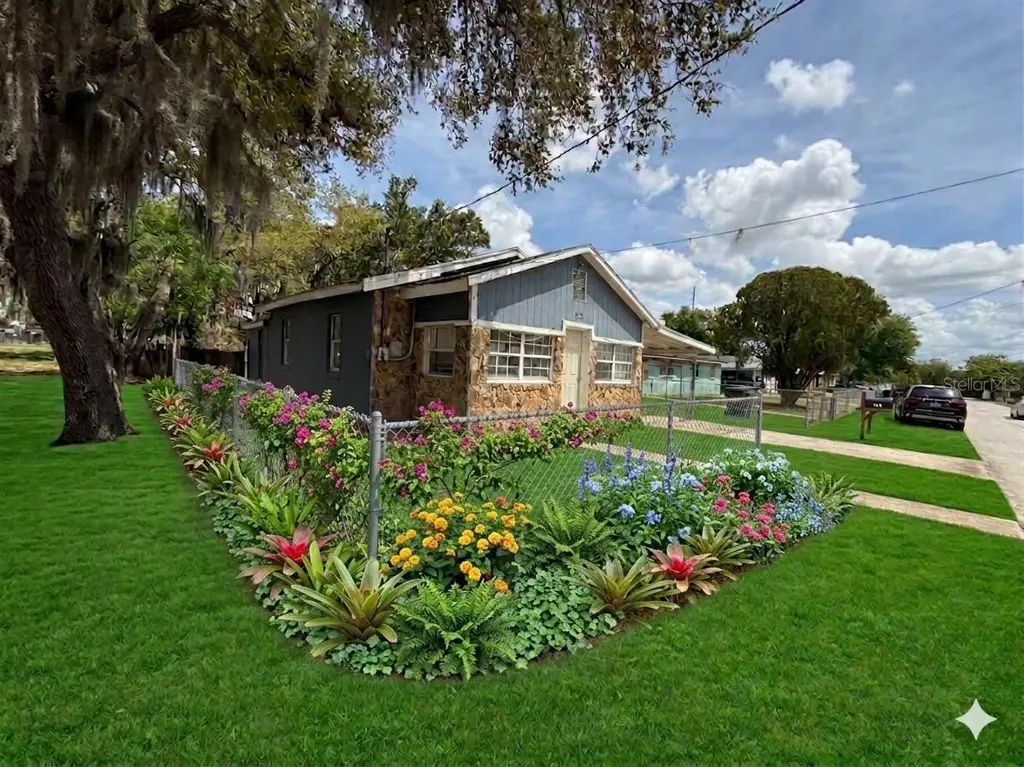
313 E Booker St · Avon Park, FL
Flood risk 1/10 · Minimal
- FEMA flood zone
- X (unshaded)
- Chance of flooding over 30 yrs
- 0.0%
- Est. flood insurance / yr
- $507 – $1,088
Fire risk 4/10 · Minor
- Est. fire insurance / yr
- $947 – $1,759
Heat risk 9/10 · Severe
- Hot days now (above 108°F)
- 7 days/yr
- Hot days in 30 yrs
- 24 days/yr
Wind risk 9/10 · Severe
- Chance of severe wind over 30 yrs
- 99.0%
Air-quality risk 2/10 · Minimal
- Unhealthy air days now
- 2 days/yr
- Unhealthy air days in 30 yrs
- 2 days/yr
Risk factors via First Street. Map © Google.
Why this score? — see what drove the C grade
The composite is a weighted blend of 9 inputs, each scored 0–100. Each bar is that input's sub-score; the figure is the points it added to the 100-point composite (weight × sub-score).
- Cash flow +27.3/30.0
- DSCR +9.5/10.0
- 1% rule +6.8/10.0
- Schools +3.6/10.0
- Livability +3.6/5.0
- Rent growth +2.5/5.0
- Condition / age +2.5/5.0
- ARV discount +0.0/15.0
- Appreciation +0.0/10.0
$94,995
🖨 Deal sheet 📄 Offer letter ✓ Due diligence
Listing remarks
One or more photo(s) has been virtually staged. Value-Add Opportunity! Character-Rich Cottage with Endless Potential Calling all investors and DIY enthusiasts! 313 E Booker St is a 2-bedroom, 1-bathroom residence being offered As-Is, providing a blank canvas for your next project. Whether you are looking for a high-yield rental or a flip in a growing Central Florida pocket, this property is the ultimate entry-level opportunity. The Potential: • Solid Bones & Unique Style: The durable stone/stucco exterior provides a custom look that stands out from standard siding homes. • Interior Refresh Ready: With a functional ~900 sq. ft. layout, this home is primed for a modern cosme
Key facts
- Solid bones
- Unique style
- Backyard blank slate
Tags
Property features AI
Finance
- Other: Living area approximately 900 sq ft
- Financial info: No lease restrictions; Unfurnished
- HOA & community: No association indicated
Exterior
- Parking: Carport (1 space)
- Utilities: Public water; Private sewer; Public utilities
- Home design: Single family residence; Residential property; Two-level home; Faces southeast; Zoned R1A
- Construction: Block, stone and stucco construction; Shingle roof; Slab foundation; Built on a 0.1-acre lot
- Exterior features: Other exterior features; Paved road access
Interior
- Kitchen: Microwave; Range; Refrigerator
- Bedrooms: 2 bedrooms
- Flooring: Laminate flooring; Tile flooring
- Bathrooms: 1 full bathroom
- Heating & cooling: Other heating; Wall/window air conditioning units
- Interior features: Other interior features
- Laundry & utility: Laundry: Other
Neighborhood map
What this means for you Summary
Snapshot
- This is a 2-bed/1.0-bath single-family listed at $95k.
Deal economics
- At list price, monthly cash flow is $274 ($3k/yr) — positive.
- The deal already cash-flows at list — no discount required.
- Meets the 1% rule at list price ($1k rent vs $95k).
- Recommended offer: $89k (6.0% below list) — sets the bar for market timing.
- Cap rate 9.8% vs local median 3.9% in Avon Park — top-decile yield for the area; either an underpriced asset or a hidden risk that comps aren't pricing in. Stress-test before assuming the spread holds.
Location & tenants
- Location reads 71/100 on livability (#407 in FL) — a middle-class / working-renter tenant base. Strengths: cost of living A+, housing A+, health & safety A+; Watch: crime D+, schools F, amenities F.
- Highlands (other): math 45% / reading 43% proficiency, ranked #54 of 73 in FL (top 74%) — families likely to look elsewhere, expect single-tenant / working-renter base with shorter leases; 68% free/reduced lunch — lower-income household profile, screen leases tightly.
- Market conditions: 475 active listings in the ZIP; 2 comparable units currently listed for rent nearby; 980 units permitted in Highlands County in 2024 (80 in 5+ unit buildings).
Forward outlook
- Local home prices are declining (-3.0%/yr); year-one equity from $657 of loan paydown is wiped out by about $3k of value loss. Plan a longer hold.
- At projected returns (-3.0% appreciation + 3.0% rent growth), your $27k cash investment doubles in ~10 years — after that, you're playing with house money.
Negotiation context
- It's been on market 69 days — a 6% lower offer ($89k) is reasonable based on typical stale-listing flexibility.
- 11 sale attempts since 6y ago; this cycle's ask has dropped $10k (10%) from the opening price — seller is motivated, your offer sets the floor, not the list.
- Current owner paid $73k; 30% above their basis — modest negotiation headroom, anchor on the comps not their cost.
Risks & watch-outs
- Watch-outs: built in 1946 — expect roof / HVAC / electrical / plumbing capex.
- Climate carrying-cost: severe wind risk, 99% chance of damaging wind over 30y; extreme-heat days projected 7→24/yr by 2055 (HVAC capex compounding) — expect insurance premiums to compound above CPI over the hold.
Questions for the listing agent
- It's been on market 69 days. Have you received any prior offers? Is the seller open to a 6% concession, seller financing, or rate buy-down credit?
- Built in 1946 — when were the roof, HVAC, electrical panel, plumbing, and water heater last replaced?
- Why hasn't it sold? Are there any deal-killer items the seller is aware of (foundation, flood, title, zoning, code violations)?
- Is there a deadline driving the sale (1031 exchange, divorce, estate, relocation)? That informs how much negotiation room exists.
- Schools are F-rated, which usually means shorter tenancies and higher turnover. Who's the typical renter profile here, and what's been the actual vacancy rate?
- Crime grade is D in this area — have there been break-ins, vandalism, or insurance claims at this property in the last 3 years? What carrier currently insures it and at what premium?
- What's the average days-on-market for RENTAL listings here right now (not sales)? A rising rental-DOM trend means longer vacancies and softer asking-rent achievability than the comps imply.
- What's the recent tenant-quality profile in this submarket — average credit score on applications, eviction rate, late-payment / NSF rate, and stable-employment percentage? A property-management company in the area should have these aggregated.
- How much new for-sale + rental construction is in the pipeline within 1–3 miles? Heavy new supply typically softens prices + rents 12–24 months out; constrained supply supports both.
Investment metrics
- 1% rule
- 1.18% ✓
- Cap rate
- 9.76%
- Cash-on-cash
- 12.38%
- DSCR
- 1.55
- GRM
- 7.1
CMA / ARV
- ARV (on-the-fly)
- $65,520
- Comps found
- 10
Show comp detail 10 sales within ~0.75 mi
| Address | Dist | Beds/Ba | Sqft | Sold | Price | $/sf | Match |
|---|---|---|---|---|---|---|---|
| 308 E Booker St | 0.03mi | 3/1.0 (+1) | 672 (-7%) | 18mo | $52,500 | $78 | 68 |
| 605 E Green St | 0.31mi | 2/1.5 | 700 (-3%) | 14mo | $120,000 | $171 | 67 |
| 425 Las Palmas Cir #612 | 0.49mi | 2/1.0 | 810 (+12%) | 7mo | $75,000 | $93 | 50 |
| 483 Las Palmas Cir #658 | 0.52mi | 2/1.0 | 810 (+12%) | 7mo | $75,000 | $93 | 49 |
| 330 Blanco Ct | 0.53mi | 2/1.0 | 810 (+12%) | 9mo | $67,500 | $83 | 47 |
| 332 Blanco Ct | 0.54mi | 2/1.0 | 810 (+12%) | 9mo | $67,500 | $83 | 47 |
| 412 Las Palmas Cir #607 | 0.52mi | 2/1.0 | 810 (+12%) | 15mo | $65,000 | $80 | 43 |
| 338 Blanco Ct #655 | 0.55mi | 2/1.0 | 810 (+12%) | 15mo | $65,000 | $80 | 41 |
| 311 Blanco Ct | 0.50mi | 2/1.0 | 810 (+12%) | 21mo | $74,000 | $91 | 38 |
| 505 Las Palmas Cir #680 | 0.56mi | 2/1.0 | 810 (+12%) | 21mo | $75,000 | $93 | 35 |
Match score weights: distance 35% · size 25% · config 20% · recency 20%. Top-matched comps best support the ARV.
Projected returns pro-forma
-3.0% appreciation · 3.0% rent growth · sell at horizon
- IRR
- 2.0%
- Equity multiple
- 1.08×
- Total profit
- $2,072
- Equity at exit
- $14,164
- IRR
- 11.6%
- Equity multiple
- 1.91×
- Total profit
- $24,264
- Equity at exit
- $8,213
Cash invested: $26,599 (down + closing). Projections, not guarantees.
Landlord ↔ Tenant lean methodology
- Overall (STATE)
- 87 Strongly Landlord-Friendly
- State Florida
- 87 Strongly Landlord-Friendly · R+3
- County
- — inherits STATE
- City
- — inherits STATE
ZIP-level market 33825
- Home prices YoY
- -25.9%
- Active inventory
- 475
- Price-to-rent
- 7.1×
Monthly cashflow live
- Estimated rent
- $1,121 medium interval (Pro) →
- Mortgage (P&I)
- −$498
- Tax from tax record
- −$73 /mo · $880/yr
- Insurance
- −$40
- HOA
- −$0
- Vacancy / Maint / Mgmt
- −$235
- Net cashflow
- $274
Break-even live
UW: 25.0% down · 7.5% · 30yr · 1.5% tax · 5.0% vac · 8.0% maint · 8.0% mgmt
Financing live
Cash to close
- Down payment
- $23,749
- Closing costs
- $2,850
- Reserves months
- —
- Total cash needed
- —
Loan-product check · same deal, 3 products live
Conventional
25% down · 7.5% · 30yr
- Down + closing
- —
- Monthly P&I
- —
- Monthly cashflow
- —
- DSCR
- —
- Eligible?
- —
Personal DTI + credit; lowest rate.
DSCR
20% down · 8.5% · 30yr
- Down + closing
- —
- Monthly P&I
- —
- Monthly cashflow
- —
- DSCR
- —
- Eligible?
- —
No personal income docs; deal must DSCR.
Hard money
10% down · 12.0% · 12mo
- Down + closing
- —
- Monthly P&I
- —
- Monthly cashflow
- —
- DSCR
- —
- Eligible?
- —
Short-term bridge; refi at stabilization.
Rent comps 2 comps
| Address | Beds | Baths | Sqft | Rent | $/sqft | DOM | Units | Dist |
|---|---|---|---|---|---|---|---|---|
| 1015 W Bell St Avon Park, FL | 1.0 | 1.0 | 576 | $985 | $1.71 | 23d | 1 | 1.16mi |
| 1002 Locke St Avon Park, FL | 1.0 | 1.0 | 462 | $920 | $1.99 | 13d | 10 | 1.37mi |
Listing history 41 events
-
2026-06-19days on market $94,995 Active 69 DOM
-
2026-06-18days on market $94,995 Active 68 DOM
-
2026-06-17days on market $94,995 Active 67 DOM
-
2026-06-16days on market $94,995 Active 66 DOM
-
2026-06-15days on market $94,995 Active 65 DOM
-
2026-06-14days on market $94,995 Active 63 DOM
-
2026-06-10days on market $94,995 Active 60 DOM
-
2026-06-09days on market $94,995 Active 59 DOM
-
2026-06-08days on market $94,995 Active 58 DOM
-
2026-06-07days on market $94,995 Active 57 DOM
-
2026-06-02days on market $94,995 Active 52 DOM
-
2026-06-01days on market $94,995 Active 51 DOM
-
2026-05-31days on market $94,995 Active 50 DOM
-
2026-05-30days on market $94,995 Active 49 DOM
-
2026-05-22price $98,995
-
2026-04-27price $99,995
-
2026-04-11$104,995 Active
-
2024-10-08status Active
-
2024-09-03historical
-
2024-07-31status Pending
-
2024-07-06price $92,500
-
2024-06-03$119,000 Active
-
2024-05-25historical $1,060
-
2024-05-24$1,060
-
2024-05-17historical $1,080
-
2024-04-12$1,080
-
2024-04-10historical $1,080
-
2024-04-04$1,080
-
2024-04-04historical $1,080
-
2024-04-04$1,080
-
2024-03-07historical $1,080
-
2024-03-02$1,080
-
2024-02-25historical $1,080
-
2024-02-18$1,080
-
2021-03-18soldstatus $73,000
-
2021-02-08historical
-
2021-01-11$74,900
-
2021-01-11historical
-
2020-12-12$76,900
-
1992-03-01soldstatus $7,500
-
1988-05-01soldstatus $5,000
ⓘ Source: listings_history table (triggers on properties + properties_extension) + one-shot
backfill from property_details.listing_events for pre-trigger history.
Tax reassessment forecast FL · Resets to sale price
- Current annual tax
- $880 · $73/mo
- Projected year-2 tax
- $880 · $73/mo
- Expected delta
- $0/yr ($0/mo · -0.0%)
ⓘ Screening estimate from a state-policy table — verify with the county assessor before closing.
Climate risk First Street
- Flood 1/10 Low FEMA zone X (unshaded) · 0% chance over 30 yrs
- Wildfire 4/10 Moderate
- Heat 9/10 Extreme 7 d/yr ≥108°F today · 24 d/yr by 30 yrs out
- Wind 9/10 Extreme 99% chance of damaging wind over 30 yrs
- Air quality 2/10 Low 2 unhealthy d/yr today · 2 by 30 yrs out
Nearby sold comps map
Loading sold comps map…
Walkable amenities ~0.75 mi
Loading nearby amenities…
Taxation est. · year 1
- Rental income
- $13,451
- − Mortgage interest
- −$5,321
- − Property taxes
- −$880
- − Insurance
- −$475
- − Repairs & maintenance
- −$1,076
- − Management
- −$1,076
- − Depreciation
- −$2,763
- Taxable income
- $1,859
- Est. tax owed @ 24.0%
- −$446
- After-tax cash flow
- $2,847/yr
For passive investors: Depreciation is non-cash, so a rental often shows a tax loss while cash-flowing — sheltering income. Rental losses are passive: they offset passive income freely, and up to $25,000/yr can offset ordinary (W-2) income if you actively participate and your MAGI is under $100k (phasing out to $0 by $150k); unused losses carry forward. On sale, claimed depreciation is recaptured at up to 25%, and gains may owe capital-gains tax (a 1031 exchange can defer both). Figures are a year-1 estimate at your 24.0% rate — not tax advice; consult a CPA.
Schools (NCES district)
- District
- Highlands
- NCES district ID
- 1200840
- Math proficiency
- 45% ▼ -7.00%
- Reading proficiency
- 43% ▼ -3.00%
- Median HH income
- $35,276
- Composite
- 36.42/100
- National rank
- #4672
- State rank
- #54 of 73 in FL
Livability — Avon Park
- Score
- 71/100
- State rank
- #407
- US rank
- #7205
Category grades
Schools grade is shown separately in the Schools card above.
Census & demographics
- Census place
- Avon Park, FL
- County
- Highlands County · 98,898 people
- City population
- 25,501
- Metro
- Sebring-Avon Park, FL
- Population (ZIP)
- 25,501
- Household income
- $46,949
- Rent vs Own
- Severe rent burden
- 691.0
Population outlook (Highlands County) Hauer SSP2
- Today (2025)
- 99,674 people
- By 2030
- 99,615 · -0.1%
- By 2040
- 99,342 · -0.3%
- By 2050
- 98,242 · -1.4%
- By 2075
- 93,291 · -6.4%
- By 2100
- 79,894 · -19.8%
Race, ethnicity, and origin ACS 2023
- Neighborhood character
- Diverse neighborhood (Simpson 0.64)
- Race & ethnicity
- White 51% Hispanic / Latino 27% Black 17% Two or more races 11% Asian 1%
- Hispanic origin (detail)
- Mexican 8% Puerto Rican 13% Cuban 2%
- Common ancestry
- Slovak 2% Lithuanian 2% Iranian 1%
- Foreign-born
- 10% · Canada, Vietnam, Guatemala
- Languages at home
- 74% English-only · Spanish 24% Tagalog/Filipino 1%
Political lean MEDSL · Highlands
- 2024 margin
- Solid R (+40.8) · D 29.3% · R 70.1%
- 2008→2024 swing
- -22.7pp toward R · 2008: -18.1pp · 2024: -40.8pp
- All cycles
- 2024: R+40.8 2020: R+34.4 2016: R+32.0 2012: R+23.0 2008: R+18.1
Not yet ingested
- Civics
- —
Market trends
- HPI YoY
- ▼ -98.54%
- Current HPI
- 281.8067
- Rent YoY
- —
- Metro
- Sebring-Avon Park, FL
- State GDP YoY
- ▲ 3.28%
- F500 in state
- 36
Industry mix (Fortune 500 HQ in FL)
| Industry | F500 HQs | Revenue |
|---|---|---|
| Industrial Technology | 2 | $29B |
|
||
| Insurance | 2 | $17B |
|
||
| Retail | 1 | $60B |
|
||
| Technology Distribution | 1 | $58B |
|
||
| Homebuilding | 1 | $35B |
|
||
| Technology Manufacturing | 1 | $35B |
|
||
Price history
+1879.9% since first listed27 events — show timeline
- 2026-05-22 Price Changed $98,995 Stellar MLS as Distributed by MLS Grid
- 2026-04-27 Price Changed $99,995 Stellar MLS as Distributed by MLS Grid
- 2026-04-11 Listed $104,995 Stellar MLS as Distributed by MLS Grid
- 2024-10-08 Relisted — Stellar MLS as Distributed by MLS Grid
- 2024-09-03 Listing Removed — Stellar MLS as Distributed by MLS Grid
- 2024-07-31 Pending — Stellar MLS as Distributed by MLS Grid
- 2024-07-06 Price Changed $92,500 Stellar MLS as Distributed by MLS Grid
- 2024-06-03 Listed $119,000 Stellar MLS as Distributed by MLS Grid
- 2024-05-25 Rental Removed $1,060 HAOR
- 2024-05-24 Listed for Rent $1,060 HAOR
- 2024-05-17 Rental Removed $1,080 STELLARMLS
- 2024-04-12 Listed for Rent $1,080 STELLARMLS
- 2024-04-10 Rental Removed $1,080 APPFOLIO
- 2024-04-04 Listed for Rent $1,080 APPFOLIO
- 2024-04-04 Rental Removed $1,080 TURBOTENANT
- 2024-04-04 Listed for Rent $1,080 TURBOTENANT
- 2024-03-07 Rental Removed $1,080 TURBOTENANT
- 2024-03-02 Listed for Rent $1,080 TURBOTENANT
- 2024-02-25 Rental Removed $1,080 TURBOTENANT
- 2024-02-18 Listed for Rent $1,080 TURBOTENANT
- 2021-03-18 Sold (Public Records) $73,000 Public Records
- 2021-02-08 Listing Removed — Stellar MLS as Distributed by MLS Grid
- 2021-01-11 Listing Removed — Stellar MLS as Distributed by MLS Grid
- 2021-01-11 Listed $74,900 Stellar MLS as Distributed by MLS Grid
- 2020-12-12 Listed $76,900 Stellar MLS as Distributed by MLS Grid
- 1992-03-01 Sold (Public Records) $7,500 Public Records
- 1988-05-01 Sold (Public Records) $5,000 Public Records
Property tax history
+8.9%/yrLatest (2025): $880 · +11.4% YoY. Source: county tax records.
Cash-flow waterfall
monthlySold comps — $/sqft
last 12 mo · ≤1 miLoading sold comps…