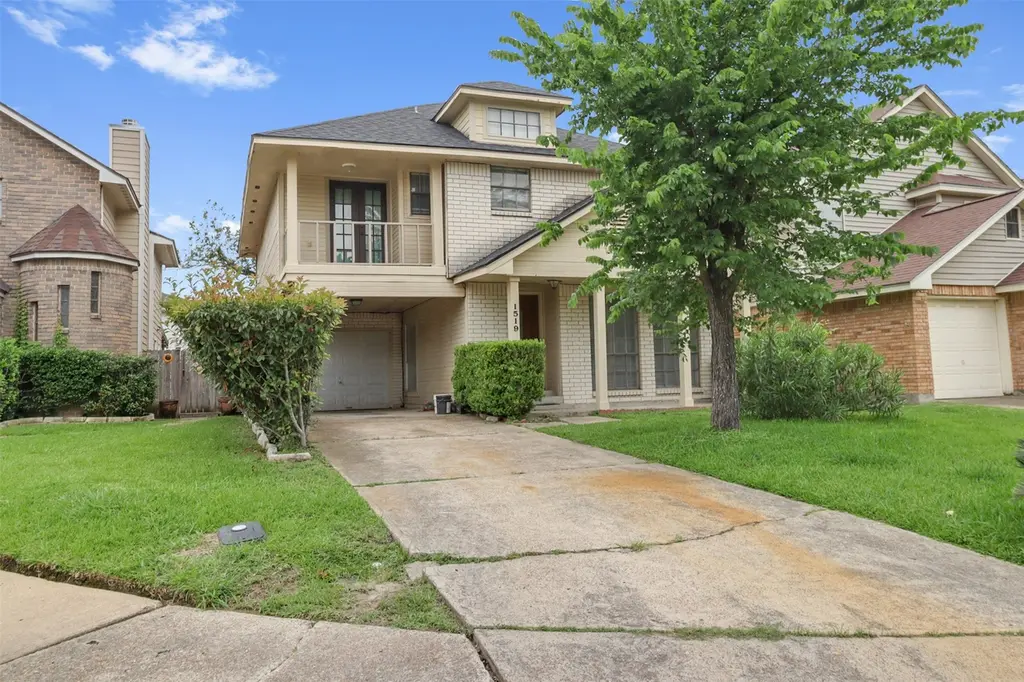
1519 Chertsey Cir · Channelview, TX
Flood risk 4/10 · Minor
- FEMA flood zone
- X (unshaded)
- Chance of flooding over 30 yrs
- 0.24%
- Est. flood insurance / yr
- $507 – $1,088
Fire risk 4/10 · Minor
- Est. fire insurance / yr
- $1,222 – $2,270
Heat risk 9/10 · Severe
- Hot days now (above 109°F)
- 7 days/yr
- Hot days in 30 yrs
- 24 days/yr
Wind risk 9/10 · Severe
- Chance of severe wind over 30 yrs
- 99.0%
Air-quality risk 2/10 · Minimal
- Unhealthy air days now
- 2 days/yr
- Unhealthy air days in 30 yrs
- 2 days/yr
Risk factors via First Street. Map © Google.
Why this score? — see what drove the D+ grade
The composite is a weighted blend of 9 inputs, each scored 0–100. Each bar is that input's sub-score; the figure is the points it added to the 100-point composite (weight × sub-score).
- Cash flow +14.1/30.0
- ARV discount +12.0/15.0
- Rent growth +5.0/5.0
- 1% rule +4.6/10.0
- DSCR +4.3/10.0
- Livability +3.3/5.0
- Schools +2.5/10.0
- Condition / age +2.5/5.0
- Appreciation +0.0/10.0
$195,000
🖨 Deal sheet (PDF) 📄 Offer letter ✓ Due diligence
Key facts
- 3,946 sq ft lot
- Garage
- Built 1985
Property features AI
Finance
- HOA & community: Part of Sterling Green association; Annual association fee of $279 covering recreation facilities; Community has curbs and gutters
Exterior
- Parking: Attached garage (1 car)
- Utilities: Public water; Public sewer
- Home design: Residential property; Single-level entry; Built in 1985
- Construction: Brick construction; Composition roof; Slab foundation
- Exterior features: Concrete road access; Located in a subdivision
Interior
- Bedrooms: Primary bedroom on second level (17x12); Two additional bedrooms on second level (each 12x12)
- Bathrooms: Two full bathrooms; One half bathroom
- Heating & cooling: Central heating (electric); Central air conditioning (electric)
- Interior features: One fireplace; Three total rooms
Neighborhood map
What this means for you Summary
Snapshot
- This is a 3-bed/2.5-bath single-family listed at $195k.
Deal economics
- At list price, monthly cash flow is $27 ($324/yr) — positive.
- The deal already cash-flows at list — no discount required.
- To meet the 1% rule (rent ≥ 1% of price), the offer needs to be $188k (3.6% below list).
- Recommended offer: $188k (3.6% below list) — sets the bar for 1% rule.
- Cap rate 6.5% vs local median 4.7% in Channelview — top-decile yield for the area; either an underpriced asset or a hidden risk that comps aren't pricing in. Stress-test before assuming the spread holds.
Location & tenants
- Location reads 66/100 on livability (#598 in TX) — a middle-class / working-renter tenant base. Strengths: cost of living A+, housing A+; Watch: crime F, amenities F, commute F.
- Channelview ISD (suburban): math 27% / reading 30% proficiency, ranked #640 of 826 in TX (top 78%) — low school quality limits family demand, transient renter base, plan for 1-2y turnover; 70% free/reduced lunch — lower-income household profile, screen leases tightly.
- Zoned schools: Viola Cobb El (math 27% / reading 23%); Aguirre J H (math 24% / reading 28%, grade F, #1,222 of 1,662 statewide, top 74%, 975 students, 76% FRL); Channelview H S (math 24% / reading 35%, grade F, #1,112 of 1,632 statewide, top 70%, 2,893 students, 87% FRL).
- Market conditions: Rents rising fast (+16.9%/yr); 100 active listings in the ZIP; 13 comparable units currently listed for rent nearby; rentals leasing fast (median 5d on market — plan ~1-2 weeks tenant-placement turnaround); 29,883 units permitted in Harris County in 2024 (8,621 in 5+ unit buildings).
- This rent runs 36% of the median local income ($62k/yr) — at the standard rent-burdened threshold; future hikes will face affordability resistance.
Forward outlook
- Local home prices are declining (-3.0%/yr); year-one equity from $1k of loan paydown is wiped out by about $6k of value loss. Plan a longer hold.
- Harris County population projected at +47% by 2050 — long-run rental-demand tailwind backs the buy-and-hold thesis.
Negotiation context
- It's been on market 46 days — a 3% lower offer ($189k) is reasonable based on typical stale-listing flexibility.
- 2 sale attempts since 19y ago with the ask held roughly flat each time — persistent listings suggest the price (not the market) is what's stuck; bring a comps-based counter.
- Current owner paid $80k; list at $195k implies a 144% gain — meaningful room to come down on a strong offer.
Risks & watch-outs
- Climate carrying-cost: severe wind risk, 99% chance of damaging wind over 30y; extreme-heat days projected 7→24/yr by 2055 (HVAC capex compounding) — expect insurance premiums to compound above CPI over the hold.
Questions for the listing agent
- It's been on market 46 days. Have you received any prior offers? Is the seller open to a 4% concession, seller financing, or rate buy-down credit?
- What does the HOA fee cover, when was the last increase, and are there any pending special assessments or reserve-fund shortfalls?
- Is there a deadline driving the sale (1031 exchange, divorce, estate, relocation)? That informs how much negotiation room exists.
- Schools are D-rated, which usually means shorter tenancies and higher turnover. Who's the typical renter profile here, and what's been the actual vacancy rate?
- Crime grade is F in this area — have there been break-ins, vandalism, or insurance claims at this property in the last 3 years? What carrier currently insures it and at what premium?
- The area grade is low — what's the realistic commute time and amenity access for the typical tenant pool here? Any planned neighborhood developments (good or bad) we should know about?
- What's the average days-on-market for RENTAL listings here right now (not sales)? A rising rental-DOM trend means longer vacancies and softer asking-rent achievability than the comps imply.
- What's the recent tenant-quality profile in this submarket — average credit score on applications, eviction rate, late-payment / NSF rate, and stable-employment percentage? A property-management company in the area should have these aggregated.
- How much new for-sale + rental construction is in the pipeline within 1–3 miles? Heavy new supply typically softens prices + rents 12–24 months out; constrained supply supports both.
Investment metrics
- 1% rule
- 0.96% ✗
- Cap rate
- 6.46%
- Cash-on-cash
- 0.59%
- DSCR
- 1.03
- GRM
- 8.6
CMA / ARV
- ARV (median comp)
- $216,832
- List price
- $195,000
- Delta
- -10.07%
- Verdict
- UNDERPRICED
- Comps
- 20 within 1.0 mi
Show comp detail 12 sales within ~0.75 mi
| Address | Dist | Beds/Ba | Sqft | Sold | Price | $/sf | Match |
|---|---|---|---|---|---|---|---|
| 1510 Chertsey Cir | 0.04mi | 3/2.5 | 1,620 (-2%) | 3mo | $235,000 | $145 | 92 |
| 1342 Padstow Ln | 0.37mi | 3/2.0 | 1,664 (+0%) | 1mo | $229,000 | $138 | 79 |
| 1331 Padstow Ln | 0.39mi | 4/2.0 (+1) | 1,650 (-0%) | 2mo | $214,900 | $130 | 72 |
| 5950 Carpenters Hollow Ct | 0.56mi | 3/2.0 | 1,607 (-3%) | 1mo | $259,900 | $162 | 66 |
| 1323 Padstow Ln | 0.41mi | 3/2.0 | 1,538 (-7%) | 5mo | $170,000 | $111 | 63 |
| 234 Wentworth Park Dr | 0.74mi | 3/2.0 | 1,649 (-0%) | 2mo | $249,900 | $152 | 61 |
| 14918 Silver Green Dr S | 0.41mi | 3/2.0 | 1,860 (+12%) | 1mo | $235,000 | $126 | 58 |
| 14502 Fargo Woods Cir | 0.68mi | 3/2.0 | 1,600 (-3%) | 4mo | $224,900 | $141 | 57 |
| 1322 Littleport Ln | 0.54mi | 3/2.0 | 1,518 (-8%) | 4mo | $245,000 | $161 | 55 |
| 1327 Padstow Ln | 0.40mi | 3/2.0 | 1,417 (-14%) | 1mo | $229,000 | $162 | 55 |
| 15110 Peachmeadow Ln | 0.42mi | 3/2.0 | 1,417 (-14%) | 3mo | $249,900 | $176 | 52 |
| 1362 Leadenhall Cir | 0.61mi | 3/2.0 | 1,462 (-12%) | 5mo | $239,000 | $163 | 46 |
Match score weights: distance 35% · size 25% · config 20% · recency 20%. Top-matched comps best support the ARV.
Projected returns pro-forma
-3.0% appreciation · 8.0% rent growth · sell at horizon
- IRR
- -9.4%
- Equity multiple
- 0.64×
- Total profit
- $-19,851
- Equity at exit
- $29,075
- IRR
- 6.1%
- Equity multiple
- 1.56×
- Total profit
- $30,517
- Equity at exit
- $16,860
Cash invested: $54,600 (down + closing). Projections, not guarantees.
Landlord ↔ Tenant lean methodology
- Overall (STATE)
- 87 Strongly Landlord-Friendly
- State Texas
- 87 Strongly Landlord-Friendly · R+5
- County
- — inherits STATE
- City
- — inherits STATE
ZIP-level market 77530
- Rents YoY
- 16.9%
- Active inventory
- 100
- Price-to-rent
- 8.6×
Monthly cashflow live
- Estimated rent
- $1,879 high interval (Pro) →
- Mortgage (P&I)
- −$1,023
- Tax from tax record
- −$331 /mo · $3,967/yr
- Insurance
- −$81
- HOA
- −$23
- Vacancy / Maint / Mgmt
- −$395
- Net cashflow
- $27
Break-even live
Sensitivity live
| Price | -10% $137 | -5% $82 | +0% $27 | +5% $-28 | +10% $-83 |
|---|---|---|---|---|---|
| Rent | -10% $-121 | -5% $-47 | +0% $27 | +5% $101 | +10% $175 |
| Rate | -1.0pp $125 | -0.5pp $77 | base $27 | +0.5pp $-24 | +1.0pp $-75 |
UW: 25.0% down · 7.5% · 30yr · 1.5% tax · 5.0% vac · 8.0% maint · 8.0% mgmt
Financing live
Cash to close
- Down payment
- $48,750
- Closing costs
- $5,850
- Reserves months
- —
- Total cash needed
- —
Loan-product check · same deal, 3 products live
Conventional
25% down · 7.5% · 30yr
- Down + closing
- —
- Monthly P&I
- —
- Monthly cashflow
- —
- DSCR
- —
- Eligible?
- —
Personal DTI + credit; lowest rate.
DSCR
20% down · 8.5% · 30yr
- Down + closing
- —
- Monthly P&I
- —
- Monthly cashflow
- —
- DSCR
- —
- Eligible?
- —
No personal income docs; deal must DSCR.
Hard money
10% down · 12.0% · 12mo
- Down + closing
- —
- Monthly P&I
- —
- Monthly cashflow
- —
- DSCR
- —
- Eligible?
- —
Short-term bridge; refi at stabilization.
Rent comps 13 comps
| Address | Beds | Baths | Sqft | Rent | $/sqft | DOM | Units | Dist |
|---|---|---|---|---|---|---|---|---|
| 1391 Tenderden Dr Channelview, TX | 3.0 | 2.0 | 1464 | $1,699 | $1.16 | 0d | 1 | 0.21mi |
| 14831 Waterside Dr Houston, TX | 3.0 | 2.0 | 1638 | $1,779 | $1.09 | 4d | 1 | 0.29mi |
| 1335 Willersley Ln Channelview, TX | 3.0 | 2.0 | 1669 | $1,775 | $1.06 | 4d | 1 | 0.56mi |
| 1379 Dell Dale St Channelview, TX | 4.0 | 2.0 | 1444 | $1,893 | $1.31 | 7d | 1 | 0.84mi |
| 947 Leadenhall Cir Channelview, TX | 3.0 | 2.5 | 1620 | $1,806 | $1.11 | 0d | 1 | 1.00mi |
| 15255 Ferness Ln Channelview, TX | 4.0 | 2.0 | 1326 | $1,668 | $1.26 | 4d | 10 | 1.01mi |
| 6301 Pale Sage Dr Houston, TX | 1.0–3.0 | 1.0–2.0 | 1048 | $2,429 | $2.32 | 0d | 23 | 1.02mi |
| 644 Majestic Ridge Dr Houston, TX | 2.0 | 2.0 | 1079 | $1,800 | $1.67 | 45d | 1 | 1.04mi |
| 15110 N Castlegory Houston, TX | 2.0 | 2.0 | 1079 | $1,670 | $1.55 | 13d | 1 | 1.05mi |
| 6464 E Sam Houston Pkwy N Houston, TX | 1.0–3.0 | 1.0–2.0 | 1097 | $1,889 | $1.72 | 0d | 13 | 1.11mi |
| 810 Townley St Channelview, TX | 3.0 | 3.5 | 1713 | $1,925 | $1.12 | 45d | 1 | 1.18mi |
| 13726 Rampchester Ln Houston, TX | 4.0 | 2.0 | 1492 | $1,900 | $1.27 | 45d | 1 | 1.41mi |
| 6622 Hawthorne Falls Ln Houston, TX | 3.0 | 2.0 | 1590 | $1,866 | $1.17 | 23d | 1 | 1.44mi |
HOA detail
- Monthly dues
- $23 · $276/yr
Listing history 20 events
-
2026-06-21days on market $195,000 Active 46 DOM
-
2026-06-18days on market $195,000 Active 43 DOM
-
2026-06-17days on market $195,000 Active 42 DOM
-
2026-06-16days on market $195,000 Active 41 DOM
-
2026-06-15days on market $195,000 Active 40 DOM
-
2026-06-13days on market $195,000 Active 38 DOM
-
2026-06-09days on market $195,000 Active 34 DOM
-
2026-06-08days on market $195,000 Active 33 DOM
-
2026-06-07days on market $195,000 Active 32 DOM
-
2026-06-04days on market $195,000 Active 29 DOM
-
2026-06-03days on market $195,000 Active 28 DOM
-
2026-06-02days on market $195,000 Active 27 DOM
-
2026-06-01days on market $195,000 Active 26 DOM
-
2026-05-31days on market $195,000 Active 25 DOM
-
2026-05-06$200,000 Active 404-char remark
-
2008-03-29historical
-
2007-03-07$96,500
-
2000-02-22soldstatus
-
2000-02-01soldstatus $79,900
-
1999-07-19soldstatus
ⓘ Source: listings_history table (triggers on properties + properties_extension) + one-shot
backfill from property_details.listing_events for pre-trigger history.
Tax reassessment forecast TX · Resets to sale price
- Current annual tax
- $3,967 · $331/mo
- Projected year-2 tax
- $3,967 · $331/mo
- Expected delta
- $0/yr ($0/mo · -0.0%)
ⓘ Screening estimate from a state-policy table — verify with the county assessor before closing.
Climate risk First Street
- Flood 4/10 Moderate FEMA zone X (unshaded) · 24% chance over 30 yrs
- Wildfire 4/10 Moderate
- Heat 9/10 Extreme 7 d/yr ≥109°F today · 24 d/yr by 30 yrs out
- Wind 9/10 Extreme 99% chance of damaging wind over 30 yrs
- Air quality 2/10 Low 2 unhealthy d/yr today · 2 by 30 yrs out
Nearby sold comps map
Loading sold comps map…
Walkable amenities ~0.75 mi
Loading nearby amenities…
Taxation est. · year 1
- Rental income
- $22,548
- − Mortgage interest
- −$10,923
- − Property taxes
- −$3,967
- − Insurance
- −$975
- − Repairs & maintenance
- −$1,804
- − Management
- −$1,804
- − HOA
- −$276
- − Depreciation
- −$5,673
- Taxable loss
- −$2,873
- Est. tax savings @ 24.0%
- +$689
- After-tax cash flow
- $1,014/yr
For passive investors: Depreciation is non-cash, so a rental often shows a tax loss while cash-flowing — sheltering income. Rental losses are passive: they offset passive income freely, and up to $25,000/yr can offset ordinary (W-2) income if you actively participate and your MAGI is under $100k (phasing out to $0 by $150k); unused losses carry forward. On sale, claimed depreciation is recaptured at up to 25%, and gains may owe capital-gains tax (a 1031 exchange can defer both). Figures are a year-1 estimate at your 24.0% rate — not tax advice; consult a CPA.
Schools (NCES district)
- District
- Channelview ISD
- NCES district ID
- 4813590
- Math proficiency
- 27% ▼ -22.00%
- Reading proficiency
- 30% ▼ -8.00%
- Median HH income
- $52,320
- Composite
- 25.18/100
- National rank
- #7513
- State rank
- #640 of 826 in TX
Livability — Channelview
- Score
- 66/100
- State rank
- #598
- US rank
- #11392
Category grades
Schools grade is shown separately in the Schools card above.
Census & demographics
- Census place
- Channelview, TX
- County
- Harris County · 4,702,590 people
- City population
- 31,527
- Metro
- Houston-The Woodlands-Sugar Land, TX
- Population (ZIP)
- 31,527
- Household income
- $62,195
- Rent vs Own
- Severe rent burden
- 966.0
Population outlook (Harris County) Hauer SSP2
- Today (2025)
- 5,571,493 people
- By 2030
- 6,089,821 · +9.3%
- By 2040
- 7,142,806 · +28.2%
- By 2050
- 8,185,864 · +46.9%
- By 2075
- 10,574,329 · +89.8%
- By 2100
- 12,109,958 · +117.4%
Race, ethnicity, and origin ACS 2023
- Neighborhood character
- Predominantly Hispanic (71%)
- Race & ethnicity
- Hispanic / Latino 71% Two or more races 31% White 16% Black 9% Asian 4% Native American 1%
- Hispanic origin (detail)
- Mexican 61%
- Common ancestry
- Slovak 1% Lithuanian 1%
- Foreign-born
- 33% · Canada, Vietnam, Jamaica
- Languages at home
- 37% English-only · Spanish 60% Other Asian/Pacific 1% Vietnamese 1%
Political lean MEDSL · Harris
- 2024 margin
- Lean D (+5.5) · D 52.0% · R 46.4% · Other 1.6%
- 2008→2024 swing
- +3.9pp toward D · 2008: 1.6pp · 2024: 5.5pp
- All cycles
- 2024: D+5.5 2020: D+13.3 2016: D+12.4 2012: D+0.1 2008: D+1.6
Not yet ingested
- Civics
- —
Market trends
- HPI YoY
- ▼ -172.05%
- Current HPI
- 292.1862
- Rent YoY
- ▲ 16.85%
- Metro
- Houston-The Woodlands-Sugar Land, TX
- State GDP YoY
- ▲ 3.95%
- F500 in state
- 110
Industry mix (Fortune 500 HQ in TX)
| Industry | F500 HQs | Revenue |
|---|---|---|
| Energy | 16 | $1,198B |
|
||
| Technology | 5 | $198B |
|
||
| Engineering / Construction | 4 | $72B |
|
||
| Energy Services | 3 | $60B |
|
||
| Utilities | 3 | $41B |
|
||
| Healthcare | 2 | $330B |
|
||
Price history
+144.1% since first listed7 events — show timeline
- 2026-05-22 Price Changed $195,000 HARMLS
- 2026-05-06 Listed $200,000 HARMLS
- 2008-03-29 Listing Removed — HARMLS
- 2007-03-07 Listed $96,500 HARMLS
- 2000-02-22 Sold (Public Records) — Public Records
- 2000-02-01 Sold (Public Records) $79,900 Public Records
- 1999-07-19 Sold (Public Records) — Public Records
Property tax history
+6.1%/yrLatest (2025): $3,967 · -3.3% YoY. Source: county tax records.
Cash-flow waterfall
monthlySold comps — $/sqft
last 12 mo · ≤1 miLoading sold comps…