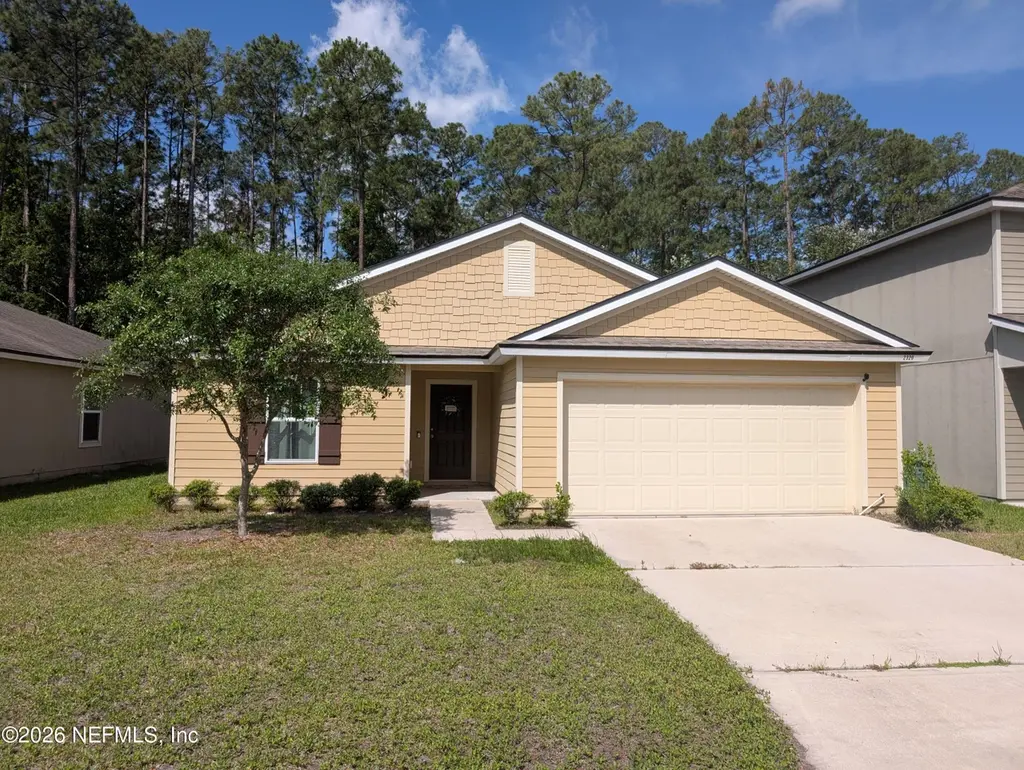
2320 Sotterley Ln · Jacksonville, FL
Flood risk 1/10 · Minimal
- FEMA flood zone
- X (unshaded)
- Chance of flooding over 30 yrs
- 0.0%
- Est. flood insurance / yr
- $507 – $1,088
Fire risk 6/10 · Moderate
- Est. fire insurance / yr
- $947 – $1,759
Heat risk 8/10 · Major
- Hot days now (above 107°F)
- 7 days/yr
- Hot days in 30 yrs
- 20 days/yr
Wind risk 9/10 · Severe
- Chance of severe wind over 30 yrs
- 99.0%
Air-quality risk 4/10 · Minor
- Unhealthy air days now
- 5 days/yr
- Unhealthy air days in 30 yrs
- 7 days/yr
Risk factors via First Street. Map © Google.
Why this score? — see what drove the D- grade
The composite is a weighted blend of 9 inputs, each scored 0–100. Each bar is that input's sub-score; the figure is the points it added to the 100-point composite (weight × sub-score).
- Cash flow +12.4/30.0
- ARV discount +7.5/15.0
- Livability +4.2/5.0
- Schools +3.9/10.0
- DSCR +3.7/10.0
- 1% rule +3.3/10.0
- Rent growth +2.5/5.0
- Condition / age +2.5/5.0
- Appreciation +0.0/10.0
$255,000
🖨 Deal sheet (PDF) 📄 Offer letter ✓ Due diligence
Listing remarks MLS
D. R. Horton is proudly announcing that its affordable Express Homes are now coming to Pritchard Point, an established community located in Jacksonville in the popular Westside area. Homeowners will enjoy the short commute to any part of the greater Jacksonville area, including Jacksonville International Airport, River City Mall, downtown, and the beaches. Please call today for an appointment to see available home sites and plans!
Key facts
- 6,534 sq ft lot
- 2 garage spots
- Built 2018
Property features AI
Finance
- HOA & community: Has an association; Association fee $150 quarterly
Exterior
- Parking: Attached garage; 2-car garage
- Utilities: Public sewer; Cable connected; Electricity connected; Sewer connected; Water connected
- Home design: Single family residence; One story
- Construction: Frame construction; Shingle roof
- Exterior features: Rear porch; Back yard fencing
Interior
- Kitchen: Dishwasher; Disposal; Electric range; Microwave; Refrigerator
- Bedrooms: 3 bedrooms
- Flooring: Carpet; Vinyl
- Bathrooms: 2 full bathrooms
- Heating & cooling: Central heating (electric); Central air (electric); Has heating and cooling
- Interior features: Ceiling fans; Split bedroom floorplan; Walk-in closets
- Laundry & utility: Electric water heater
Neighborhood map
What this means for you Summary
Snapshot
- This is a 3-bed/2.0-bath single-family listed at $255k.
Deal economics
- At list price, monthly cash flow is $-44 ($-525/yr) — negative.
- To cash-flow at today's rent, offer at most $247k (3.0% below list).
- To meet the 1% rule (rent ≥ 1% of price), the offer needs to be $212k (16.7% below list).
- Recommended offer: $212k (16.7% below list) — sets the bar for 1% rule.
- Cap rate 6.1% vs local median 3.9% in Jacksonville — top-decile yield for the area; either an underpriced asset or a hidden risk that comps aren't pricing in. Stress-test before assuming the spread holds.
Location & tenants
- Location reads 83/100 on livability (#50 in FL, #911 nationally) — a professional / high-income tenant draw. Strengths: amenities A+, commute A+, housing A+.
- Duval (urban): math 46% / reading 45% proficiency, ranked #48 of 73 in FL (top 66%) — families likely to look elsewhere, expect single-tenant / working-renter base with shorter leases.
- Zoned schools: Pickett Elementary School (math 57% / reading 37%, grade D-, #1,191 of 2,144 statewide, top 57%, 200 students, 73% FRL); Jean Ribault Middle School (math 28% / reading 24%, grade F, #506 of 571 statewide, top 89%, 679 students, 78% FRL); Edward H. White High School (math 31% / reading 25%, grade F, #464 of 667 statewide, top 70%, 1,538 students, 64% FRL) — zoned schools average 72% FRL vs 49% district-wide (22 pts higher); higher-poverty schools than district average — tighter screening recommended.
- Market conditions: 112 active listings in the ZIP; 2 comparable units currently listed for rent nearby; solid renter incomes; 6,503 units permitted in Duval County in 2024 (1,131 in 5+ unit buildings).
- This rent runs 31% of the median local income ($82k/yr) — at the standard rent-burdened threshold; future hikes will face affordability resistance.
Forward outlook
- Local home prices are declining (-3.0%/yr); year-one equity from $2k of loan paydown is wiped out by about $8k of value loss. Plan a longer hold.
- Duval County population projected at +19% by 2050 — long-run rental-demand tailwind backs the buy-and-hold thesis.
Negotiation context
- Only 13 days on market — expect competitive offers; lowballing is unlikely to land.
- 4 sale attempts since 8y ago with the ask held roughly flat each time — persistent listings suggest the price (not the market) is what's stuck; bring a comps-based counter.
- Current owner paid $186k; 37% above their basis — modest negotiation headroom, anchor on the comps not their cost.
Risks & watch-outs
- Climate carrying-cost: severe wind risk, 99% chance of damaging wind over 30y; major wildfire risk; extreme-heat days projected 7→20/yr by 2055 (HVAC capex compounding) — expect insurance premiums to compound above CPI over the hold.
Questions for the listing agent
- What do current leases actually rent for vs. the listed asking? Can we see a recent rent roll and the last 12 months of T-12 income?
- What does the HOA fee cover, when was the last increase, and are there any pending special assessments or reserve-fund shortfalls?
- Is there a deadline driving the sale (1031 exchange, divorce, estate, relocation)? That informs how much negotiation room exists.
- Schools are B-rated — typically a magnet for longer-tenancy family renters. What's the average tenant stay here, and is there a school-zone premium baked into asking?
- The area grade is low — what's the realistic commute time and amenity access for the typical tenant pool here? Any planned neighborhood developments (good or bad) we should know about?
- What's the average days-on-market for RENTAL listings here right now (not sales)? A rising rental-DOM trend means longer vacancies and softer asking-rent achievability than the comps imply.
- What's the recent tenant-quality profile in this submarket — average credit score on applications, eviction rate, late-payment / NSF rate, and stable-employment percentage? A property-management company in the area should have these aggregated.
- How much new for-sale + rental construction is in the pipeline within 1–3 miles? Heavy new supply typically softens prices + rents 12–24 months out; constrained supply supports both.
Investment metrics
- 1% rule
- 0.83% ✗
- Cap rate
- 6.09%
- Cash-on-cash
- -0.73%
- DSCR
- 0.97
- GRM
- 10.0
CMA / ARV
- ARV (on-the-fly)
- $254,932
- Comps found
- 5
Show comp detail 5 sales within ~0.75 mi
| Address | Dist | Beds/Ba | Sqft | Sold | Price | $/sf | Match |
|---|---|---|---|---|---|---|---|
| 2380 Sotterley Ln | 0.10mi | 3/2.0 | 1,564 (0%) | 9mo | $271,500 | $174 | 88 |
| 2219 Sotterley Ln | 0.17mi | 3/2.0 | 1,351 (-14%) | 4mo | $235,000 | $174 | 67 |
| 7112 Gunston Hall Ct | 0.28mi | 3/2.0 | 1,755 (+12%) | 5mo | $220,000 | $125 | 62 |
| 2060 Nottoway Woods Ln | 0.47mi | 3/2.0 | 1,711 (+9%) | 2mo | $267,000 | $156 | 61 |
| 7125 Plymouth Grove Ct | 0.42mi | 4/2.0 (+1) | 1,670 (+7%) | 9mo | $273,000 | $163 | 56 |
Match score weights: distance 35% · size 25% · config 20% · recency 20%. Top-matched comps best support the ARV.
Projected returns pro-forma
-3.0% appreciation · 3.0% rent growth · sell at horizon
- IRR
- -17.5%
- Equity multiple
- 0.38×
- Total profit
- $-44,099
- Equity at exit
- $38,021
- IRR
- -9.6%
- Equity multiple
- 0.41×
- Total profit
- $-41,957
- Equity at exit
- $22,048
Cash invested: $71,400 (down + closing). Projections, not guarantees.
Landlord ↔ Tenant lean methodology
- Overall (STATE)
- 87 Strongly Landlord-Friendly
- State Florida
- 87 Strongly Landlord-Friendly · R+3
- County
- — inherits STATE
- City
- — inherits STATE
ZIP-level market 32220
- Home prices YoY
- -18.1%
- Active inventory
- 112
- Price-to-rent
- 10.0×
Monthly cashflow live
- Estimated rent
- $2,124 medium interval (Pro) →
- Mortgage (P&I)
- −$1,337
- Tax from tax record
- −$228 /mo · $2,741/yr
- Insurance
- −$106
- HOA
- −$50
- Vacancy / Maint / Mgmt
- −$446
- Net cashflow
- $-44
Break-even live
Sensitivity live
| Price | -10% $101 | -5% $28 | +0% $-44 | +5% $-116 | +10% $-188 |
|---|---|---|---|---|---|
| Rent | -10% $-212 | -5% $-128 | +0% $-44 | +5% $40 | +10% $124 |
| Rate | -1.0pp $85 | -0.5pp $21 | base $-44 | +0.5pp $-110 | +1.0pp $-177 |
UW: 25.0% down · 7.5% · 30yr · 1.5% tax · 5.0% vac · 8.0% maint · 8.0% mgmt
Financing live
Cash to close
- Down payment
- $63,750
- Closing costs
- $7,650
- Reserves months
- —
- Total cash needed
- —
Loan-product check · same deal, 3 products live
Conventional
25% down · 7.5% · 30yr
- Down + closing
- —
- Monthly P&I
- —
- Monthly cashflow
- —
- DSCR
- —
- Eligible?
- —
Personal DTI + credit; lowest rate.
DSCR
20% down · 8.5% · 30yr
- Down + closing
- —
- Monthly P&I
- —
- Monthly cashflow
- —
- DSCR
- —
- Eligible?
- —
No personal income docs; deal must DSCR.
Hard money
10% down · 12.0% · 12mo
- Down + closing
- —
- Monthly P&I
- —
- Monthly cashflow
- —
- DSCR
- —
- Eligible?
- —
Short-term bridge; refi at stabilization.
Rent comps 2 comps
| Address | Beds | Baths | Sqft | Rent | $/sqft | DOM | Units | Dist |
|---|---|---|---|---|---|---|---|---|
| 7088 Plymouth Grove Ct Jacksonville, FL | 4.0 | 2.0 | 1648 | $1,835 | $1.11 | 26d | 1 | 0.39mi |
| 5950 Round Table Rd Jacksonville, FL | 3.0 | 2.5 | 2084 | $2,000 | $0.96 | 9d | 1 | 1.22mi |
HOA detail
- Monthly dues
- $50 · $600/yr
Listing history 9 events
-
2026-06-21days on market $255,000 Active 13 DOM
-
2026-06-18days on market $255,000 Active 10 DOM
-
2026-06-17days on market $255,000 Active 9 DOM
-
2026-06-16days on market $255,000 Active 8 DOM
-
2026-06-15days on market $255,000 Active 7 DOM
-
2026-06-13days on market $255,000 Active 5 DOM
-
2026-06-13days on market $255,000 Active 4 DOM
-
2026-06-08remarks 699-char remark
-
2026-06-08$255,000 Active 1 DOM
ⓘ Source: listings_history table (triggers on properties + properties_extension) + one-shot
backfill from property_details.listing_events for pre-trigger history.
Tax reassessment forecast FL · Resets to sale price
- Current annual tax
- $2,741 · $228/mo
- Projected year-2 tax
- $2,741 · $228/mo
- Expected delta
- $0/yr ($0/mo · 0.0%)
ⓘ Screening estimate from a state-policy table — verify with the county assessor before closing.
Climate risk First Street
- Flood 1/10 Low FEMA zone X (unshaded) · 0% chance over 30 yrs
- Wildfire 6/10 Major
- Heat 8/10 Severe 7 d/yr ≥107°F today · 20 d/yr by 30 yrs out
- Wind 9/10 Extreme 99% chance of damaging wind over 30 yrs
- Air quality 4/10 Moderate 5 unhealthy d/yr today · 7 by 30 yrs out
Nearby sold comps map
Loading sold comps map…
Walkable amenities ~0.75 mi
Loading nearby amenities…
Taxation est. · year 1
- Rental income
- $25,491
- − Mortgage interest
- −$14,284
- − Property taxes
- −$2,741
- − Insurance
- −$1,275
- − Repairs & maintenance
- −$2,039
- − Management
- −$2,039
- − HOA
- −$600
- − Depreciation
- −$7,418
- Taxable loss
- −$4,905
- Est. tax savings @ 24.0%
- +$1,177
- After-tax cash flow
- $653/yr
For passive investors: Depreciation is non-cash, so a rental often shows a tax loss while cash-flowing — sheltering income. Rental losses are passive: they offset passive income freely, and up to $25,000/yr can offset ordinary (W-2) income if you actively participate and your MAGI is under $100k (phasing out to $0 by $150k); unused losses carry forward. On sale, claimed depreciation is recaptured at up to 25%, and gains may owe capital-gains tax (a 1031 exchange can defer both). Figures are a year-1 estimate at your 24.0% rate — not tax advice; consult a CPA.
Schools (NCES district)
- District
- Duval
- NCES district ID
- 1200480
- Math proficiency
- 46% ▼ -11.00%
- Reading proficiency
- 45% ▼ -4.00%
- Median HH income
- $48,987
- Composite
- 38.97/100
- National rank
- #4076
- State rank
- #48 of 73 in FL
Livability — Jacksonville
- Score
- 83/100
- State rank
- #50
- US rank
- #911
Category grades
Schools grade is shown separately in the Schools card above.
Census & demographics
- Census place
- Jacksonville, FL
- County
- Duval County · 1,015,274 people
- City population
- 979,034
- Metro
- Jacksonville, FL
- Population (ZIP)
- 12,298
- Household income
- $81,792
- Rent vs Own
- Severe rent burden
- 177.0
Population outlook (Duval County) Hauer SSP2
- Today (2025)
- 1,013,010 people
- By 2030
- 1,059,228 · +4.6%
- By 2040
- 1,141,439 · +12.7%
- By 2050
- 1,205,258 · +19.0%
- By 2075
- 1,324,282 · +30.7%
- By 2100
- 1,319,620 · +30.3%
Race, ethnicity, and origin ACS 2023
- Neighborhood character
- Diverse neighborhood (Simpson 0.58)
- Race & ethnicity
- White 61% Black 19% Hispanic / Latino 11% Two or more races 11% Asian 5%
- Hispanic origin (detail)
- Cuban 7%
- Common ancestry
- Italian 2% Slovak 1% Portuguese 1%
- Foreign-born
- 8% · Canada
- Languages at home
- 95% English-only · Spanish 4% Arabic 1%
Political lean MEDSL · Duval
- 2024 margin
- Toss-up / Even · D 48.7% · R 50.1% · Other 1.2%
- 2008→2024 swing
- +0.4pp no change · 2008: -1.9pp · 2024: -1.5pp
- All cycles
- 2024: R+1.5 2020: D+3.8 2016: R+1.5 2012: R+3.6 2008: R+1.9
Not yet ingested
- Civics
- —
Market trends
- HPI YoY
- ▼ -64.90%
- Current HPI
- 293.7943
- Rent YoY
- —
- Metro
- Jacksonville, FL
- State GDP YoY
- ▲ 3.28%
- F500 in state
- 36
Industry mix (Fortune 500 HQ in FL)
| Industry | F500 HQs | Revenue |
|---|---|---|
| Industrial Technology | 2 | $29B |
|
||
| Insurance | 2 | $17B |
|
||
| Retail | 1 | $60B |
|
||
| Technology Distribution | 1 | $58B |
|
||
| Homebuilding | 1 | $35B |
|
||
| Technology Manufacturing | 1 | $35B |
|
||
Price history
+35.0% since first listed10 events — show timeline
- 2026-06-08 Relisted — realMLS
- 2026-06-04 Listed $255,000 realMLS
- 2026-06-03 Listing Removed — realMLS
- 2018-09-21 Sold (MLS) $185,844 realMLS
- 2018-08-28 Pending — realMLS
- 2018-08-17 Price Changed $189,990 realMLS
- 2018-08-13 Price Changed $190,990 realMLS
- 2018-08-13 Relisted — realMLS
- 2018-04-23 Pending — realMLS
- 2018-03-01 Listed $188,840 realMLS
Property tax history
+2.9%/yrLatest (2025): $2,741 · +9.4% YoY. Source: county tax records.
Cash-flow waterfall
monthlySold comps — $/sqft
last 12 mo · ≤1 miLoading sold comps…