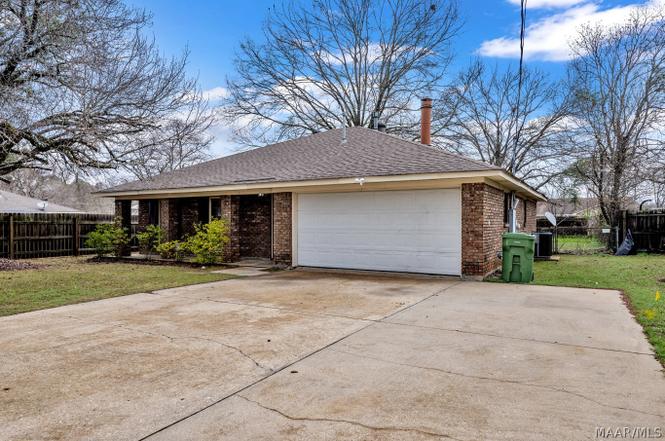
868 Dunbarton Dr · Montgomery, AL
Flood risk 1/10 · Minimal
- FEMA flood zone
- X (unshaded)
- Chance of flooding over 30 yrs
- 0.0%
- Est. flood insurance / yr
- $507 – $1,088
Fire risk 4/10 · Minor
- Est. fire insurance / yr
- $916 – $1,700
Heat risk 8/10 · Major
- Hot days now (above 107°F)
- 7 days/yr
- Hot days in 30 yrs
- 20 days/yr
Wind risk 8/10 · Major
- Chance of severe wind over 30 yrs
- 80.0%
Air-quality risk 4/10 · Minor
- Unhealthy air days now
- 4 days/yr
- Unhealthy air days in 30 yrs
- 5 days/yr
Risk factors via First Street. Map © Google.
Why this score? — see what drove the D- grade
The composite is a weighted blend of 9 inputs, each scored 0–100. Each bar is that input's sub-score; the figure is the points it added to the 100-point composite (weight × sub-score).
- Cash flow +15.7/30.0
- DSCR +4.8/10.0
- 1% rule +3.6/10.0
- Rent growth +3.2/5.0
- Livability +3.2/5.0
- Condition / age +2.5/5.0
- Schools +1.7/10.0
- ARV discount +1.0/15.0
- Appreciation +0.0/10.0
$179,900
🖨 Deal sheet (PDF) 📄 Offer letter ✓ Due diligence
Listing remarks MLS
SINGLE FAMILY HOME LOOKING FOR A NEW OWNER! Don't miss your opportunity to become the new owner of this 3 bed/2 bath home! Features include a spacious living room with a warm fireplace and tons of cabinetry in the eat-in kitchen. The bedrooms provide enough space for all your bedroom furniture and tub/shower combinations in the baths. Enjoy grilling out on the weekends on the patio when the weather is nice. DON'T DELAY-BUY TODAY! REO PROPERTY-BANK OWNED. PROPERTY SOLD AS IS. The Listing Broker & Seller assume no responsibility & make no guarantees, warranties or representations as to accuracy of the property information or photographs. Buyer to turn on Utilities for INSPECTIONS.
Key facts
- New appliances
- Updated kitchen
- New laminate floors
Tags
Property features AI
Exterior
- Parking: Attached garage with 2 spaces
- Utilities: Electricity available; Propane; Public water; Public sewer
- Home design: Single-story home
- Construction: Brick construction; Slab foundation
- Exterior features: Fully fenced yard; Patio; City lot with mature trees; Lot dimensions approximately 65 x 156.7
Interior
- Kitchen: Dishwasher; Electric cooktop; Electric oven; Disposal
- Bedrooms: Bedrooms located on the first floor
- Flooring: Laminate flooring; Tile flooring
- Bathrooms: 2 full bathrooms
- Heating & cooling: Central heating (gas); Central air conditioning; Ceiling fans; Electric cooling components
- Interior features: Blinds on windows; Linen closet; Vaulted ceiling(s); Window treatments
- Laundry & utility: Gas water heater
Neighborhood map
What this means for you Summary
Snapshot
- This is a 3-bed/2.0-bath single-family listed at $180k.
Deal economics
- At list price, monthly cash flow is $78 ($932/yr) — positive.
- The deal already cash-flows at list — no discount required.
- To meet the 1% rule (rent ≥ 1% of price), the offer needs to be $154k (14.3% below list).
- Recommended offer: $154k (14.3% below list) — sets the bar for 1% rule.
Location & tenants
- Location reads 65/100 on livability (#138 in AL) — a middle-class / working-renter tenant base. Strengths: cost of living A+, housing A+; Watch: employment D, crime F, amenities D-.
- Montgomery County (urban): math 9% / reading 31% proficiency, ranked #106 of 129 in AL (top 82%) — low school quality limits family demand, transient renter base, plan for 1-2y turnover; 70% free/reduced lunch — lower-income household profile, screen leases tightly.
- Zoned schools: Wares Ferry Elementary School (math 2% / reading 22%, grade F, #536 of 627 statewide, top 88%, 372 students, 73% FRL); Lee High School (math 2% / reading 8%, grade F, #276 of 305 statewide, top 95%, 1,374 students, 86% FRL).
- Market conditions: Rents rising (+3.0%/yr); 409 active listings in the ZIP; 35 comparable units currently listed for rent nearby; rentals at typical pace (median 23d on market — plan ~3-4 weeks tenant-placement turnaround); 40% of comp listings sitting > 30 days — soft ceiling on asking rent; 460 units permitted in Montgomery County in 2024 (37 in 5+ unit buildings).
Forward outlook
- Local home prices are declining (-3.0%/yr); year-one equity from $1k of loan paydown is wiped out by about $5k of value loss. Plan a longer hold.
- Montgomery County population projected to shrink 8% by 2050 — rents likely to lag national; underwrite the cash flow, not the appreciation.
Negotiation context
- It's been on market 56 days — a 3% lower offer ($175k) is reasonable based on typical stale-listing flexibility.
- 11 sale attempts since 29y ago with the ask held roughly flat each time — persistent listings suggest the price (not the market) is what's stuck; bring a comps-based counter.
Risks & watch-outs
- Climate carrying-cost: severe wind risk, 80% chance of damaging wind over 30y; extreme-heat days projected 7→20/yr by 2055 (HVAC capex compounding) — expect insurance premiums to compound above CPI over the hold.
Questions for the listing agent
- It's been on market 56 days. Have you received any prior offers? Is the seller open to a 14% concession, seller financing, or rate buy-down credit?
- Built in 1978 — when were the roof, HVAC, electrical panel, plumbing, and water heater last replaced?
- Is there a deadline driving the sale (1031 exchange, divorce, estate, relocation)? That informs how much negotiation room exists.
- Crime grade is F in this area — have there been break-ins, vandalism, or insurance claims at this property in the last 3 years? What carrier currently insures it and at what premium?
- The area grade is low — what's the realistic commute time and amenity access for the typical tenant pool here? Any planned neighborhood developments (good or bad) we should know about?
- What's the average days-on-market for RENTAL listings here right now (not sales)? A rising rental-DOM trend means longer vacancies and softer asking-rent achievability than the comps imply.
- What's the recent tenant-quality profile in this submarket — average credit score on applications, eviction rate, late-payment / NSF rate, and stable-employment percentage? A property-management company in the area should have these aggregated.
- How much new for-sale + rental construction is in the pipeline within 1–3 miles? Heavy new supply typically softens prices + rents 12–24 months out; constrained supply supports both.
Investment metrics
- 1% rule
- 0.86% ✗
- Cap rate
- 6.81%
- Cash-on-cash
- 1.85%
- DSCR
- 1.08
- GRM
- 9.7
CMA / ARV
- ARV (on-the-fly)
- $157,320
- Comps found
- 12
Show comp detail 12 sales within ~0.75 mi
| Address | Dist | Beds/Ba | Sqft | Sold | Price | $/sf | Match |
|---|---|---|---|---|---|---|---|
| 576 Dunbarton Rd | 0.45mi | 3/2.0 | 1,355 (-1%) | 4mo | $152,000 | $112 | 74 |
| 5791 Darien Dr | 0.27mi | 3/2.0 | 1,473 (+8%) | 1mo | $153,000 | $104 | 74 |
| 5757 Sweet Mdw | 0.46mi | 3/2.0 | 1,395 (+2%) | 3mo | $172,500 | $124 | 73 |
| 5737 Darien Dr | 0.22mi | 3/2.0 | 1,511 (+10%) | 3mo | $172,000 | $114 | 70 |
| 728 Amity Ln | 0.13mi | 4/2.0 (+1) | 1,218 (-11%) | 2mo | $140,500 | $115 | 69 |
| 5728 Sweet Meadow Dr | 0.42mi | 3/2.0 | 1,477 (+8%) | 1mo | $181,400 | $123 | 67 |
| 1202 Sweetwood Ct | 0.60mi | 3/2.0 | 1,413 (+3%) | 2mo | $163,000 | $115 | 65 |
| 6265 Wares Ferry Rd | 0.74mi | 3/2.0 | 1,336 (-2%) | 1mo | $141,000 | $106 | 61 |
| 6120 Hinchcliff Rd | 0.74mi | 3/2.0 | 1,350 (-1%) | 3mo | $159,000 | $118 | 61 |
| 6429 Sandy Ridge Curv | 0.61mi | 3/2.0 | 1,557 (+14%) | 4mo | $180,000 | $116 | 45 |
| 426 Stroll Dr | 0.73mi | 3/1.5 | 1,226 (-10%) | 4mo | $137,500 | $112 | 43 |
| 6241 Wares Ferry Rd | 0.70mi | 3/2.0 | 1,555 (+14%) | 5mo | $153,000 | $98 | 40 |
Match score weights: distance 35% · size 25% · config 20% · recency 20%. Top-matched comps best support the ARV.
Projected returns pro-forma
-3.0% appreciation · 2.99% rent growth · sell at horizon
- IRR
- -13.4%
- Equity multiple
- 0.52×
- Total profit
- $-24,259
- Equity at exit
- $26,824
- IRR
- -4.5%
- Equity multiple
- 0.70×
- Total profit
- $-14,978
- Equity at exit
- $15,554
Cash invested: $50,372 (down + closing). Projections, not guarantees.
Landlord ↔ Tenant lean methodology
- Overall (STATE)
- 90 Strongly Landlord-Friendly
- State Alabama
- 90 Strongly Landlord-Friendly · R+15
- County
- — inherits STATE
- City
- — inherits STATE
ZIP-level market 36117
- Home prices YoY
- -20.0%
- Rents YoY
- 3.0%
- Active inventory
- 409
- Price-to-rent
- 9.7×
Monthly cashflow live
- Estimated rent
- $1,542 high interval (Pro) →
- Mortgage (P&I)
- −$943
- Tax from tax record
- −$122 /mo · $1,468/yr
- Insurance
- −$75
- HOA
- −$0
- Vacancy / Maint / Mgmt
- −$324
- Net cashflow
- $78
Break-even live
Sensitivity live
| Price | -10% $180 | -5% $129 | +0% $78 | +5% $27 | +10% $-24 |
|---|---|---|---|---|---|
| Rent | -10% $-44 | -5% $17 | +0% $78 | +5% $139 | +10% $200 |
| Rate | -1.0pp $168 | -0.5pp $123 | base $78 | +0.5pp $31 | +1.0pp $-16 |
UW: 25.0% down · 7.5% · 30yr · 1.5% tax · 5.0% vac · 8.0% maint · 8.0% mgmt
Financing live
Cash to close
- Down payment
- $44,975
- Closing costs
- $5,397
- Reserves months
- —
- Total cash needed
- —
Loan-product check · same deal, 3 products live
Conventional
25% down · 7.5% · 30yr
- Down + closing
- —
- Monthly P&I
- —
- Monthly cashflow
- —
- DSCR
- —
- Eligible?
- —
Personal DTI + credit; lowest rate.
DSCR
20% down · 8.5% · 30yr
- Down + closing
- —
- Monthly P&I
- —
- Monthly cashflow
- —
- DSCR
- —
- Eligible?
- —
No personal income docs; deal must DSCR.
Hard money
10% down · 12.0% · 12mo
- Down + closing
- —
- Monthly P&I
- —
- Monthly cashflow
- —
- DSCR
- —
- Eligible?
- —
Short-term bridge; refi at stabilization.
Rent comps 35 comps
| Address | Beds | Baths | Sqft | Rent | $/sqft | DOM | Units | Dist |
|---|---|---|---|---|---|---|---|---|
| 728 Amity Ln Montgomery, AL | 4.0 | 2.0 | 1218 | $1,700 | $1.40 | 15d | 1 | 0.15mi |
| 713 Amity Ln Montgomery, AL | 4.0 | 2.0 | 1696 | $1,900 | $1.12 | 45d | 1 | 0.18mi |
| 5805 Hyde Park Dr Montgomery, AL | 3.0 | 2.0 | 1757 | $1,511 | $0.86 | 23d | 1 | 0.31mi |
| 5712 Roxboro Dr Montgomery, AL | 4.0 | 2.0 | 1544 | $1,450 | $0.94 | 23d | 1 | 0.38mi |
| 760 N Burbank Dr Montgomery, AL | 3.0 | 2.0 | 1102 | $1,400 | $1.27 | 45d | 1 | 0.43mi |
| 5735 Sweet Meadow Dr Montgomery, AL | 3.0 | 2.0 | 1413 | $1,525 | $1.08 | 45d | 1 | 0.46mi |
| 516 Lawndale Ln Montgomery, AL | 3.0 | 1.0 | 1125 | $1,150 | $1.02 | 45d | 1 | 0.56mi |
| 535 Lawndale Ln Montgomery, AL | 4.0 | 1.5 | 1260 | $1,100 | $0.87 | 15d | 1 | 0.58mi |
| 633 Groveland Dr Montgomery, AL | 3.0 | 2.0 | 1424 | $1,200 | $0.84 | 45d | 1 | 0.68mi |
| 6265 Wares Ferry Rd Montgomery, AL | 3.0 | 2.0 | 1336 | $1,600 | $1.20 | 15d | 1 | 0.76mi |
| 605 Plantation Way Montgomery, AL | 4.0 | 2.0 | 1519 | $1,200 | $0.79 | 23d | 1 | 0.77mi |
| 323 N Burbank Dr Montgomery, AL | 4.0 | 2.0 | 1584 | $1,381 | $0.87 | 15d | 1 | 0.78mi |
| 457 Mulligan Dr Montgomery, AL | 3.0 | 2.0 | 1344 | $1,335 | $0.99 | 45d | 1 | 0.78mi |
| 438 Mulligan Dr Montgomery, AL | 4.0 | 2.0 | 1232 | $1,500 | $1.22 | 45d | 1 | 0.81mi |
| 706 Placid Dr Montgomery, AL | 3.0 | 1.5 | 1120 | $1,400 | $1.25 | 15d | 1 | 0.85mi |
| 6061 Karen Valley Cv Montgomery, AL | 3.0 | 2.0 | 1509 | $1,500 | $0.99 | 23d | 1 | 0.86mi |
| 523 Placid Dr Montgomery, AL | 3.0 | 2.0 | 1122 | $1,195 | $1.07 | 45d | 1 | 0.89mi |
| 538 Hollow Wood Rd Montgomery, AL | 2.0 | 2.0 | 1053 | $1,100 | $1.04 | 45d | 1 | 0.90mi |
| 564 Glade Park Loop Unit 1043856P Montgomery, AL | 4.0 | 2.0 | 1496 | $2,736 | $1.83 | 15d | 1 | 0.92mi |
| 428 Fieldbrook Dr Montgomery, AL | 3.0 | 1.5 | 1440 | $995 | $0.69 | 23d | 1 | 0.93mi |
| 4732 Retreat Rd Montgomery, AL | 2.0 | 2.0 | 1034 | $995 | $0.96 | 23d | 1 | 0.94mi |
| 6320 Burbank Crossing Loop Montgomery, AL | 3.0 | 2.0 | 1238 | $1,600 | $1.29 | 45d | 1 | 0.95mi |
| 6272 Deerwood Dr Montgomery, AL | 3.0 | 2.0 | 1754 | $1,875 | $1.07 | 23d | 1 | 0.96mi |
| 6272 Deerwood Dr Montgomery, AL | 3.0 | 2.0 | 1754 | $1,785 | $1.02 | 15d | 1 | 0.96mi |
| 6411 Pinebrook Dr Montgomery, AL | 3.0 | 1.5 | 1120 | $1,095 | $0.98 | 45d | 1 | 0.97mi |
| 6409 Deerwood Pl Montgomery, AL | 3.0 | 2.0 | 1504 | $1,711 | $1.14 | 15d | 1 | 0.98mi |
| 241 Kroy Dr Montgomery, AL | 4.0 | 2.0 | 1450 | $1,195 | $0.82 | 45d | 1 | 1.00mi |
| 6265 Nature Dr Montgomery, AL | 3.0 | 2.0 | 1400 | $1,050 | $0.75 | 15d | 1 | 1.15mi |
| 6005 Tamarack Dr Montgomery, AL | 4.0 | 2.0 | 1617 | $1,650 | $1.02 | 45d | 1 | 1.15mi |
| 6121 Boardwalk Blvd Montgomery, AL | 3.0 | 2.0 | 1155 | $1,075 | $0.93 | 23d | 1 | 1.26mi |
| 6121 Boardwalk Blvd Montgomery, AL | 1.0–3.0 | 1.0–2.0 | 877 | $1,075 | $1.23 | 15d | 4 | 1.26mi |
| 185 Eastdale Rd S Montgomery, AL | 1.0–2.0 | 1.0–2.0 | 846 | $1,100 | $1.30 | 23d | 4 | 1.37mi |
| 203 Eastdale Rd S Montgomery, AL | 1.0–3.0 | 1.0–2.0 | 931 | $1,290 | $1.39 | 15d | 13 | 1.45mi |
| 4536 Wake Forest Dr Montgomery, AL | 3.0 | 2.0 | 1244 | $1,250 | $1.00 | 45d | 1 | 1.48mi |
| 101 S Burbank Dr Montgomery, AL | 1.0–2.0 | 1.0–1.5 | 850 | $997 | $1.17 | 15d | 5 | 1.48mi |
Listing history 21 events
-
2026-05-01soldstatus $176,500
-
2026-04-29status Pending
-
2026-03-15price $179,900
-
2026-03-04$184,900 Active
-
2024-09-12historical $1,050
-
2024-09-12$1,050
-
2024-06-08historical $1,025
-
2024-06-08$1,025
-
2015-07-27$88,900
-
2015-04-30soldstatus $51,504 699-char remark
Show marketing remark (699 chars)
SINGLE FAMILY HOME LOOKING FOR A NEW OWNER! Don't miss your opportunity to become the new owner of this 3 bed/2 bath home! Features include a spacious living room with a warm fireplace and tons of cabinetry in the eat-in kitchen. The bedrooms provide enough space for all your bedroom furniture and tub/shower combinations in the baths. Enjoy grilling out on the weekends on the patio when the weather is nice. DON'T DELAY-BUY TODAY! REO PROPERTY-BANK OWNED. PROPERTY SOLD AS IS. The Listing Broker & Seller assume no responsibility & make no guarantees, warranties or representations as to accuracy of the property information or photographs. Buyer to turn on Utilities for INSPECTIONS.
-
2015-03-02$42,400 699-char remark
Show marketing remark (699 chars)
SINGLE FAMILY HOME LOOKING FOR A NEW OWNER! Don't miss your opportunity to become the new owner of this 3 bed/2 bath home! Features include a spacious living room with a warm fireplace and tons of cabinetry in the eat-in kitchen. The bedrooms provide enough space for all your bedroom furniture and tub/shower combinations in the baths. Enjoy grilling out on the weekends on the patio when the weather is nice. DON'T DELAY-BUY TODAY! REO PROPERTY-BANK OWNED. PROPERTY SOLD AS IS. The Listing Broker & Seller assume no responsibility & make no guarantees, warranties or representations as to accuracy of the property information or photographs. Buyer to turn on Utilities for INSPECTIONS.
-
2012-12-11$85,000
-
2006-10-27soldstatus $99,900
-
2006-09-19$99,900
-
2004-07-15soldstatus $91,000
-
2004-05-06$89,900
-
2000-03-06soldstatus $75,900
-
1999-08-27$76,900
-
1997-10-07$79,990
-
1997-05-23soldstatus $78,459
-
1997-03-03$79,990
ⓘ Source: listings_history table (triggers on properties + properties_extension) + one-shot
backfill from property_details.listing_events for pre-trigger history.
Tax reassessment forecast AL · Resets to sale price
- Current annual tax
- $1,468 · $122/mo
- Projected year-2 tax
- $1,468 · $122/mo
- Expected delta
- $0/yr ($0/mo · 0.0%)
ⓘ Screening estimate from a state-policy table — verify with the county assessor before closing.
Climate risk First Street
- Flood 1/10 Low FEMA zone X (unshaded) · 0% chance over 30 yrs
- Wildfire 4/10 Moderate
- Heat 8/10 Severe 7 d/yr ≥107°F today · 20 d/yr by 30 yrs out
- Wind 8/10 Severe 80% chance of damaging wind over 30 yrs
- Air quality 4/10 Moderate 4 unhealthy d/yr today · 5 by 30 yrs out
Nearby sold comps map
Loading sold comps map…
Walkable amenities ~0.75 mi
Loading nearby amenities…
Taxation est. · year 1
- Rental income
- $18,507
- − Mortgage interest
- −$10,077
- − Property taxes
- −$1,468
- − Insurance
- −$900
- − Repairs & maintenance
- −$1,481
- − Management
- −$1,481
- − Depreciation
- −$5,233
- Taxable loss
- −$2,132
- Est. tax savings @ 24.0%
- +$512
- After-tax cash flow
- $1,444/yr
For passive investors: Depreciation is non-cash, so a rental often shows a tax loss while cash-flowing — sheltering income. Rental losses are passive: they offset passive income freely, and up to $25,000/yr can offset ordinary (W-2) income if you actively participate and your MAGI is under $100k (phasing out to $0 by $150k); unused losses carry forward. On sale, claimed depreciation is recaptured at up to 25%, and gains may owe capital-gains tax (a 1031 exchange can defer both). Figures are a year-1 estimate at your 24.0% rate — not tax advice; consult a CPA.
Schools (NCES district)
- District
- Montgomery County
- NCES district ID
- 0102430
- Math proficiency
- 9% ▼ -21.00%
- Reading proficiency
- 31% ▼ -1.00%
- Median HH income
- $43,902
- Composite
- 17.24/100
- National rank
- #9093
- State rank
- #106 of 129 in AL
Livability — Montgomery
- Score
- 65/100
- State rank
- #138
- US rank
- #13416
Category grades
Schools grade is shown separately in the Schools card above.
Census & demographics
- Census place
- Montgomery, AL
- County
- Montgomery County · 190,016 people
- City population
- 175,913
- Metro
- Montgomery, AL
- Population (ZIP)
- 53,172
- Household income
- $74,720
- Rent vs Own
- Severe rent burden
- 1742.0
Population outlook (Montgomery County) Hauer SSP2
- Today (2025)
- 224,008 people
- By 2030
- 221,460 · -1.1%
- By 2040
- 214,179 · -4.4%
- By 2050
- 204,912 · -8.5%
- By 2075
- 177,821 · -20.6%
- By 2100
- 145,134 · -35.2%
Race, ethnicity, and origin ACS 2023
- Neighborhood character
- Diverse neighborhood (Simpson 0.60)
- Race & ethnicity
- Black 53% White 34% Asian 8% Two or more races 3% Hispanic / Latino 3%
- Common ancestry
- Italian 1% Slovak 1% Lithuanian 1%
- Foreign-born
- 9% · South Korea, Canada, China
- Languages at home
- 90% English-only · Korean 4% Spanish 3% Other Indo-European 1%
Political lean MEDSL · Montgomery
- 2024 margin
- Solid D (+30.7) · D 64.8% · R 34.1% · Other 1.1%
- 2008→2024 swing
- +11.5pp toward D · 2008: 19.2pp · 2024: 30.7pp
- All cycles
- 2024: D+30.7 2020: D+31.5 2016: D+26.2 2012: D+24.3 2008: D+19.2
Not yet ingested
- Civics
- —
Market trends
- HPI YoY
- ▼ -37.24%
- Current HPI
- 148.7728
- Rent YoY
- ▲ 2.99%
- Metro
- Montgomery, AL
- State GDP YoY
- ▲ 2.94%
- F500 in state
- 4
Industry mix (Fortune 500 HQ in AL)
| Industry | F500 HQs | Revenue |
|---|---|---|
| Financial Services | 1 | $8B |
|
||
| Healthcare | 1 | $5B |
|
||
Price history
+120.7% since first listed21 events — show timeline
- 2026-05-01 Sold (Public Records) $176,500 Public Records
- 2026-04-29 Pending — MAAR
- 2026-03-15 Price Changed $179,900 MAAR
- 2026-03-04 Listed $184,900 MAAR
- 2024-09-12 Rental Removed $1,050 PROPERTYWARE
- 2024-09-12 Listed for Rent $1,050 PROPERTYWARE
- 2024-06-08 Rental Removed $1,025 PROPERTYWARE
- 2024-06-08 Listed for Rent $1,025 PROPERTYWARE
- 2015-07-27 Listed $88,900 MAAR
- 2015-04-30 Sold (MLS) $51,504 MAAR
- 2015-03-02 Listed $42,400 MAAR
- 2012-12-11 Listed $85,000 MAAR
- 2006-10-27 Sold (MLS) $99,900 MAAR
- 2006-09-19 Listed $99,900 MAAR
- 2004-07-15 Sold (MLS) $91,000 MAAR
- 2004-05-06 Listed $89,900 MAAR
- 2000-03-06 Sold (MLS) $75,900 MAAR
- 1999-08-27 Listed $76,900 MAAR
- 1997-10-07 Listed $79,990 MAAR
- 1997-05-23 Sold (MLS) $78,459 MAAR
- 1997-03-03 Listed $79,990 MAAR
Property tax history
+15.8%/yrLatest (2025): $1,468 · +2.4% YoY. Source: county tax records.
Cash-flow waterfall
monthlySold comps — $/sqft
last 12 mo · ≤1 miLoading sold comps…