9113 Michael Cir #9 · Lely Resort, FL
Flood risk 8/10 · Major
- FEMA flood zone
- X (shaded)
- Chance of flooding over 30 yrs
- 0.97%
- Est. flood insurance / yr
- $507 – $1,088
Fire risk 3/10 · Minor
- Est. fire insurance / yr
- $947 – $1,759
Heat risk 10/10 · Severe
- Hot days now (above 108°F)
- 7 days/yr
- Hot days in 30 yrs
- 29 days/yr
Wind risk 10/10 · Severe
- Chance of severe wind over 30 yrs
- 99.0%
Air-quality risk 2/10 · Minimal
- Unhealthy air days now
- 2 days/yr
- Unhealthy air days in 30 yrs
- 2 days/yr
Risk factors via First Street. Map © Google.
Why this score? — see what drove the C grade
The composite is a weighted blend of 9 inputs, each scored 0–100. Each bar is that input's sub-score; the figure is the points it added to the 100-point composite (weight × sub-score).
- Cash flow +22.5/30.0
- 1% rule +7.8/10.0
- ARV discount +7.5/15.0
- DSCR +7.2/10.0
- Schools +5.0/10.0
- Rent growth +3.9/5.0
- Livability +3.1/5.0
- Condition / age +2.5/5.0
- Appreciation +0.0/10.0
$349,900
🖨 Deal sheet (PDF) 📄 Offer letter ✓ Due diligence
Listing remarks
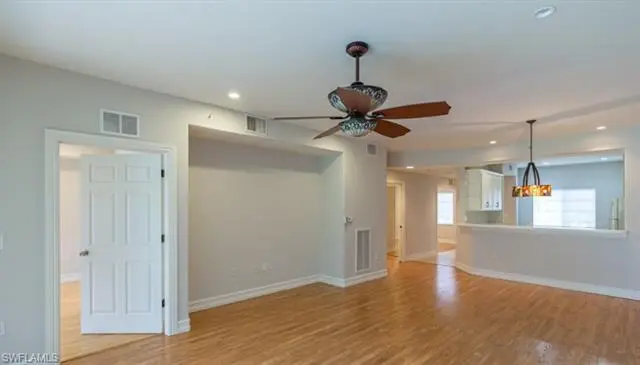
* * BEAUTIFUL 2 Bed/2 Bath CONDO * * LELY RESORT This beautiful 2 Bedrooms, 2 Bath condominium, and 1 car detached garage, features an open floor plan with a large living/dining area, generous kitchen, and breakfast bar. Wonderful Golf course & Lake view from the private screened lanai. The large community pool just steps away. Lely club offers 3 swimming pools, 13 tennis courts, a restaurant, a tiki bar, and much more. Just a short drive to downtown Naples and to both Naples & Marco Island beaches.
Key facts
- Golf course view
- Three swimming pools
- Lake view
Tags
Property features AI
Finance
- Other: 1 unit per floor, 12 units in building, 120 units in complex; Possession at closing
- HOA & community: Quarterly condo fee; HOA covers cable, insurance, management, exterior pest control, street lights and maintenance, trash removal, and water; Community amenities include clubhouse, community pool, cabana, bike and jog path, bike storage, dog park, golf course, sidewalks, and underground utilities; Managed by developer; Community type: golf course; Total annual recurring HOA fees: $7,920; Total one-time fees: $100
Exterior
- Parking: Detached 1-car garage
- Security: Fire sprinkler system; Smoke detectors
- Utilities: Central water; Central sewer; Electric power
- Home design: Residential property; Carriage/coach style; Low-rise (1-3 stories); Rear exposure faces southwest; Located in Lely Resort (Peridot at Sunstone)
- Construction: Concrete block construction; Tile roof; Built in 2005
- Exterior features: Deck; Cul-de-sac lot; Golf course view; Central irrigation
Interior
- Kitchen: Dishwasher; Range; Refrigerator; Microwave; Pantry; Eat-in kitchen
- Bedrooms: 2 bedrooms
- Flooring: Carpet; Tile
- Bathrooms: 2 full bathrooms; Master bathroom with shower only
- Heating & cooling: Central electric heat; Central electric cooling; Ceiling fans; Cable available
- Interior features: Built-in cabinets; Cable prewire; Fire sprinkler; High-speed internet available; Pantry; Smoke detectors; Volume ceilings; Walk-in closet; Split bedroom floor plan; Dining area in living room; Eat-in kitchen; Family room; Laundry in residence; Unfurnished
- Laundry & utility: Washer; Dryer; Automatic garage door opener
Neighborhood map
What this means for you Summary
Snapshot
- This is a 2-bed/2.0-bath condo listed at $350k.
Deal economics
- At list price, monthly cash flow is $523 ($6k/yr) — positive.
- The deal already cash-flows at list — no discount required.
- Meets the 1% rule at list price ($4k rent vs $350k).
- Recommended offer: $329k (6.0% below list) — sets the bar for market timing.
Location & tenants
- Location reads 61/100 on livability (#786 in FL) — a middle-class / working-renter tenant base. Strengths: crime A+, employment A-; Watch: health & safety D, schools F, amenities F.
- Collier (suburban): math 60% / reading 56% proficiency, ranked #16 of 73 in FL (top 22%) — acceptable for families but not a draw, mixed tenant base, ~2y average lease.
- Market conditions: Rents rising fast (+5.6%/yr); 598 active listings in the ZIP; 40 comparable units currently listed for rent nearby; rentals at typical pace (median 25d on market — plan ~3-4 weeks tenant-placement turnaround); solid renter incomes; 3,520 units permitted in Collier County in 2024 (959 in 5+ unit buildings).
- At $4,493/mo this rent would consume 66% of the median local household income ($82k/yr) (locally 954% of renters already pay >50% of income on rent) — very limited rent-growth headroom before tenants either downsize or default.
Forward outlook
- Local home prices are declining (-3.0%/yr); year-one equity from $2k of loan paydown is wiped out by about $10k of value loss. Plan a longer hold.
- Collier County population projected at +30% by 2050 — long-run rental-demand tailwind backs the buy-and-hold thesis.
- At projected returns (-3.0% appreciation + 5.6% rent growth), your $98k cash investment doubles in ~10 years — after that, you're playing with house money.
Negotiation context
- It's been on market 89 days — a 6% lower offer ($329k) is reasonable based on typical stale-listing flexibility.
Risks & watch-outs
- Watch-outs: flood insurance adds $66/mo.
- Climate carrying-cost: severe flood risk; severe wind risk, 99% chance of damaging wind over 30y; extreme-heat days projected 7→29/yr by 2055 (HVAC capex compounding) — expect insurance premiums to compound above CPI over the hold.
Questions for the listing agent
- It's been on market 89 days. Have you received any prior offers? Is the seller open to a 6% concession, seller financing, or rate buy-down credit?
- What's the actual annual flood-insurance premium (NFIP or private), and is the property in a SFHA with mandatory coverage?
- What does the HOA fee cover, when was the last increase, and are there any pending special assessments or reserve-fund shortfalls?
- Any open or pending special assessments — roof, HVAC, plumbing, elevator, façade? What's the per-unit balance and payoff schedule, and is the seller paying it off at close or rolling it to the buyer?
- Why hasn't it sold? Are there any deal-killer items the seller is aware of (foundation, flood, title, zoning, code violations)?
- Is there a deadline driving the sale (1031 exchange, divorce, estate, relocation)? That informs how much negotiation room exists.
- Schools are F-rated, which usually means shorter tenancies and higher turnover. Who's the typical renter profile here, and what's been the actual vacancy rate?
- What's the average days-on-market for RENTAL listings here right now (not sales)? A rising rental-DOM trend means longer vacancies and softer asking-rent achievability than the comps imply.
- What's the recent tenant-quality profile in this submarket — average credit score on applications, eviction rate, late-payment / NSF rate, and stable-employment percentage? A property-management company in the area should have these aggregated.
- How much new apartment / multifamily construction is in the pipeline within 1–3 miles? Heavy new supply (>2% of stock underway) typically softens rents 12–24 months out; light construction supports rent growth.
Investment metrics
- 1% rule
- 1.28% ✓
- Cap rate
- 8.31%
- Cash-on-cash
- 7.22%
- DSCR
- 1.32
- GRM
- 6.5
CMA / ARV
No comps found within radius.
Projected returns pro-forma
-3.0% appreciation · 5.59% rent growth · sell at horizon
- IRR
- -2.9%
- Equity multiple
- 0.89×
- Total profit
- $-10,950
- Equity at exit
- $52,171
- IRR
- 10.0%
- Equity multiple
- 1.89×
- Total profit
- $87,108
- Equity at exit
- $30,253
Cash invested: $97,972 (down + closing). Projections, not guarantees.
Landlord ↔ Tenant lean methodology
- Overall (STATE)
- 87 Strongly Landlord-Friendly
- State Florida
- 87 Strongly Landlord-Friendly · R+3
- County
- — inherits STATE
- City
- — inherits STATE
ZIP-level market 34113
- Rents YoY
- 5.6%
- Active inventory
- 598
- Price-to-rent
- 6.5×
Monthly cashflow live
- Estimated rent
- $4,493 high interval (Pro) →
- Mortgage (P&I)
- −$1,835
- Tax from tax record
- −$319 /mo · $3,833/yr
- Insurance
- −$146
- Flood insurance flood zone
- −$66 /mo · $798/yr
- HOA
- −$660
- Vacancy / Maint / Mgmt
- −$943
- Net cashflow
- $523
Break-even live
Sensitivity live
| Price | -10% $721 | -5% $622 | +0% $523 | +5% $424 | +10% $325 |
|---|---|---|---|---|---|
| Rent | -10% $168 | -5% $345 | +0% $523 | +5% $700 | +10% $878 |
| Rate | -1.0pp $699 | -0.5pp $612 | base $523 | +0.5pp $432 | +1.0pp $340 |
UW: 25.0% down · 7.5% · 30yr · 1.5% tax · 5.0% vac · 8.0% maint · 8.0% mgmt
Financing live
Cash to close
- Down payment
- $87,475
- Closing costs
- $10,497
- Reserves months
- —
- Total cash needed
- —
Loan-product check · same deal, 3 products live
Conventional
25% down · 7.5% · 30yr
- Down + closing
- —
- Monthly P&I
- —
- Monthly cashflow
- —
- DSCR
- —
- Eligible?
- —
Personal DTI + credit; lowest rate.
DSCR
20% down · 8.5% · 30yr
- Down + closing
- —
- Monthly P&I
- —
- Monthly cashflow
- —
- DSCR
- —
- Eligible?
- —
No personal income docs; deal must DSCR.
Hard money
10% down · 12.0% · 12mo
- Down + closing
- —
- Monthly P&I
- —
- Monthly cashflow
- —
- DSCR
- —
- Eligible?
- —
Short-term bridge; refi at stabilization.
Rent comps 40 comps
| Address | Beds | Baths | Sqft | Rent | $/sqft | DOM | Units | Dist |
|---|---|---|---|---|---|---|---|---|
| 9022 Michael Cir Unit 2-205 Naples, FL | 2.0 | 2.0 | 1450 | $3,500 | $2.41 | 24d | 1 | 0.10mi |
| 8161 Twelve Oaks Cir #512 Naples, FL | 2.0 | 2.0 | 1066 | $5,000 | $4.69 | 24d | 1 | 0.49mi |
| 24 Cheyenne Trl Naples, FL | 2.0 | 2.0 | 888 | $3,500 | $3.94 | 15d | 1 | 0.66mi |
| 9165 Celeste Dr Unit 3-303 Naples, FL | 2.0 | 2.0 | 1000 | $6,500 | $6.50 | 24d | 1 | 0.71mi |
| 9175 Celeste Dr Unit 105 Naples, FL | 2.0 | 2.0 | 1000 | $2,000 | $2.00 | 24d | 1 | 0.71mi |
| 9187 Celeste Dr Unit 1073494P Naples, FL | 2.0 | 2.0 | 1399 | $2,979 | $2.13 | 15d | 1 | 0.72mi |
| 9092 Chula Vista St #11003 Naples, FL | 2.0 | 2.0 | 1404 | $6,850 | $4.88 | 24d | 1 | 0.82mi |
| 9088 Chula Vista St Unit 108-3 Naples, FL | 2.0 | 2.0 | 1404 | $5,700 | $4.06 | 24d | 1 | 0.82mi |
| 9115 Capistrano St S #8207 Naples, FL | 2.0 | 2.5 | 1494 | $6,000 | $4.02 | 24d | 1 | 0.86mi |
| 11496 Sumter Grove Cir Naples, FL | 1.0–2.0 | 1.0–2.0 | 1067 | $2,134 | $2.00 | 15d | 14 | 0.86mi |
| 9111 Capistrano St S #8303 Naples, FL | 2.0 | 2.5 | 1432 | $7,500 | $5.24 | 24d | 1 | 0.88mi |
| 6590 Beach Resort Dr Unit 305 Naples, FL | 2.0 | 2.0 | 1351 | $4,500 | $3.33 | 15d | 1 | 0.91mi |
| 9081 Albion Ln S #6505 Naples, FL | 2.0 | 2.0 | 1225 | $7,500 | $6.12 | 24d | 1 | 0.95mi |
| 9082 Capistrano St N Unit 48-5 Naples, FL | 2.0 | 2.0 | 1227 | $6,500 | $5.30 | 24d | 1 | 1.00mi |
| 7955 Mahogany Run Ln #515 Naples, FL | 2.0 | 2.0 | 1244 | $8,925 | $7.17 | 24d | 1 | 1.00mi |
| 7955 Mahogany Run Ln Unit 1504173P Naples, FL | 3.0 | 2.0 | 1442 | $5,840 | $4.05 | 15d | 1 | 1.00mi |
| 9071 Albion Ln N #5706 Naples, FL | 2.0 | 2.5 | 1441 | $2,200 | $1.53 | 24d | 1 | 1.00mi |
| 7940 Mahogany Run Ln #623 Naples, FL | 2.0 | 2.0 | 1389 | $8,000 | $5.76 | 24d | 1 | 1.05mi |
| 7925 Mahogany Run Ln #924 Naples, FL | 2.0 | 2.0 | 1389 | $8,925 | $6.43 | 24d | 1 | 1.05mi |
| 7930 Mahogany Run Ln Unit 1504165P Naples, FL | 2.0 | 2.0 | 1237 | $4,053 | $3.28 | 15d | 1 | 1.07mi |
| 7930 Mahogany Run Ln Unit 1504168P Naples, FL | 2.0 | 2.0 | 1237 | $4,495 | $3.63 | 15d | 1 | 1.07mi |
| 7930 Mahogany Run Ln #826 Naples, FL | 3.0 | 2.0 | 1454 | $9,450 | $6.50 | 24d | 1 | 1.07mi |
| 7920 Mahogany Run Ln #1011 Naples, FL | 3.0 | 2.0 | 1454 | $10,395 | $7.15 | 24d | 1 | 1.08mi |
| 7895 Mahogany Run Ln Unit 1504163P Naples, FL | 2.0 | 2.0 | 1237 | $4,125 | $3.33 | 22d | 1 | 1.09mi |
| 7895 Mahogany Run Ln Naples, FL | 2.0–3.0 | 2.0 | 1339 | $2,850 | $2.13 | 15d | 3 | 1.09mi |
| 7870 Mahogany Run Ln #1713 Naples, FL | 2.0 | 2.0 | 1062 | $3,570 | $3.36 | 24d | 1 | 1.12mi |
| 9054 Capistrano St N #4003 Naples, FL | 2.0 | 2.0 | 1385 | $2,495 | $1.80 | 24d | 1 | 1.12mi |
| 8175 Celeste Dr Naples, FL | 2.0 | 2.0 | 1460 | $2,395 | $1.64 | 24d | 1 | 1.12mi |
| 8175 Celeste Dr #1230 Naples, FL | 2.0 | 2.0 | 1476 | $2,775 | $1.88 | 24d | 1 | 1.12mi |
| 7885 Mahogany Run Ln Unit 1504180P Naples, FL | 2.0 | 2.0 | 1237 | $2,915 | $2.36 | 22d | 1 | 1.13mi |
| 7880 Mahogany Run Ln Naples, FL | 2.0 | 2.0 | 1389 | $10,225 | $7.36 | 24d | 2 | 1.13mi |
| 8135 Celeste Dr #4218 Naples, FL | 2.0 | 2.0 | 1476 | $7,500 | $5.08 | 24d | 1 | 1.14mi |
| 6650 Beach Resort Dr Unit 908 Naples, FL | 2.0 | 2.0 | 1351 | $4,600 | $3.40 | 15d | 1 | 1.15mi |
| 1435 Santiago Cir #2003 Naples, FL | 3.0 | 2.5 | 1315 | $2,600 | $1.98 | 24d | 1 | 1.20mi |
| 6750 Beach Resort Dr #7 Naples, FL | 2.0 | 2.0 | 1351 | $3,900 | $2.89 | 24d | 1 | 1.21mi |
| 6750 Beach Resort Dr Naples, FL | 2.0 | 2.0 | 1351 | $3,200 | $2.37 | 15d | 2 | 1.21mi |
| 8986 Cambria Cir Unit 22 Naples, FL | 2.0 | 2.0 | 1404 | $6,000 | $4.27 | 24d | 1 | 1.22mi |
| 5296 Treetops Dr Unit 5296 Naples, FL | 2.0 | 2.0 | 866 | $1,495 | $1.73 | 24d | 1 | 1.24mi |
| 5395 Treetops Dr Unit I Naples, FL | 2.0 | 2.0 | 865 | $1,800 | $2.08 | 24d | 1 | 1.27mi |
| 5324 Treetops Dr Unit G-2 Naples, FL | 2.0 | 2.0 | 878 | $1,800 | $2.05 | 15d | 1 | 1.27mi |
HOA detail condo
- Monthly dues
- $660 · $7,920/yr
- Likely covers
- pool
- Assessments
- None detected in remarks — confirm with the listing agent.
Listing history 13 events
-
2026-06-21days on market $349,900 Active 89 DOM
-
2026-06-18days on market $349,900 Active 86 DOM
-
2026-06-17days on market $349,900 Active 85 DOM
-
2026-06-16days on market $349,900 Active 84 DOM
-
2026-06-15days on market $349,900 Active 83 DOM
-
2026-06-14days on market $349,900 Active 81 DOM
-
2026-06-10days on market $349,900 Active 78 DOM
-
2026-06-09days on market $349,900 Active 77 DOM
-
2026-06-08days on market $349,900 Active 76 DOM
-
2026-06-07days on market $349,900 Active 75 DOM
-
2026-06-03days on market $349,900 Active 71 DOM
-
2026-06-03remarks 513-char remark
-
2026-06-03$349,900 Active 70 DOM
ⓘ Source: listings_history table (triggers on properties + properties_extension) + one-shot
backfill from property_details.listing_events for pre-trigger history.
Tax reassessment forecast FL · Resets to sale price
- Current annual tax
- $3,833 · $319/mo
- Projected year-2 tax
- $3,833 · $319/mo
- Expected delta
- $0/yr ($0/mo · 0.0%)
ⓘ Screening estimate from a state-policy table — verify with the county assessor before closing.
Climate risk First Street
- Flood 8/10 Severe FEMA zone X (shaded) · 97% chance over 30 yrs
- Wildfire 3/10 Moderate
- Heat 10/10 Extreme 7 d/yr ≥108°F today · 29 d/yr by 30 yrs out
- Wind 10/10 Extreme 99% chance of damaging wind over 30 yrs
- Air quality 2/10 Low 2 unhealthy d/yr today · 2 by 30 yrs out
Nearby sold comps map
Loading sold comps map…
Walkable amenities ~0.75 mi
Loading nearby amenities…
Taxation est. · year 1
- Rental income
- $53,914
- − Mortgage interest
- −$19,600
- − Property taxes
- −$3,833
- − Insurance
- −$2,547
- − Repairs & maintenance
- −$4,313
- − Management
- −$4,313
- − HOA
- −$7,920
- − Depreciation
- −$10,179
- Taxable income
- $1,209
- Est. tax owed @ 24.0%
- −$290
- After-tax cash flow
- $5,983/yr
For passive investors: Depreciation is non-cash, so a rental often shows a tax loss while cash-flowing — sheltering income. Rental losses are passive: they offset passive income freely, and up to $25,000/yr can offset ordinary (W-2) income if you actively participate and your MAGI is under $100k (phasing out to $0 by $150k); unused losses carry forward. On sale, claimed depreciation is recaptured at up to 25%, and gains may owe capital-gains tax (a 1031 exchange can defer both). Figures are a year-1 estimate at your 24.0% rate — not tax advice; consult a CPA.
Schools (NCES district)
- District
- Collier
- NCES district ID
- 1200330
- Math proficiency
- 60% ▼ -4.00%
- Reading proficiency
- 56% ▼ -2.00%
- Median HH income
- $58,275
- Composite
- 50.23/100
- National rank
- #1892
- State rank
- #16 of 73 in FL
Livability — Lely Resort
- Score
- 61/100
- State rank
- #786
- US rank
- #17981
Category grades
Schools grade is shown separately in the Schools card above.
Census & demographics
- Census place
- Lely Resort, FL
- County
- Collier County · 396,295 people
- Metro
- Naples-Marco Island, FL
- Population (ZIP)
- 26,056
- Household income
- $81,674
- Rent vs Own
- Severe rent burden
- 954.0
Population outlook (Collier County) Hauer SSP2
- Today (2025)
- 420,858 people
- By 2030
- 450,054 · +6.9%
- By 2040
- 502,232 · +19.3%
- By 2050
- 544,932 · +29.5%
- By 2075
- 627,203 · +49.0%
- By 2100
- 659,015 · +56.6%
Race, ethnicity, and origin ACS 2023
- Neighborhood character
- Diverse neighborhood (Simpson 0.59)
- Race & ethnicity
- White 56% Hispanic / Latino 28% Black 12% Two or more races 11% Asian 2%
- Hispanic origin (detail)
- Mexican 17% Puerto Rican 3% Cuban 2%
- Common ancestry
- Hispanic 10% Romanian 3% Lithuanian 2%
- Foreign-born
- 26% · Canada, Jamaica, Vietnam
- Languages at home
- 63% English-only · Spanish 24% French/Haitian/Cajun 9% Other Indo-European 2%
Political lean MEDSL · Collier
- 2024 margin
- Solid R (+33.1) · D 33.1% · R 66.2%
- 2008→2024 swing
- -10.6pp toward R · 2008: -22.5pp · 2024: -33.1pp
- All cycles
- 2024: R+33.1 2020: R+24.7 2016: R+26.0 2012: R+30.1 2008: R+22.5
Not yet ingested
- Civics
- —
Market trends
- HPI YoY
- ▼ -194.86%
- Current HPI
- 279.4232
- Rent YoY
- ▲ 5.59%
- Metro
- Naples-Marco Island, FL
- State GDP YoY
- ▲ 3.28%
- F500 in state
- 36
Industry mix (Fortune 500 HQ in FL)
| Industry | F500 HQs | Revenue |
|---|---|---|
| Industrial Technology | 2 | $29B |
|
||
| Insurance | 2 | $17B |
|
||
| Retail | 1 | $60B |
|
||
| Technology Distribution | 1 | $58B |
|
||
| Homebuilding | 1 | $35B |
|
||
| Technology Manufacturing | 1 | $35B |
|
||
Price history
-30.0% since first listed5 events — show timeline
- 2026-03-24 Listed $349,900 NAPLESMLS
- 2005-06-07 Sold (Public Records) $339,900 Public Records
- 2003-06-11 Sold (Public Records) $1,216,200 Public Records
- 2001-07-18 Sold (Public Records) $500,000 Public Records
- 2001-07-18 Sold (Public Records) $500,000 Public Records
Property tax history
+7.8%/yrLatest (2025): $3,833 · +10.1% YoY. Source: county tax records.
Cash-flow waterfall
monthlySold comps — $/sqft
last 12 mo · ≤1 miLoading sold comps…