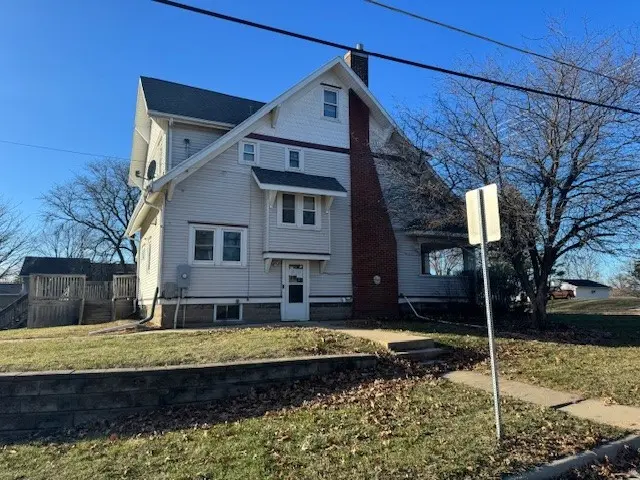
1233 Rainbow Dr · Cedar Falls, IA
Flood risk 1/10 · Minimal
- FEMA flood zone
- X (unshaded)
- Chance of flooding over 30 yrs
- 0.0%
- Est. flood insurance / yr
- $473 – $860
Fire risk 1/10 · Minimal
- Est. fire insurance / yr
- $902 – $1,676
Heat risk 3/10 · Minor
- Hot days now (above 101°F)
- 7 days/yr
- Hot days in 30 yrs
- 15 days/yr
Wind risk 2/10 · Minimal
- Chance of severe wind over 30 yrs
- —
Air-quality risk 1/10 · Minimal
- Unhealthy air days now
- 0 days/yr
- Unhealthy air days in 30 yrs
- 0 days/yr
Risk factors via First Street. Map © Google.
Why this score? — see what drove the C grade
The composite is a weighted blend of 9 inputs, each scored 0–100. Each bar is that input's sub-score; the figure is the points it added to the 100-point composite (weight × sub-score).
- Cash flow +15.9/30.0
- ARV discount +15.0/15.0
- Schools +6.6/10.0
- 1% rule +5.3/10.0
- DSCR +4.9/10.0
- Livability +4.0/5.0
- Rent growth +3.0/5.0
- Condition / age +2.5/5.0
- Appreciation +0.0/10.0
$154,000
🖨 Deal sheet 📄 Offer letter ✓ Due diligence
Listing remarks MLS
Older 2 story built in 1917 offers character, 3 bedrooms, full unfinished basement, vinyl siding, a generous sized 132 SF x 140 SF lot, a 2 car detached garage along with 2 outdoor storage sheds. The front entry has a covered porch the full width of the house, the back has a large wood deck with entry into the enclosed main floor sun room, and fenced yard. Property may qualify for Seller Financing. Contact your agent for details. If property was built prior to 1978, Lead Base Paint Potentially Exists. Information believed accurate but not guaranteed.
Key facts
- Covered porch
- Large wood deck
- Vinyl siding
Tags
Neighborhood map
What this means for you Summary
Snapshot
- This is a 3-bed/2.0-bath single-family listed at $154k.
Deal economics
- At list price, monthly cash flow is $73 ($880/yr) — positive.
- The deal already cash-flows at list — no discount required.
- Meets the 1% rule at list price ($2k rent vs $154k).
- Recommended offer: $136k (12.0% below list) — sets the bar for market timing.
- Cap rate 6.9% vs local median 3.1% in Cedar Falls — top-decile yield for the area; either an underpriced asset or a hidden risk that comps aren't pricing in. Stress-test before assuming the spread holds.
Location & tenants
- Location reads 81/100 on livability (#60 in IA, #1,357 nationally) — a professional / high-income tenant draw. Strengths: schools A+, cost of living A+, housing A+; Watch: amenities D, commute F.
- Cedar Falls Community School District (urban): math 76% / reading 79% proficiency, ranked #45 of 289 in IA (top 16%) — strong family-tenant draw, lease renewals of 3-5y typical; only 18% free/reduced lunch — higher-income household profile.
- Market conditions: Rents rising (+2.0%/yr); 387 active listings in the ZIP; 3 comparable units currently listed for rent nearby; rentals at typical pace (median 21d on market — plan ~3-4 weeks tenant-placement turnaround); solid renter incomes; 287 units permitted in Black Hawk County in 2024 (67 in 5+ unit buildings).
Forward outlook
- Local home prices are declining (-3.0%/yr); year-one equity from $1k of loan paydown is wiped out by about $5k of value loss. Plan a longer hold.
- Black Hawk County population projected at +10% by 2050 — modest demand growth; plan on rents tracking national, not racing it.
Negotiation context
- It's been on market 129 days — a 12% lower offer ($136k) is reasonable based on typical stale-listing flexibility.
- 2 sale attempts; this cycle's ask has dropped $16k (9%) from the opening price — seller is motivated, your offer sets the floor, not the list.
Risks & watch-outs
- Watch-outs: built in 1917 — expect roof / HVAC / electrical / plumbing capex.
Questions for the listing agent
- It's been on market 129 days. Have you received any prior offers? Is the seller open to a 12% concession, seller financing, or rate buy-down credit?
- Built in 1917 — when were the roof, HVAC, electrical panel, plumbing, and water heater last replaced?
- Why hasn't it sold? Are there any deal-killer items the seller is aware of (foundation, flood, title, zoning, code violations)?
- Is there a deadline driving the sale (1031 exchange, divorce, estate, relocation)? That informs how much negotiation room exists.
- Schools are A-rated — typically a magnet for longer-tenancy family renters. What's the average tenant stay here, and is there a school-zone premium baked into asking?
- What's the average days-on-market for RENTAL listings here right now (not sales)? A rising rental-DOM trend means longer vacancies and softer asking-rent achievability than the comps imply.
- What's the recent tenant-quality profile in this submarket — average credit score on applications, eviction rate, late-payment / NSF rate, and stable-employment percentage? A property-management company in the area should have these aggregated.
- How much new for-sale + rental construction is in the pipeline within 1–3 miles? Heavy new supply typically softens prices + rents 12–24 months out; constrained supply supports both.
Investment metrics
- 1% rule
- 1.03% ✓
- Cap rate
- 6.86%
- Cash-on-cash
- 2.04%
- DSCR
- 1.09
- GRM
- 8.1
CMA / ARV
- ARV (median comp)
- $226,862
- List price
- $154,000
- Delta
- -32.12%
- Verdict
- UNDERPRICED
- Comps
- 20 within 1.0 mi
Show comp detail 12 sales within ~0.75 mi
| Address | Dist | Beds/Ba | Sqft | Sold | Price | $/sf | Match |
|---|---|---|---|---|---|---|---|
| 1221 Parker St | 0.09mi | 3/1.0 | 1,886 (-12%) | 4mo | $187,000 | $99 | 69 |
| 1424 W Ridgewood Dr | 0.62mi | 3/1.5 | 2,150 (+1%) | 4mo | $280,000 | $130 | 64 |
| 1117 Melrose Dr | 0.30mi | 4/2.0 (+1) | 2,296 (+8%) | 6mo | $258,000 | $112 | 63 |
| 1830 Madison St | 0.36mi | 4/2.0 (+1) | 1,920 (-10%) | 6mo | $255,000 | $133 | 56 |
| 1624 Rainbow Dr | 0.21mi | 2/2.0 (-1) | 2,433 (+14%) | 9mo | $270,000 | $111 | 54 |
| 1009 Newman Ave | 0.25mi | 4/2.0 (+1) | 1,827 (-14%) | 8mo | $248,000 | $136 | 53 |
| 2117 Rownd St | 0.49mi | 4/2.0 (+1) | 1,879 (-12%) | 0mo | $310,000 | $165 | 52 |
| 2203 Grand Blvd | 0.53mi | 3/1.5 | 1,864 (-12%) | 1mo | $325,000 | $174 | 52 |
| 2320 Rainbow Dr | 0.64mi | 3/2.5 | 2,367 (+11%) | 2mo | $299,000 | $126 | 48 |
| 2519 Rownd St | 0.61mi | 4/2.0 (+1) | 2,416 (+13%) | 1mo | $327,500 | $136 | 44 |
| 2416 Valley Park Dr | 0.50mi | 4/2.0 (+1) | 1,852 (-13%) | 8mo | $257,000 | $139 | 43 |
| 2920 Mcclain Dr | 0.69mi | 3/2.0 | 1,901 (-11%) | 8mo | $317,000 | $167 | 43 |
Match score weights: distance 35% · size 25% · config 20% · recency 20%. Top-matched comps best support the ARV.
Projected returns pro-forma
-3.0% appreciation · 1.97% rent growth · sell at horizon
- IRR
- -14.3%
- Equity multiple
- 0.49×
- Total profit
- $-21,821
- Equity at exit
- $22,962
- IRR
- -7.4%
- Equity multiple
- 0.56×
- Total profit
- $-19,153
- Equity at exit
- $13,315
Cash invested: $43,120 (down + closing). Projections, not guarantees.
Landlord ↔ Tenant lean methodology
- Overall (STATE)
- 83 Strongly Landlord-Friendly
- State Iowa
- 83 Strongly Landlord-Friendly · R+6
- County
- — inherits STATE
- City
- — inherits STATE
ZIP-level market 50613
- Rents YoY
- 2.0%
- Active inventory
- 387
- Price-to-rent
- 8.1×
Monthly cashflow live
- Estimated rent
- $1,591 medium interval (Pro) →
- Mortgage (P&I)
- −$808
- Tax from tax record
- −$312 /mo · $3,738/yr
- Insurance
- −$64
- HOA
- −$0
- Vacancy / Maint / Mgmt
- −$334
- Net cashflow
- $73
Break-even live
UW: 25.0% down · 7.5% · 30yr · 1.5% tax · 5.0% vac · 8.0% maint · 8.0% mgmt
Financing live
Cash to close
- Down payment
- $38,500
- Closing costs
- $4,620
- Reserves months
- —
- Total cash needed
- —
Loan-product check · same deal, 3 products live
Conventional
25% down · 7.5% · 30yr
- Down + closing
- —
- Monthly P&I
- —
- Monthly cashflow
- —
- DSCR
- —
- Eligible?
- —
Personal DTI + credit; lowest rate.
DSCR
20% down · 8.5% · 30yr
- Down + closing
- —
- Monthly P&I
- —
- Monthly cashflow
- —
- DSCR
- —
- Eligible?
- —
No personal income docs; deal must DSCR.
Hard money
10% down · 12.0% · 12mo
- Down + closing
- —
- Monthly P&I
- —
- Monthly cashflow
- —
- DSCR
- —
- Eligible?
- —
Short-term bridge; refi at stabilization.
Rent comps 3 comps
| Address | Beds | Baths | Sqft | Rent | $/sqft | DOM | Units | Dist |
|---|---|---|---|---|---|---|---|---|
| 1014 Main St Cedar Falls, IA | 2.0 | 1.0 | 1400 | $1,500 | $1.07 | 43d | 1 | 0.96mi |
| 604 W Seerley Blvd Cedar Falls, IA | 4.0 | 1.5 | 1600 | $1,300 | $0.81 | 21d | 1 | 1.20mi |
| 2609 Olive St Cedar Falls, IA | 4.0 | 2.0–2.5 | 1568 | $1,750 | $1.12 | 21d | 6 | 1.38mi |
Listing history 5 events
-
2026-03-06price $154,000 556-char remark
Show marketing remark (597 chars)
Older 2 story built in 1917 offers character, gas fireplace, 3 bedrooms up, full unfinished basement, vinyl siding, a generous sized 132 SF x 140 SF lot, a 2 car detached garage along with 2 outdoor storage sheds. The front entry has a covered porch the full width of the house, the back has a large wood deck with entry into the enclosed main floor sun room, fenced yard. Attic has 458 SF finished. Property may qualify for Seller Financing. Contact your agent for details. If property was built prior to 1978, Lead Base Paint Potentially Exists. Information believed accurate but not guaranteed.
-
2026-03-06price $154,000 597-char remark
Show marketing remark (597 chars)
Older 2 story built in 1917 offers character, gas fireplace, 3 bedrooms up, full unfinished basement, vinyl siding, a generous sized 132 SF x 140 SF lot, a 2 car detached garage along with 2 outdoor storage sheds. The front entry has a covered porch the full width of the house, the back has a large wood deck with entry into the enclosed main floor sun room, fenced yard. Attic has 458 SF finished. Property may qualify for Seller Financing. Contact your agent for details. If property was built prior to 1978, Lead Base Paint Potentially Exists. Information believed accurate but not guaranteed.
-
2026-01-12$170,000 Active 556-char remark
Show marketing remark (597 chars)
Older 2 story built in 1917 offers character, gas fireplace, 3 bedrooms up, full unfinished basement, vinyl siding, a generous sized 132 SF x 140 SF lot, a 2 car detached garage along with 2 outdoor storage sheds. The front entry has a covered porch the full width of the house, the back has a large wood deck with entry into the enclosed main floor sun room, fenced yard. Attic has 458 SF finished. Property may qualify for Seller Financing. Contact your agent for details. If property was built prior to 1978, Lead Base Paint Potentially Exists. Information believed accurate but not guaranteed.
-
2026-01-12$170,000 Active 597-char remark
Show marketing remark (597 chars)
Older 2 story built in 1917 offers character, gas fireplace, 3 bedrooms up, full unfinished basement, vinyl siding, a generous sized 132 SF x 140 SF lot, a 2 car detached garage along with 2 outdoor storage sheds. The front entry has a covered porch the full width of the house, the back has a large wood deck with entry into the enclosed main floor sun room, fenced yard. Attic has 458 SF finished. Property may qualify for Seller Financing. Contact your agent for details. If property was built prior to 1978, Lead Base Paint Potentially Exists. Information believed accurate but not guaranteed.
-
2012-06-28soldstatus $200,000
ⓘ Source: listings_history table (triggers on properties + properties_extension) + one-shot
backfill from property_details.listing_events for pre-trigger history.
Tax reassessment forecast IA · Partial reset (capped growth)
- Current annual tax
- $3,738 · $312/mo
- Projected year-2 tax
- $3,738 · $312/mo
- Expected delta
- $0/yr ($0/mo · 0.0%)
ⓘ Screening estimate from a state-policy table — verify with the county assessor before closing.
Climate risk First Street
- Flood 1/10 Low FEMA zone X (unshaded) · 0% chance over 30 yrs
- Wildfire 1/10 Low
- Heat 3/10 Moderate 7 d/yr ≥101°F today · 15 d/yr by 30 yrs out
- Wind 2/10 Low
- Air quality 1/10 Low 0 unhealthy d/yr today · 0 by 30 yrs out
Nearby sold comps map
Loading sold comps map…
Walkable amenities ~0.75 mi
Loading nearby amenities…
Taxation est. · year 1
- Rental income
- $19,087
- − Mortgage interest
- −$8,626
- − Property taxes
- −$3,738
- − Insurance
- −$770
- − Repairs & maintenance
- −$1,527
- − Management
- −$1,527
- − Depreciation
- −$4,480
- Taxable loss
- −$1,581
- Est. tax savings @ 24.0%
- +$380
- After-tax cash flow
- $1,259/yr
For passive investors: Depreciation is non-cash, so a rental often shows a tax loss while cash-flowing — sheltering income. Rental losses are passive: they offset passive income freely, and up to $25,000/yr can offset ordinary (W-2) income if you actively participate and your MAGI is under $100k (phasing out to $0 by $150k); unused losses carry forward. On sale, claimed depreciation is recaptured at up to 25%, and gains may owe capital-gains tax (a 1031 exchange can defer both). Figures are a year-1 estimate at your 24.0% rate — not tax advice; consult a CPA.
Schools (NCES district)
- District
- Cedar Falls Community School District
- NCES district ID
- 1906510
- Math proficiency
- 76% ▼ -6.00%
- Reading proficiency
- 79% ▼ -2.00%
- Median HH income
- $53,634
- Composite
- 65.93/100
- National rank
- #443
- State rank
- #45 of 289 in IA
Livability — Cedar Falls
- Score
- 81/100
- State rank
- #60
- US rank
- #1357
Category grades
Schools grade is shown separately in the Schools card above.
Census & demographics
- Census place
- Cedar Falls, IA
- County
- Black Hawk County · 112,933 people
- City population
- 43,867
- Metro
- Waterloo-Cedar Falls, IA
- Population (ZIP)
- 43,867
- Household income
- $78,503
- Rent vs Own
- Severe rent burden
- 1514.0
Population outlook (Black Hawk County) Hauer SSP2
- Today (2025)
- 139,716 people
- By 2030
- 142,853 · +2.2%
- By 2040
- 147,843 · +5.8%
- By 2050
- 153,247 · +9.7%
- By 2075
- 167,977 · +20.2%
- By 2100
- 177,320 · +26.9%
Race, ethnicity, and origin ACS 2023
- Neighborhood character
- Predominantly White (90%)
- Race & ethnicity
- White 90% Asian 3% Two or more races 3% Hispanic / Latino 3% Black 1%
- Common ancestry
- Portuguese 6% Italian 3% Iranian 3%
- Foreign-born
- 4% · Canada, South Korea
- Languages at home
- 95% English-only · Spanish 2% Russian/Polish/Slavic 1% Other Indo-European 1%
Political lean MEDSL · Black Hawk
- 2024 margin
- Toss-up / Even · D 50.0% · R 48.8% · Other 1.2%
- 2008→2024 swing
- -21.3pp toward R · 2008: 22.4pp · 2024: 1.2pp
- All cycles
- 2024: D+1.2 2020: D+9.0 2016: D+7.3 2012: D+20.0 2008: D+22.4
Not yet ingested
- Civics
- —
Market trends
- HPI YoY
- ▼ -175.51%
- Current HPI
- 169.0591
- Rent YoY
- ▲ 1.97%
- Metro
- Waterloo-Cedar Falls, IA
- State GDP YoY
- ▲ 2.48%
- F500 in state
- 4
Industry mix (Fortune 500 HQ in IA)
| Industry | F500 HQs | Revenue |
|---|---|---|
| Financial Services | 1 | $16B |
|
||
| Retail / Convenience | 1 | $15B |
|
||
Price history
-23.0% since first listed5 events — show timeline
- 2026-03-06 Price Changed $154,000 CRAAR, CDRMLS
- 2026-03-06 Price Changed $154,000 NEIRBR as distributed by MLS GRID
- 2026-01-12 Listed $170,000 NEIRBR as distributed by MLS GRID
- 2026-01-12 Listed $170,000 CRAAR, CDRMLS
- 2012-06-28 Sold (Public Records) $200,000 Public Records
Property tax history
+1.6%/yrLatest (2025): $3,738 · +2.9% YoY. Source: county tax records.
Cash-flow waterfall
monthlySold comps — $/sqft
last 12 mo · ≤1 miLoading sold comps…