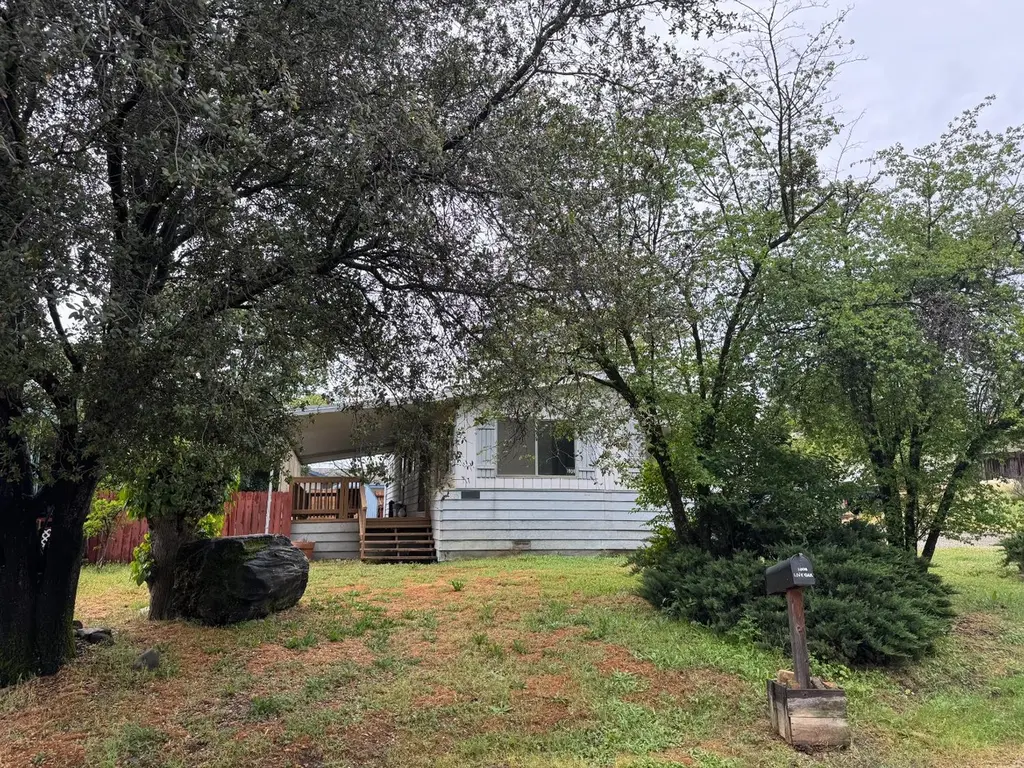
1808 Live Oak · Douglas Flat, CA
Flood risk 1/10 · Minimal
- FEMA flood zone
- X (unshaded)
- Chance of flooding over 30 yrs
- 0.0%
- Est. flood insurance / yr
- $507 – $1,088
Fire risk 8/10 · Major
- Est. fire insurance / yr
- $659 – $1,223
Heat risk 6/10 · Moderate
- Hot days now (above 100°F)
- 7 days/yr
- Hot days in 30 yrs
- 17 days/yr
Wind risk 1/10 · Minimal
- Chance of severe wind over 30 yrs
- —
Air-quality risk 10/10 · Severe
- Unhealthy air days now
- 27 days/yr
- Unhealthy air days in 30 yrs
- 31 days/yr
Risk factors via First Street. Map © Google.
Why this score? — see what drove the C grade
The composite is a weighted blend of 9 inputs, each scored 0–100. Each bar is that input's sub-score; the figure is the points it added to the 100-point composite (weight × sub-score).
- ARV discount +15.0/15.0
- Cash flow +14.2/30.0
- Appreciation +10.0/10.0
- Schools +4.5/10.0
- DSCR +4.3/10.0
- 1% rule +2.8/10.0
- Rent growth +2.5/5.0
- Livability +2.5/5.0
- Condition / age +2.5/5.0
$175,000
🖨 Deal sheet (PDF) 📄 Offer letter ✓ Due diligence
Listing remarks
This is an awesome starter home so that you can own your home rather than rent. Close to Murphys, great school districts. There is 1440 sq. ft. 2 bedrooms, 2 bathrooms, Roof is only 3 years old. Lots of opportunity and possibilities with this listing.
Key facts
- 5,227 sq ft lot
- Built 1980
- Listed 7 days
Tags
Neighborhood map
What this means for you Summary
Snapshot
- This is a 2-bed/2.0-bath manufactured listed at $175k.
Deal economics
- At list price, monthly cash flow is $30 ($355/yr) — positive.
- The deal already cash-flows at list — no discount required.
- To meet the 1% rule (rent ≥ 1% of price), the offer needs to be $137k (21.8% below list).
- Recommended offer: $137k (21.8% below list) — sets the bar for 1% rule.
Location & tenants
- Location reads: area grade C — affects rentability + tenant quality, not the cash-flow math above.
- Bret Harte Union High (town): math 35% / reading 65% proficiency, ranked #429 of 1,400 in CA (top 31%) — acceptable for families but not a draw, mixed tenant base, ~2y average lease.
- Zoned schools: Albert A. Michelson Elementary (math 37% / reading 52%, grade F, #496 of 1,571 statewide, top 34%, 213 students, 34% FRL); Avery Middle (math 37% / reading 52%, grade D, #130 of 498 statewide, top 27%, 198 students, 61% FRL); Bret Harte Union High (587 students, 44% FRL).
- Market conditions: 10 active listings in the ZIP; 77 units permitted in Calaveras County in 2024 (0 in 5+ unit buildings).
Forward outlook
- In year one you build about $19k of equity ($1k loan paydown + $18k appreciation (10.0% local appreciation)).
- Calaveras County population projected at -18% by 2050 — secular population decline; favor cash flow + early exit over multi-decade hold.
- At projected returns (10.0% appreciation + 3.0% rent growth), your $49k cash investment doubles in ~3 years — after that, you're playing with house money.
- By year 2, paydown + projected appreciation supports a ~$30k cash-out refi (75% LTV) — recoverable capital for the next deal without selling this one.
Negotiation context
- Only 7 days on market — expect competitive offers; lowballing is unlikely to land.
Risks & watch-outs
- Climate carrying-cost: severe wildfire risk; extreme-heat days projected 7→17/yr by 2055 (HVAC capex compounding) — expect insurance premiums to compound above CPI over the hold.
Questions for the listing agent
- Is there a deadline driving the sale (1031 exchange, divorce, estate, relocation)? That informs how much negotiation room exists.
- What's the average days-on-market for RENTAL listings here right now (not sales)? A rising rental-DOM trend means longer vacancies and softer asking-rent achievability than the comps imply.
- What's the recent tenant-quality profile in this submarket — average credit score on applications, eviction rate, late-payment / NSF rate, and stable-employment percentage? A property-management company in the area should have these aggregated.
- How much new for-sale + rental construction is in the pipeline within 1–3 miles? Heavy new supply typically softens prices + rents 12–24 months out; constrained supply supports both.
Investment metrics
- 1% rule
- 0.78% ✗
- Cap rate
- 6.50%
- Cash-on-cash
- 0.72%
- DSCR
- 1.03
- GRM
- 10.7
CMA / ARV
- ARV (on-the-fly)
- $239,040
- Comps found
- 2
Show comp detail 2 sales within ~0.75 mi
| Address | Dist | Beds/Ba | Sqft | Sold | Price | $/sf | Match |
|---|---|---|---|---|---|---|---|
| 1736 Live Oak Ct | 0.09mi | 2/2.0 | 1,440 (0%) | 6mo | $130,000 | $90 | 91 |
| 1825 Live Oak Dr | 0.04mi | 3/2.0 (+1) | 1,440 (0%) | 23mo | $239,000 | $166 | 74 |
Match score weights: distance 35% · size 25% · config 20% · recency 20%. Top-matched comps best support the ARV.
Projected returns pro-forma
10.0% appreciation · 3.0% rent growth · sell at horizon
- IRR
- 24.8%
- Equity multiple
- 2.98×
- Total profit
- $97,119
- Equity at exit
- $157,654
- IRR
- 21.9%
- Equity multiple
- 6.80×
- Total profit
- $284,365
- Equity at exit
- $339,987
Cash invested: $49,000 (down + closing). Projections, not guarantees.
Landlord ↔ Tenant lean methodology
- Overall (STATE)
- 18 Strongly Tenant-Friendly
- State California
- 18 Strongly Tenant-Friendly · D+13
- County
- — inherits STATE
- City
- — inherits STATE
ZIP-level market 95251
- Home prices YoY
- 6.3%
- Active inventory
- 10
- Price-to-rent
- 10.7×
Monthly cashflow live
- Estimated rent
- $1,369 medium interval (Pro) →
- Mortgage (P&I)
- −$918
- Tax from tax record
- −$61 /mo · $737/yr
- Insurance
- −$73
- HOA
- −$0
- Vacancy / Maint / Mgmt
- −$288
- Net cashflow
- $30
Break-even live
Sensitivity live
| Price | -10% $129 | -5% $79 | +0% $30 | +5% $-20 | +10% $-69 |
|---|---|---|---|---|---|
| Rent | -10% $-79 | -5% $-24 | +0% $30 | +5% $84 | +10% $138 |
| Rate | -1.0pp $118 | -0.5pp $74 | base $30 | +0.5pp $-16 | +1.0pp $-62 |
UW: 25.0% down · 7.5% · 30yr · 1.5% tax · 5.0% vac · 8.0% maint · 8.0% mgmt
Financing live
Cash to close
- Down payment
- $43,750
- Closing costs
- $5,250
- Reserves months
- —
- Total cash needed
- —
Loan-product check · same deal, 3 products live
Conventional
25% down · 7.5% · 30yr
- Down + closing
- —
- Monthly P&I
- —
- Monthly cashflow
- —
- DSCR
- —
- Eligible?
- —
Personal DTI + credit; lowest rate.
DSCR
20% down · 8.5% · 30yr
- Down + closing
- —
- Monthly P&I
- —
- Monthly cashflow
- —
- DSCR
- —
- Eligible?
- —
No personal income docs; deal must DSCR.
Hard money
10% down · 12.0% · 12mo
- Down + closing
- —
- Monthly P&I
- —
- Monthly cashflow
- —
- DSCR
- —
- Eligible?
- —
Short-term bridge; refi at stabilization.
Tax reassessment forecast CA · Resets to sale price
- Current annual tax
- $737 · $61/mo
- Projected year-2 tax
- $1,330 · $111/mo
- Expected delta
- +$593/yr (+$49/mo · 80.5%)
ⓘ Screening estimate from a state-policy table — verify with the county assessor before closing.
Climate risk First Street
- Flood 1/10 Low FEMA zone X (unshaded) · 0% chance over 30 yrs
- Wildfire 8/10 Severe
- Heat 6/10 Major 7 d/yr ≥100°F today · 17 d/yr by 30 yrs out
- Wind 1/10 Low
- Air quality 10/10 Extreme 27 unhealthy d/yr today · 31 by 30 yrs out
Nearby sold comps map
Loading sold comps map…
Walkable amenities ~0.75 mi
Loading nearby amenities…
Taxation est. · year 1
- Rental income
- $16,430
- − Mortgage interest
- −$9,803
- − Property taxes
- −$737
- − Insurance
- −$875
- − Repairs & maintenance
- −$1,314
- − Management
- −$1,314
- − Depreciation
- −$5,091
- Taxable loss
- −$2,704
- Est. tax savings @ 24.0%
- +$649
- After-tax cash flow
- $1,004/yr
For passive investors: Depreciation is non-cash, so a rental often shows a tax loss while cash-flowing — sheltering income. Rental losses are passive: they offset passive income freely, and up to $25,000/yr can offset ordinary (W-2) income if you actively participate and your MAGI is under $100k (phasing out to $0 by $150k); unused losses carry forward. On sale, claimed depreciation is recaptured at up to 25%, and gains may owe capital-gains tax (a 1031 exchange can defer both). Figures are a year-1 estimate at your 24.0% rate — not tax advice; consult a CPA.
Schools (NCES district)
- District
- Bret Harte Union High
- NCES district ID
- 0605940
- Math proficiency
- 35% ▲ 5.00%
- Reading proficiency
- 65% ▲ 5.00%
- Median HH income
- $56,974
- Composite
- 45.41/100
- National rank
- #5708
- State rank
- #429 of 1400 in CA
Livability — Douglas Flat
No livability data for this city. (Only ~50 U.S. cities are tracked.)
Census & demographics
- Census place
- Douglas Flat, CA
- Population (ZIP)
- 684
Population outlook (Calaveras County) Hauer SSP2
- Today (2025)
- 43,163 people
- By 2030
- 41,703 · -3.4%
- By 2040
- 38,202 · -11.5%
- By 2050
- 35,385 · -18.0%
- By 2075
- 30,807 · -28.6%
- By 2100
- 25,755 · -40.3%
Race, ethnicity, and origin ACS 2023
- Neighborhood character
- Predominantly White (73%)
- Race & ethnicity
- White 73% Two or more races 22% Native American 5%
- Common ancestry
- Romanian 7% Lithuanian 6% Serbian 3%
- Foreign-born
- 5%
- Languages at home
- 96% English-only · Other Indo-European 3% Russian/Polish/Slavic 1%
Political lean MEDSL · Calaveras
- 2024 margin
- Strong R (+28.1) · D 34.7% · R 62.8% · Other 2.5%
- 2008→2024 swing
- -15.2pp toward R · 2008: -13.0pp · 2024: -28.1pp
- All cycles
- 2024: R+28.1 2020: R+23.8 2016: R+23.9 2012: R+17.0 2008: R+13.0
Not yet ingested
- Civics
- —
Market trends
- HPI YoY
- ▲ 11.34%
- Current HPI
- 190.1
- Rent YoY
- —
- Metro
- —
- State GDP YoY
- ▲ 3.21%
- F500 in state
- 116
Industry mix (Fortune 500 HQ in CA)
| Industry | F500 HQs | Revenue |
|---|---|---|
| Technology | 27 | $1,492B |
|
||
| Financial Services | 3 | $174B |
|
||
| Retail | 3 | $44B |
|
||
| Insurance | 3 | $26B |
|
||
| Media / Entertainment | 2 | $115B |
|
||
| Pharmaceuticals / Biotech | 2 | $62B |
|
||
Property tax history
+2.9%/yrLatest (2025): $737 · +0.6% YoY. Source: county tax records.
Cash-flow waterfall
monthlySold comps — $/sqft
last 12 mo · ≤1 miLoading sold comps…