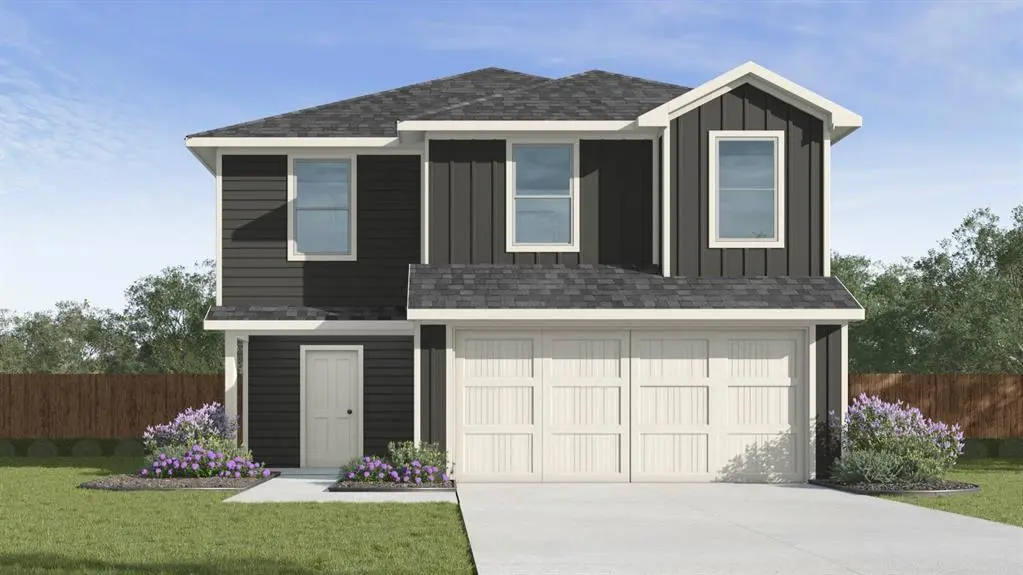
3503 Spring Time St · Forney, TX
Flood risk 1/10 · Minimal
- FEMA flood zone
- X (unshaded)
- Chance of flooding over 30 yrs
- 0.0%
- Est. flood insurance / yr
- $507 – $1,088
Fire risk 5/10 · Moderate
- Est. fire insurance / yr
- $1,222 – $2,270
Heat risk 8/10 · Major
- Hot days now (above 110°F)
- 7 days/yr
- Hot days in 30 yrs
- 24 days/yr
Wind risk 6/10 · Moderate
- Chance of severe wind over 30 yrs
- 27.0%
Air-quality risk 2/10 · Minimal
- Unhealthy air days now
- 1 days/yr
- Unhealthy air days in 30 yrs
- 1 days/yr
Risk factors via First Street. Map © Google.
Why this score? — see what drove the B- grade
The composite is a weighted blend of 9 inputs, each scored 0–100. Each bar is that input's sub-score; the figure is the points it added to the 100-point composite (weight × sub-score).
- Cash flow +22.9/30.0
- ARV discount +15.0/15.0
- DSCR +7.4/10.0
- 1% rule +6.2/10.0
- Schools +4.0/10.0
- Condition / age +4.0/5.0
- Livability +3.8/5.0
- Rent growth +2.9/5.0
- Appreciation +0.0/10.0
$255,490
🖨 Deal sheet 📄 Offer letter ✓ Due diligence
Listing remarks
NEW! This home plan offers an exceptional blend of style and functionality, designed to meet the demands of modern lifestyles. The custom, architecturally designed elevation, complemented by divided light windows and a front-facing garage with decorative hardware, creates a striking visual appeal. A covered front porch leads to a raised panel fiberglass insulated front door, inviting you into a world of comfort. Inside, a welcoming foyer seamlessly flows into the open concept living spaces. The kitchen, a focal point of the home, features 30” cabinets with hidden hinges, elegant granite or quartz countertops, and stainless-steel appliances. A built-in sink, dishwasher, and spacious pa
Key facts
- Covered front porch
- 30 inch cabinets
- Front facing garage
Tags
Property features AI
Finance
- Other: Builder special listing conditions
- HOA & community: Mandatory HOA; Semi-annual association fee ($250); Association fee includes full use of facilities
Exterior
- Parking: Covered parking for 2 vehicles; Driveway; Attached 2-car garage (approx. 18' x 20')
- Security: Carbon monoxide detector(s); Smoke detector(s)
- Utilities: MUD water; MUD sewer; Municipal Utility District
- Home design: Single-family residence; Two-story; New construction (incomplete)
- Construction: Built in 2026; New construction - incomplete
- Exterior features: Less than 1/2 acre lot; Community pool; Subdivision: Maplewood Meadows
Interior
- Kitchen: Kitchen island; Dishwasher; Disposal; Electric cooktop; Electric oven; Microwave
- Bedrooms: Primary bedroom (upstairs) with separate shower and walk-in closet; Four additional bedrooms (upstairs)
- Flooring: Carpet; Laminate
- Bathrooms: Two full bathrooms; One half bathroom
- Interior features: Cable TV available; High-speed internet available; Smart home features
- Laundry & utility: Washer/dryer connections (standard laundry utilities implied)
Neighborhood map
What this means for you Summary
Snapshot
- This is a 5-bed/2.5-bath single-family listed at $255k. Condition is rated good.
Deal economics
- At list price, monthly cash flow is $449 ($5k/yr) — positive.
- The deal already cash-flows at list — no discount required.
- Meets the 1% rule at list price ($3k rent vs $255k).
- Recommended offer: $248k (3.0% below list) — sets the bar for market timing.
- Cap rate 8.4% vs local median 4.1% in Forney — top-decile yield for the area; either an underpriced asset or a hidden risk that comps aren't pricing in. Stress-test before assuming the spread holds.
Location & tenants
- Location reads 76/100 on livability (#98 in TX, #3,339 nationally) — a middle-class / working-renter tenant base. Strengths: crime A+, employment A+, cost of living A+; Watch: amenities C-, commute F.
- Forney ISD (rural): math 41% / reading 44% proficiency, ranked #234 of 826 in TX (top 28%) — families likely to look elsewhere, expect single-tenant / working-renter base with shorter leases.
- Zoned schools: Willett El (725 students, 32% FRL).
- Market conditions: Rents rising (+1.4%/yr); 2179 active listings in the ZIP; 9 comparable units currently listed for rent nearby; rentals lingering (median 44d on market — plan ~5-8 weeks vacancy on turnover, expect pricing pressure); 56% of comp listings sitting > 30 days — soft ceiling on asking rent; solid renter incomes; 1,747 units permitted in Kaufman County in 2024 (180 in 5+ unit buildings).
- This rent runs 33% of the median local income ($104k/yr) — at the standard rent-burdened threshold; future hikes will face affordability resistance.
Forward outlook
- Local home prices are declining (-3.0%/yr); year-one equity from $2k of loan paydown is wiped out by about $8k of value loss. Plan a longer hold.
- Kaufman County population projected at +43% by 2050 — long-run rental-demand tailwind backs the buy-and-hold thesis.
Negotiation context
- It's been on market 52 days — a 3% lower offer ($248k) is reasonable based on typical stale-listing flexibility.
Risks & watch-outs
- Climate carrying-cost: major wind risk, 27% chance of damaging wind over 30y; moderate wildfire risk; extreme-heat days projected 7→24/yr by 2055 (HVAC capex compounding) — expect insurance premiums to compound above CPI over the hold.
Questions for the listing agent
- It's been on market 52 days. Have you received any prior offers? Is the seller open to a 3% concession, seller financing, or rate buy-down credit?
- What does the HOA fee cover, when was the last increase, and are there any pending special assessments or reserve-fund shortfalls?
- Is there a deadline driving the sale (1031 exchange, divorce, estate, relocation)? That informs how much negotiation room exists.
- Schools are B-rated — typically a magnet for longer-tenancy family renters. What's the average tenant stay here, and is there a school-zone premium baked into asking?
- What's the average days-on-market for RENTAL listings here right now (not sales)? A rising rental-DOM trend means longer vacancies and softer asking-rent achievability than the comps imply.
- What's the recent tenant-quality profile in this submarket — average credit score on applications, eviction rate, late-payment / NSF rate, and stable-employment percentage? A property-management company in the area should have these aggregated.
- How much new for-sale + rental construction is in the pipeline within 1–3 miles? Heavy new supply typically softens prices + rents 12–24 months out; constrained supply supports both.
Investment metrics
- 1% rule
- 1.12% ✓
- Cap rate
- 8.40%
- Cash-on-cash
- 7.53%
- DSCR
- 1.34
- GRM
- 7.5
CMA / ARV
- ARV (median comp)
- $390,939
- List price
- $255,490
- Delta
- -34.65%
- Verdict
- UNDERPRICED
- Comps
- 20 within 1.0 mi
Show comp detail 6 sales within ~0.75 mi
| Address | Dist | Beds/Ba | Sqft | Sold | Price | $/sf | Match |
|---|---|---|---|---|---|---|---|
| 1328 Middlebrooks Dr | 0.39mi | 4/3.0 (-1) | 2,015 (+6%) | 14mo | $433,000 | $215 | 53 |
| 1010 White Porch Ave | 0.44mi | 4/2.0 (-1) | 1,943 (+3%) | 21mo | $334,500 | $172 | 50 |
| 1019 Joseph Ct | 0.68mi | 4/2.0 (-1) | 1,981 (+5%) | 18mo | $475,070 | $240 | 39 |
| 1115 Oak Ridge Rd | 0.37mi | 4/2.0 (-1) | 2,112 (+12%) | 22mo | $340,000 | $161 | 38 |
| 1023 Joseph Ct | 0.64mi | 4/2.0 (-1) | 2,174 (+15%) | 12mo | $471,500 | $217 | 29 |
| 10090 Country View Ln | 0.74mi | 4/2.0 (-1) | 1,622 (-14%) | 8mo | $380,000 | $234 | 28 |
Match score weights: distance 35% · size 25% · config 20% · recency 20%. Top-matched comps best support the ARV.
Projected returns pro-forma
-3.0% appreciation · 1.42% rent growth · sell at horizon
- IRR
- -6.6%
- Equity multiple
- 0.76×
- Total profit
- $-17,209
- Equity at exit
- $38,094
- IRR
- 0.9%
- Equity multiple
- 1.06×
- Total profit
- $4,342
- Equity at exit
- $22,090
Cash invested: $71,537 (down + closing). Projections, not guarantees.
Landlord ↔ Tenant lean methodology
- Overall (STATE)
- 87 Strongly Landlord-Friendly
- State Texas
- 87 Strongly Landlord-Friendly · R+5
- County
- — inherits STATE
- City
- — inherits STATE
ZIP-level market 75126
- Rents YoY
- 1.4%
- Active inventory
- 2179
- Price-to-rent
- 7.5×
Monthly cashflow live
- Estimated rent
- $2,856 high interval (Pro) →
- Mortgage (P&I)
- −$1,340
- Tax est. 1.5%
- −$319 /mo · $3,832/yr
- Insurance
- −$106
- HOA
- −$42
- Vacancy / Maint / Mgmt
- −$600
- Net cashflow
- $449
Break-even live
UW: 25.0% down · 7.5% · 30yr · 1.5% tax · 5.0% vac · 8.0% maint · 8.0% mgmt
Financing live
Cash to close
- Down payment
- $63,872
- Closing costs
- $7,665
- Reserves months
- —
- Total cash needed
- —
Loan-product check · same deal, 3 products live
Conventional
25% down · 7.5% · 30yr
- Down + closing
- —
- Monthly P&I
- —
- Monthly cashflow
- —
- DSCR
- —
- Eligible?
- —
Personal DTI + credit; lowest rate.
DSCR
20% down · 8.5% · 30yr
- Down + closing
- —
- Monthly P&I
- —
- Monthly cashflow
- —
- DSCR
- —
- Eligible?
- —
No personal income docs; deal must DSCR.
Hard money
10% down · 12.0% · 12mo
- Down + closing
- —
- Monthly P&I
- —
- Monthly cashflow
- —
- DSCR
- —
- Eligible?
- —
Short-term bridge; refi at stabilization.
Rent comps 9 comps
| Address | Beds | Baths | Sqft | Rent | $/sqft | DOM | Units | Dist |
|---|---|---|---|---|---|---|---|---|
| 1114 Leafy Glade Rd Forney, TX | 5.0 | 2.5 | 2376 | $2,900 | $1.22 | 11d | 1 | 0.44mi |
| 1308 Middlebrooks Dr Forney, TX | 4.0 | 2.5 | 2231 | $2,650 | $1.19 | 44d | 1 | 0.74mi |
| 2503 Blue Oasis Ct Forney, TX | 4.0 | 2.5 | 2127 | $2,499 | $1.17 | 7d | 1 | 0.88mi |
| 2302 Doe Branch Ln Forney, TX | 4.0 | 2.5 | 2457 | $2,750 | $1.12 | 22d | 1 | 0.90mi |
| 2140 Florence Dr Forney, TX | 4.0 | 2.5 | 2032 | $2,600 | $1.28 | 43d | 1 | 0.94mi |
| 107 Huckleberry Rd Forney, TX | 4.0 | 2.5 | 2186 | $2,900 | $1.33 | 43d | 1 | 0.96mi |
| 321 S Chestnut St Forney, TX | 4.0 | 2.0 | 1831 | $2,150 | $1.17 | 24d | 1 | 1.09mi |
| 4005 Waterford Dr Forney, TX | 4.0 | 2.0 | 1852 | $2,350 | $1.27 | 43d | 1 | 1.21mi |
| 4306 Paxton Dr Forney, TX | 4.0 | 2.0 | 1837 | $2,600 | $1.42 | 43d | 1 | 1.43mi |
HOA detail
- Monthly dues
- $42 · $504/yr
Listing history 17 events
-
2026-06-18days on market $255,490 Active 52 DOM
-
2026-06-17days on market $255,490 Active 51 DOM
-
2026-06-16days on market $255,490 Active 50 DOM
-
2026-06-15days on market $255,490 Active 49 DOM
-
2026-06-13days on market $255,490 Active 47 DOM
-
2026-06-13days on market $255,490 Active 46 DOM
-
2026-06-10price $255,490 Active 43 DOM
-
2026-06-09days on market $259,490 Active 43 DOM
-
2026-06-08days on market $259,490 Active 42 DOM
-
2026-06-07pricedays on market $259,490 Active 41 DOM
-
2026-06-04days on market $268,490 Active 38 DOM
-
2026-06-03days on market $268,490 Active 37 DOM
-
2026-06-02days on market $268,490 Active 36 DOM
-
2026-06-01days on market $268,490 Active 35 DOM
-
2026-05-31days on market $268,490 Active 34 DOM
-
2026-05-13price $266,490 1413-char remark
-
2026-04-27$268,490 Active 1413-char remark
ⓘ Source: listings_history table (triggers on properties + properties_extension) + one-shot
backfill from property_details.listing_events for pre-trigger history.
Climate risk First Street
- Flood 1/10 Low FEMA zone X (unshaded) · 0% chance over 30 yrs
- Wildfire 5/10 Major
- Heat 8/10 Severe 7 d/yr ≥110°F today · 24 d/yr by 30 yrs out
- Wind 6/10 Major 27% chance of damaging wind over 30 yrs
- Air quality 2/10 Low 1 unhealthy d/yr today · 1 by 30 yrs out
Nearby sold comps map
Loading sold comps map…
Walkable amenities ~0.75 mi
Loading nearby amenities…
Taxation est. · year 1
- Rental income
- $34,277
- − Mortgage interest
- −$14,311
- − Property taxes
- −$3,832
- − Insurance
- −$1,277
- − Repairs & maintenance
- −$2,742
- − Management
- −$2,742
- − HOA
- −$504
- − Depreciation
- −$7,432
- Taxable income
- $1,435
- Est. tax owed @ 24.0%
- −$344
- After-tax cash flow
- $5,043/yr
For passive investors: Depreciation is non-cash, so a rental often shows a tax loss while cash-flowing — sheltering income. Rental losses are passive: they offset passive income freely, and up to $25,000/yr can offset ordinary (W-2) income if you actively participate and your MAGI is under $100k (phasing out to $0 by $150k); unused losses carry forward. On sale, claimed depreciation is recaptured at up to 25%, and gains may owe capital-gains tax (a 1031 exchange can defer both). Figures are a year-1 estimate at your 24.0% rate — not tax advice; consult a CPA.
Condition & rehab AI · 12 photos
This home is in excellent condition with a fresh paint job and modern appliances. It's move-in ready and would benefit from a fresh coat of paint and new flooring in bathrooms to further enhance its value.
Value-add opportunities
- Resale paint interior walls — Fresh paint enhances curb appeal and interior aesthetics
- Rental install new flooring in bathrooms — New flooring in bathrooms improves functionality and appeal
- Both install new kitchen appliances — Modern appliances can increase both resale and rental value
Renovation cost estimate screening
Value-add ROI direction
- Resale paint interior walls — Fresh paint enhances curb appeal and interior aesthetics ↑
- Rental install new flooring in bathrooms — New flooring in bathrooms improves functionality and appeal ↑
- Both install new kitchen appliances — Modern appliances can increase both resale and rental value ↑
ⓘ Cost ranges are severity-bucket heuristics (US national rule-of-thumb). Get contractor quotes + a written scope before underwriting a rehab budget.
Schools (NCES district)
- District
- Forney ISD
- NCES district ID
- 4819560
- Math proficiency
- 41% ▼ -20.00%
- Reading proficiency
- 44% ▼ -12.00%
- Median HH income
- $86,679
- Composite
- 40.07/100
- National rank
- #3812
- State rank
- #234 of 826 in TX
Livability — Forney
- Score
- 76/100
- State rank
- #98
- US rank
- #3339
Category grades
Schools grade is shown separately in the Schools card above.
Census & demographics
- Census place
- Forney, TX
- County
- Kaufman County · 122,338 people
- City population
- 84,799
- Metro
- Dallas-Fort Worth-Arlington, TX
- Population (ZIP)
- 84,799
- Household income
- $103,673
- Rent vs Own
- Severe rent burden
- 1306.0
Population outlook (Kaufman County) Hauer SSP2
- Today (2025)
- 138,716 people
- By 2030
- 150,815 · +8.7%
- By 2040
- 174,877 · +26.1%
- By 2050
- 198,020 · +42.8%
- By 2075
- 251,908 · +81.6%
- By 2100
- 285,325 · +105.7%
Race, ethnicity, and origin ACS 2023
- Neighborhood character
- Diverse neighborhood (Simpson 0.68)
- Race & ethnicity
- White 45% Black 25% Hispanic / Latino 23% Two or more races 14% Asian 3%
- Hispanic origin (detail)
- Mexican 18% Puerto Rican 1%
- Common ancestry
- Italian 2% Slovak 1% Portuguese 1%
- Foreign-born
- 12% · Canada, Vietnam
- Languages at home
- 79% English-only · Spanish 14% Arabic 1% Vietnamese 1%
Political lean MEDSL · Kaufman
- 2024 margin
- Strong R (+27.9) · D 35.6% · R 63.5%
- 2008→2024 swing
- +7.9pp toward D · 2008: -35.8pp · 2024: -27.9pp
- All cycles
- 2024: R+27.9 2020: R+33.9 2016: R+47.0 2012: R+44.4 2008: R+35.8
Not yet ingested
- Civics
- —
Market trends
- HPI YoY
- ▼ -102.93%
- Current HPI
- 148.5749
- Rent YoY
- ▲ 1.42%
- Metro
- Dallas-Fort Worth-Arlington, TX
- State GDP YoY
- ▲ 3.95%
- F500 in state
- 110
Industry mix (Fortune 500 HQ in TX)
| Industry | F500 HQs | Revenue |
|---|---|---|
| Energy | 16 | $1,198B |
|
||
| Technology | 5 | $198B |
|
||
| Engineering / Construction | 4 | $72B |
|
||
| Energy Services | 3 | $60B |
|
||
| Utilities | 3 | $41B |
|
||
| Healthcare | 2 | $330B |
|
||
Price history
-4.8% since first listed5 events — show timeline
- 2026-06-09 Price Changed $255,490 NTREIS
- 2026-06-05 Price Changed $259,490 NTREIS
- 2026-05-28 Price Changed $268,490 NTREIS
- 2026-05-13 Price Changed $266,490 NTREIS
- 2026-04-27 Listed $268,490 NTREIS
Cash-flow waterfall
monthlySold comps — $/sqft
last 12 mo · ≤1 miLoading sold comps…