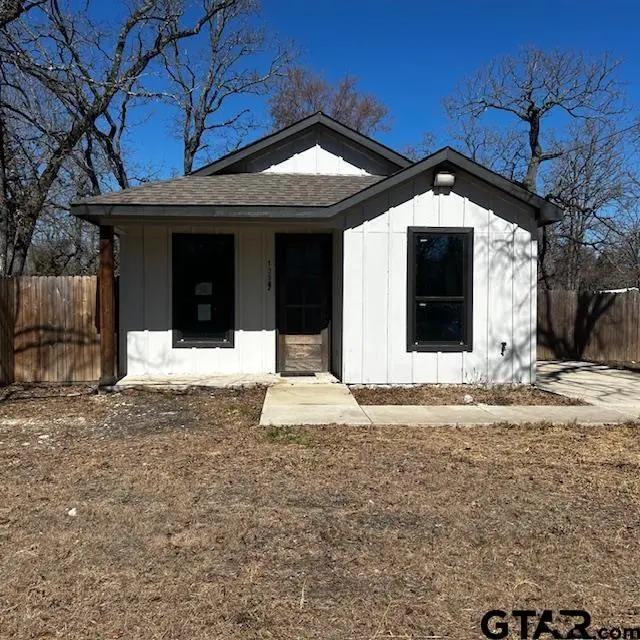
13982 E Travis Ln · Log Cabin, TX
Flood risk No data
- FEMA flood zone
- —
- Chance of flooding over 30 yrs
- —
- Est. flood insurance / yr
- —
Fire risk No data
- Est. fire insurance / yr
- —
Heat risk No data
- Hot days now (above threshold)
- —
- Hot days in 30 yrs
- —
Wind risk No data
- Chance of severe wind over 30 yrs
- —
Air-quality risk No data
- Unhealthy air days now
- —
- Unhealthy air days in 30 yrs
- —
Risk factors via First Street. Map © Google.
Why this score? — see what drove the B+ grade
The composite is a weighted blend of 9 inputs, each scored 0–100. Each bar is that input's sub-score; the figure is the points it added to the 100-point composite (weight × sub-score).
- Cash flow +30.0/30.0
- ARV discount +15.0/15.0
- 1% rule +10.0/10.0
- DSCR +10.0/10.0
- Schools +3.2/10.0
- Rent growth +2.5/5.0
- Condition / age +2.5/5.0
- Livability +1.9/5.0
- Appreciation +0.0/10.0
$90,000
🖨 Deal sheet 📄 Offer letter ✓ Due diligence
Listing remarks MLS
Modern living awaits in this 2022-built home! Featuring 3 bedrooms and 2 baths, this property offers a clean, contemporary aesthetic and a fenced backyard. Perfect for those seeking a fresh start in Log Cabin TX. Exceptional value at $90,000. Don’t miss this incredible opportunity!
Key facts
- Modern living
- Fenced backyard
- 1,091 sq ft lot
Tags
Neighborhood map
What this means for you Summary
Snapshot
- This is a 3-bed/2.0-bath manufactured listed at $90k.
Deal economics
- At list price, monthly cash flow is $1k ($13k/yr) — positive.
- The deal already cash-flows at list — no discount required.
- Meets the 1% rule at list price ($2k rent vs $90k).
- Recommended offer: $89k (1.5% below list) — sets the bar for market timing.
- Cap rate 20.9% vs local median 0.9% in Log Cabin — top-decile yield for the area; either an underpriced asset or a hidden risk that comps aren't pricing in. Stress-test before assuming the spread holds.
Location & tenants
- Location reads 38/100 on livability (#1,626 in TX) — a limited-amenity area; tenant pool skews transient or value-seeking. Strengths: cost of living A+, crime A; Watch: amenities F, commute F, employment F.
- Eustace ISD (rural): math 32% / reading 45% proficiency, ranked #455 of 826 in TX (top 55%) — families likely to look elsewhere, expect single-tenant / working-renter base with shorter leases; 62% free/reduced lunch — lower-income household profile, screen leases tightly.
- Zoned schools: Eustace Pri (497 students, 74% FRL).
- Market conditions: 225 active listings in the ZIP; 1 comparable units currently listed for rent nearby; 263 units permitted in Henderson County in 2024 (0 in 5+ unit buildings).
Forward outlook
- Local home prices are declining (-3.0%/yr); year-one equity from $622 of loan paydown is wiped out by about $3k of value loss. Plan a longer hold.
- At projected returns (-3.0% appreciation + 3.0% rent growth), your $25k cash investment doubles in ~3 years — after that, you're playing with house money.
Negotiation context
- It's been on market 15 days — a 2% lower offer ($89k) is reasonable based on typical stale-listing flexibility.
- 2 sale attempts with the ask held roughly flat each time — persistent listings suggest the price (not the market) is what's stuck; bring a comps-based counter.
Risks & watch-outs
- Watch-outs: property tax is 3.9% of price.
Questions for the listing agent
- Property tax is high relative to price — has the assessment been appealed recently, and will the sale trigger a re-assessment?
- Is there a deadline driving the sale (1031 exchange, divorce, estate, relocation)? That informs how much negotiation room exists.
- Schools are F-rated, which usually means shorter tenancies and higher turnover. Who's the typical renter profile here, and what's been the actual vacancy rate?
- What's the average days-on-market for RENTAL listings here right now (not sales)? A rising rental-DOM trend means longer vacancies and softer asking-rent achievability than the comps imply.
- What's the recent tenant-quality profile in this submarket — average credit score on applications, eviction rate, late-payment / NSF rate, and stable-employment percentage? A property-management company in the area should have these aggregated.
- How much new for-sale + rental construction is in the pipeline within 1–3 miles? Heavy new supply typically softens prices + rents 12–24 months out; constrained supply supports both.
Investment metrics
- 1% rule
- 2.67% ✓
- Cap rate
- 20.92%
- Cash-on-cash
- 52.25%
- DSCR
- 3.33
- GRM
- 3.1
CMA / ARV
- ARV (on-the-fly)
- $126,000
- Comps found
- 3
Show comp detail 3 sales within ~0.75 mi
| Address | Dist | Beds/Ba | Sqft | Sold | Price | $/sf | Match |
|---|---|---|---|---|---|---|---|
| 132 Kings Row | 0.38mi | 3/2.0 | 1,680 (-7%) | 16mo | $165,000 | $98 | 58 |
| 5001 Connie Ln | 0.68mi | 4/2.0 (+1) | 1,792 (-0%) | 6mo | $125,000 | $70 | 57 |
| 5233 Sam Houston | 0.54mi | 3/2.0 | 1,592 (-12%) | 1mo | $84,900 | $53 | 55 |
Match score weights: distance 35% · size 25% · config 20% · recency 20%. Top-matched comps best support the ARV.
Projected returns pro-forma
-3.0% appreciation · 3.0% rent growth · sell at horizon
- IRR
- 50.3%
- Equity multiple
- 3.20×
- Total profit
- $55,451
- Equity at exit
- $13,419
- IRR
- 55.7%
- Equity multiple
- 6.51×
- Total profit
- $138,868
- Equity at exit
- $7,782
Cash invested: $25,200 (down + closing). Projections, not guarantees.
Landlord ↔ Tenant lean methodology
- Overall (STATE)
- 87 Strongly Landlord-Friendly
- State Texas
- 87 Strongly Landlord-Friendly · R+5
- County
- — inherits STATE
- City
- — inherits STATE
ZIP-level market 75148
- Home prices YoY
- -27.6%
- Active inventory
- 225
- Price-to-rent
- 3.1×
Monthly cashflow live
- Estimated rent
- $2,400 medium interval (Pro) →
- Mortgage (P&I)
- −$472
- Tax from tax record
- −$289 /mo · $3,470/yr
- Insurance
- −$38
- HOA
- −$0
- Vacancy / Maint / Mgmt
- −$504
- Net cashflow
- $1,097
Break-even live
UW: 25.0% down · 7.5% · 30yr · 1.5% tax · 5.0% vac · 8.0% maint · 8.0% mgmt
Financing live
Cash to close
- Down payment
- $22,500
- Closing costs
- $2,700
- Reserves months
- —
- Total cash needed
- —
Loan-product check · same deal, 3 products live
Conventional
25% down · 7.5% · 30yr
- Down + closing
- —
- Monthly P&I
- —
- Monthly cashflow
- —
- DSCR
- —
- Eligible?
- —
Personal DTI + credit; lowest rate.
DSCR
20% down · 8.5% · 30yr
- Down + closing
- —
- Monthly P&I
- —
- Monthly cashflow
- —
- DSCR
- —
- Eligible?
- —
No personal income docs; deal must DSCR.
Hard money
10% down · 12.0% · 12mo
- Down + closing
- —
- Monthly P&I
- —
- Monthly cashflow
- —
- DSCR
- —
- Eligible?
- —
Short-term bridge; refi at stabilization.
Rent comps 1 comps
| Address | Beds | Baths | Sqft | Rent | $/sqft | DOM | Units | Dist |
|---|---|---|---|---|---|---|---|---|
| 5320 Loma Vis Malakoff, TX | 2.0 | 2.0 | 1324 | $2,400 | $1.81 | 43d | 1 | 1.35mi |
Listing history 6 events
-
2026-04-05status Pending
-
2026-03-23historical Active Option Contract
Show marketing remark (289 chars)
Modern living awaits in this 2022-built home! Featuring 3 bedrooms and 2 baths, this property offers a clean, contemporary aesthetic and a fenced backyard. Perfect for those seeking a fresh start in Log Cabin TX. Exceptional value at $90,000. Don’t miss this incredible opportunity!
-
2026-03-23status Pending 289-char remark
Show marketing remark (289 chars)
Modern living awaits in this 2022-built home! Featuring 3 bedrooms and 2 baths, this property offers a clean, contemporary aesthetic and a fenced backyard. Perfect for those seeking a fresh start in Log Cabin TX. Exceptional value at $90,000. Don’t miss this incredible opportunity!
-
2026-03-16$90,000 Active 289-char remark
Show marketing remark (289 chars)
Modern living awaits in this 2022-built home! Featuring 3 bedrooms and 2 baths, this property offers a clean, contemporary aesthetic and a fenced backyard. Perfect for those seeking a fresh start in Log Cabin TX. Exceptional value at $90,000. Don’t miss this incredible opportunity!
-
2026-03-15$90,000 Active
-
2021-04-27soldstatus
ⓘ Source: listings_history table (triggers on properties + properties_extension) + one-shot
backfill from property_details.listing_events for pre-trigger history.
Tax reassessment forecast TX · Resets to sale price
- Current annual tax
- $3,470 · $289/mo
- Projected year-2 tax
- $3,470 · $289/mo
- Expected delta
- $0/yr ($0/mo · 0.0%)
ⓘ Screening estimate from a state-policy table — verify with the county assessor before closing.
Nearby sold comps map
Loading sold comps map…
Walkable amenities ~0.75 mi
Loading nearby amenities…
Taxation est. · year 1
- Rental income
- $28,800
- − Mortgage interest
- −$5,041
- − Property taxes
- −$3,470
- − Insurance
- −$450
- − Repairs & maintenance
- −$2,304
- − Management
- −$2,304
- − Depreciation
- −$2,618
- Taxable income
- $12,612
- Est. tax owed @ 24.0%
- −$3,027
- After-tax cash flow
- $10,141/yr
For passive investors: Depreciation is non-cash, so a rental often shows a tax loss while cash-flowing — sheltering income. Rental losses are passive: they offset passive income freely, and up to $25,000/yr can offset ordinary (W-2) income if you actively participate and your MAGI is under $100k (phasing out to $0 by $150k); unused losses carry forward. On sale, claimed depreciation is recaptured at up to 25%, and gains may owe capital-gains tax (a 1031 exchange can defer both). Figures are a year-1 estimate at your 24.0% rate — not tax advice; consult a CPA.
Schools (NCES district)
- District
- Eustace ISD
- NCES district ID
- 4818720
- Math proficiency
- 32% ▼ -18.00%
- Reading proficiency
- 45% ▼ -7.00%
- Median HH income
- $42,425
- Composite
- 32.48/100
- National rank
- #5711
- State rank
- #455 of 826 in TX
Livability — Log Cabin
- Score
- 38/100
- State rank
- #1626
- US rank
- #27499
Category grades
Schools grade is shown separately in the Schools card above.
Census & demographics
- Census place
- Log Cabin, TX
- Population (ZIP)
- 5,944
Population outlook (Henderson County) Hauer SSP2
- Today (2025)
- 80,471 people
- By 2030
- 80,608 · +0.2%
- By 2040
- 80,087 · -0.5%
- By 2050
- 78,208 · -2.8%
- By 2075
- 72,423 · -10.0%
- By 2100
- 61,012 · -24.2%
Race, ethnicity, and origin ACS 2023
- Neighborhood character
- Predominantly White (71%)
- Race & ethnicity
- White 71% Two or more races 11% Hispanic / Latino 11% Black 11%
- Hispanic origin (detail)
- Mexican 10%
- Common ancestry
- Russian 2% Slovak 2% Italian 1%
- Foreign-born
- 5% · Canada
- Languages at home
- 92% English-only · Spanish 8%
Political lean MEDSL · Henderson
- 2024 margin
- Solid R (+63.5) · D 18.0% · R 81.4%
- 2008→2024 swing
- -18.8pp toward R · 2008: -44.6pp · 2024: -63.5pp
- All cycles
- 2024: R+63.5 2020: R+60.2 2016: R+60.0 2012: R+54.8 2008: R+44.6
Not yet ingested
- Civics
- —
Market trends
- HPI YoY
- ▼ -82.76%
- Current HPI
- 217.1629
- Rent YoY
- —
- Metro
- —
- State GDP YoY
- ▲ 3.95%
- F500 in state
- 110
Industry mix (Fortune 500 HQ in TX)
| Industry | F500 HQs | Revenue |
|---|---|---|
| Energy | 16 | $1,198B |
|
||
| Technology | 5 | $198B |
|
||
| Engineering / Construction | 4 | $72B |
|
||
| Energy Services | 3 | $60B |
|
||
| Utilities | 3 | $41B |
|
||
| Healthcare | 2 | $330B |
|
||
Price history
+0.0% since first listed6 events — show timeline
- 2026-04-05 Pending — NTREIS
- 2026-03-23 Contingent — NTREIS
- 2026-03-23 Pending — GTAR
- 2026-03-16 Listed $90,000 GTAR
- 2026-03-15 Listed $90,000 NTREIS
- 2021-04-27 Sold (Public Records) — Public Records
Property tax history
+52.9%/yrLatest (2025): $3,470 · +4.3% YoY. Source: county tax records.
Cash-flow waterfall
monthlySold comps — $/sqft
last 12 mo · ≤1 miLoading sold comps…