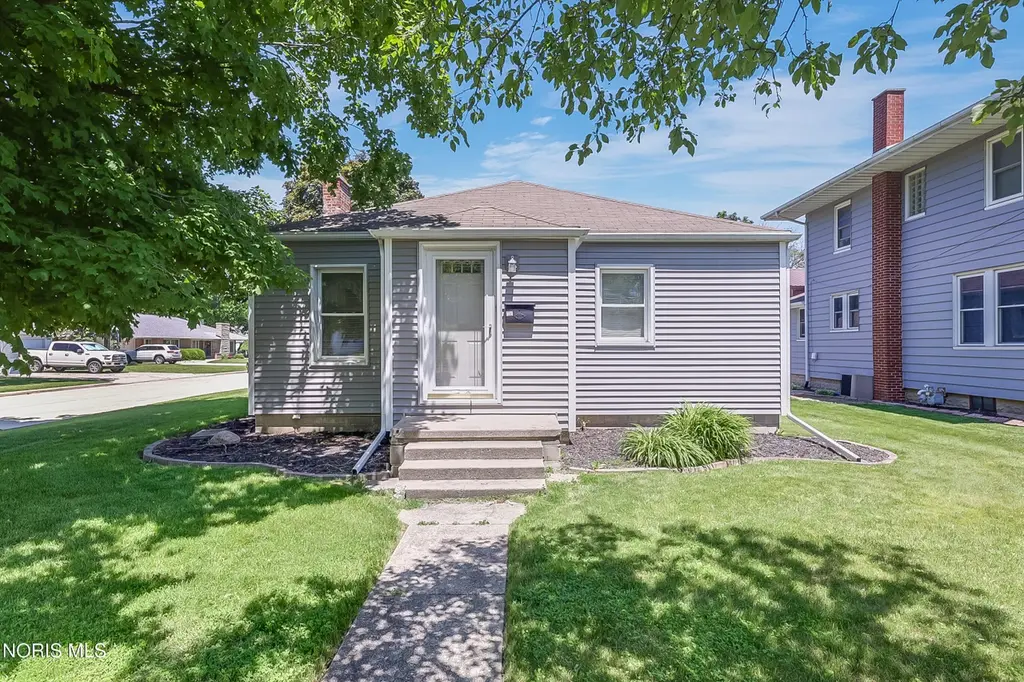
406 Stryker St · Archbold, OH
Flood risk 1/10 · Minimal
- FEMA flood zone
- X (unshaded)
- Chance of flooding over 30 yrs
- 0.0%
- Est. flood insurance / yr
- $473 – $860
Fire risk 1/10 · Minimal
- Est. fire insurance / yr
- $713 – $1,323
Heat risk 3/10 · Minor
- Hot days now (above 99°F)
- 7 days/yr
- Hot days in 30 yrs
- 17 days/yr
Wind risk 2/10 · Minimal
- Chance of severe wind over 30 yrs
- —
Air-quality risk 2/10 · Minimal
- Unhealthy air days now
- 1 days/yr
- Unhealthy air days in 30 yrs
- 3 days/yr
Risk factors via First Street. Map © Google.
Why this score? — see what drove the C- grade
The composite is a weighted blend of 9 inputs, each scored 0–100. Each bar is that input's sub-score; the figure is the points it added to the 100-point composite (weight × sub-score).
- ARV discount +15.0/15.0
- Cash flow +13.1/30.0
- Schools +6.6/10.0
- DSCR +3.9/10.0
- Livability +3.8/5.0
- 1% rule +3.1/10.0
- Rent growth +2.5/5.0
- Condition / age +2.5/5.0
- Appreciation +0.0/10.0
$135,000
🖨 Deal sheet (PDF) 📄 Offer letter ✓ Due diligence
Listing remarks
Welcome home to this charming and affordable 3-bedroom, 1-bath home located in the heart of Archbold! Full of character and curb appeal, this cozy home is the perfect opportunity for first-time buyers, those looking to downsize, or anyone seeking low-maintenance living. Inside, you'll find a comfortable layout with plenty of natural light and a warm, inviting feel throughout. The manageable yard offers space to relax, garden, or entertain, while the convenient location puts you close to schools, parks, shopping, and local amenities. Don't miss this chance to own an adorable home in a great community at an affordable price!
Key facts
- Close to parks
- Close to schools
- Manageable yard
Tags
Property features AI
Finance
- Other: Has basement
Exterior
- Parking: Attached garage; Garage with 1 space; Alley access; Concrete parking/driveway
- Utilities: Cable connected; Electricity connected; Public sewer; Public water; Internet connected
- Home design: Single family residence; One story / single-level; No common walls; Detached (not attached to other units)
- Construction: Block foundation; Block construction; Foam insulation; Vinyl siding
- Exterior features: Shingle roof
Interior
- Kitchen: Dishwasher; Electric oven; Refrigerator
- Bedrooms: Bedroom 2 (Main level); Bedroom 3 (Main level)
- Flooring: Carpet; Hardwood; Linoleum
- Bathrooms: 1 full bathroom
- Heating & cooling: Baseboard heating; Natural gas heating; Radiant heating; Boiler; Window cooling units
- Interior features: Dual closets; Roll-in shower; Entrance foyer; Dining room; Living room
- Laundry & utility: Stacked washer/dryer; Accessible laundry/utilities; Laundry on main level; Laundry in basement
Neighborhood map
What this means for you Summary
Snapshot
- This is a 3-bed/1.0-bath single-family listed at $135k.
Deal economics
- At list price, monthly cash flow is $-5 ($-63/yr) — negative.
- To cash-flow at today's rent, offer at most $134k (0.7% below list).
- To meet the 1% rule (rent ≥ 1% of price), the offer needs to be $110k (18.5% below list).
- Recommended offer: $110k (18.5% below list) — sets the bar for 1% rule.
Location & tenants
- Location reads 76/100 on livability (#237 in OH, #3,767 nationally) — a middle-class / working-renter tenant base. Strengths: crime A+, cost of living A+, housing A+; Watch: amenities F, commute F, health & safety F.
- Archbold-Area Local (town): math 75% / reading 79% proficiency, ranked #77 of 656 in OH (top 12%) — strong family-tenant draw, lease renewals of 3-5y typical.
- Zoned schools: Archbold Elementary School (math 87% / reading 82%, grade A+, #68 of 1,584 statewide, top 6%, 431 students, 27% FRL); Archbold Middle School (math 74% / reading 78%, grade A, #74 of 654 statewide, top 12%, 392 students, 21% FRL); Archbold High School (math 57% / reading 77%, grade B, #137 of 781 statewide, top 19%, 333 students, 20% FRL) — zoned schools at 23% FRL track the district average.
- Market conditions: 13 active listings in the ZIP; 1 comparable units currently listed for rent nearby; 24 units permitted in Fulton County in 2024 (0 in 5+ unit buildings).
Forward outlook
- Local home prices are declining (-3.0%/yr); year-one equity from $933 of loan paydown is wiped out by about $4k of value loss. Plan a longer hold.
- Fulton County population projected at -14% by 2050 — secular population decline; favor cash flow + early exit over multi-decade hold.
Negotiation context
- Only 5 days on market — expect competitive offers; lowballing is unlikely to land.
- Current owner paid $89k; list at $135k implies a 52% gain — meaningful room to come down on a strong offer.
Risks & watch-outs
- Watch-outs: built in 1950 — expect roof / HVAC / electrical / plumbing capex.
Questions for the listing agent
- What do current leases actually rent for vs. the listed asking? Can we see a recent rent roll and the last 12 months of T-12 income?
- Built in 1950 — when were the roof, HVAC, electrical panel, plumbing, and water heater last replaced?
- Is there a deadline driving the sale (1031 exchange, divorce, estate, relocation)? That informs how much negotiation room exists.
- Schools are A-rated — typically a magnet for longer-tenancy family renters. What's the average tenant stay here, and is there a school-zone premium baked into asking?
- What's the average days-on-market for RENTAL listings here right now (not sales)? A rising rental-DOM trend means longer vacancies and softer asking-rent achievability than the comps imply.
- What's the recent tenant-quality profile in this submarket — average credit score on applications, eviction rate, late-payment / NSF rate, and stable-employment percentage? A property-management company in the area should have these aggregated.
- How much new for-sale + rental construction is in the pipeline within 1–3 miles? Heavy new supply typically softens prices + rents 12–24 months out; constrained supply supports both.
Investment metrics
- 1% rule
- 0.81% ✗
- Cap rate
- 6.25%
- Cash-on-cash
- -0.17%
- DSCR
- 0.99
- GRM
- 10.2
CMA / ARV
- ARV (on-the-fly)
- $205,840
- Comps found
- 12
Show comp detail 12 sales within ~0.75 mi
| Address | Dist | Beds/Ba | Sqft | Sold | Price | $/sf | Match |
|---|---|---|---|---|---|---|---|
| 302 Degroff Ave | 0.28mi | 3/1.0 | 1,200 (-3%) | 8mo | $202,500 | $169 | 75 |
| 300 Degroff Ave | 0.27mi | 3/1.0 | 1,148 (-7%) | 2mo | $190,000 | $166 | 74 |
| 203 Degroff Ave | 0.16mi | 2/1.0 (-1) | 1,218 (-2%) | 16mo | $230,000 | $189 | 71 |
| 408 Ditto St | 0.43mi | 2/1.0 (-1) | 1,196 (-4%) | 2mo | $195,000 | $163 | 68 |
| 800 Walnut St | 0.30mi | 3/2.0 | 1,118 (-10%) | 1mo | $227,000 | $203 | 64 |
| 208 Vine St | 0.46mi | 3/1.5 | 1,152 (-7%) | 1mo | $226,000 | $196 | 64 |
| 217 Degroff Ave | 0.26mi | 2/1.0 (-1) | 1,140 (-8%) | 14mo | $167,000 | $146 | 58 |
| 406 Park St | 0.22mi | 2/1.0 (-1) | 1,392 (+12%) | 8mo | $125,000 | $90 | 58 |
| 301 S Defiance St | 0.44mi | 4/2.0 (+1) | 1,316 (+6%) | 13mo | $165,000 | $125 | 49 |
| 211 E Williams St | 0.53mi | 3/1.0 | 1,170 (-6%) | 20mo | $175,000 | $150 | 49 |
| 411 Clover Ln | 0.72mi | 3/2.0 | 1,316 (+6%) | 7mo | $225,000 | $171 | 46 |
| 217 Linda Ct | 0.73mi | 3/2.0 | 1,267 (+2%) | 18mo | $185,000 | $146 | 43 |
Match score weights: distance 35% · size 25% · config 20% · recency 20%. Top-matched comps best support the ARV.
Projected returns pro-forma
-3.0% appreciation · 3.0% rent growth · sell at horizon
- IRR
- -16.6%
- Equity multiple
- 0.41×
- Total profit
- $-22,227
- Equity at exit
- $20,129
- IRR
- -8.4%
- Equity multiple
- 0.47×
- Total profit
- $-19,862
- Equity at exit
- $11,672
Cash invested: $37,800 (down + closing). Projections, not guarantees.
Landlord ↔ Tenant lean methodology
- Overall (STATE)
- 73 Landlord-Friendly
- State Ohio
- 73 Landlord-Friendly · R+6
- County
- — inherits STATE
- City
- — inherits STATE
ZIP-level market 43502
- Home prices YoY
- -20.6%
- Active inventory
- 13
- Price-to-rent
- 10.2×
Monthly cashflow live
- Estimated rent
- $1,100 medium interval (Pro) →
- Mortgage (P&I)
- −$708
- Tax from tax record
- −$110 /mo · $1,320/yr
- Insurance
- −$56
- HOA
- −$0
- Lot rent
- −$0
- Vacancy / Maint / Mgmt
- −$231
- Net cashflow
- $-5
Break-even live
Sensitivity live
| Price | -10% $71 | -5% $33 | +0% $-5 | +5% $-43 | +10% $-82 |
|---|---|---|---|---|---|
| Rent | -10% $-92 | -5% $-49 | +0% $-5 | +5% $38 | +10% $82 |
| Rate | -1.0pp $63 | -0.5pp $29 | base $-5 | +0.5pp $-40 | +1.0pp $-76 |
UW: 25.0% down · 7.5% · 30yr · 1.5% tax · 5.0% vac · 8.0% maint · 8.0% mgmt
Financing live
Cash to close
- Down payment
- $33,750
- Closing costs
- $4,050
- Reserves months
- —
- Total cash needed
- —
Loan-product check · same deal, 3 products live
Conventional
25% down · 7.5% · 30yr
- Down + closing
- —
- Monthly P&I
- —
- Monthly cashflow
- —
- DSCR
- —
- Eligible?
- —
Personal DTI + credit; lowest rate.
DSCR
20% down · 8.5% · 30yr
- Down + closing
- —
- Monthly P&I
- —
- Monthly cashflow
- —
- DSCR
- —
- Eligible?
- —
No personal income docs; deal must DSCR.
Hard money
10% down · 12.0% · 12mo
- Down + closing
- —
- Monthly P&I
- —
- Monthly cashflow
- —
- DSCR
- —
- Eligible?
- —
Short-term bridge; refi at stabilization.
Rent comps 1 comps
| Address | Beds | Baths | Sqft | Rent | $/sqft | DOM | Units | Dist |
|---|---|---|---|---|---|---|---|---|
| 709 E Lutz Rd Archbold, OH | 2.0 | 1.0 | 950 | $1,100 | $1.16 | 25d | 1 | 1.13mi |
Listing history 8 events
-
2026-06-22days on market $135,000 Active 5 DOM
-
2026-06-21days on market $135,000 Active 4 DOM
-
2026-06-21days on market $135,000 Active 3 DOM
-
2026-06-17statusdays on market $135,000 Active 1 DOM
-
2026-06-16days on market $135,000 Coming Soon 3 DOM
-
2026-06-15days on market $135,000 Coming Soon 2 DOM
-
2026-06-13remarks 630-char remark
-
2026-06-13$135,000 Coming Soon 1 DOM
ⓘ Source: listings_history table (triggers on properties + properties_extension) + one-shot
backfill from property_details.listing_events for pre-trigger history.
Tax reassessment forecast OH · Partial reset (capped growth)
- Current annual tax
- $1,320 · $110/mo
- Projected year-2 tax
- $1,713 · $143/mo
- Expected delta
- +$393/yr (+$33/mo · 29.8%)
ⓘ Screening estimate from a state-policy table — verify with the county assessor before closing.
Climate risk First Street
- Flood 1/10 Low FEMA zone X (unshaded) · 0% chance over 30 yrs
- Wildfire 1/10 Low
- Heat 3/10 Moderate 7 d/yr ≥99°F today · 17 d/yr by 30 yrs out
- Wind 2/10 Low
- Air quality 2/10 Low 1 unhealthy d/yr today · 3 by 30 yrs out
Nearby sold comps map
Loading sold comps map…
Walkable amenities ~0.75 mi
Loading nearby amenities…
Taxation est. · year 1
- Rental income
- $13,200
- − Mortgage interest
- −$7,562
- − Property taxes
- −$1,320
- − Insurance
- −$675
- − Repairs & maintenance
- −$1,056
- − Management
- −$1,056
- − Depreciation
- −$3,927
- Taxable loss
- −$2,396
- Est. tax savings @ 24.0%
- +$575
- After-tax cash flow
- $513/yr
For passive investors: Depreciation is non-cash, so a rental often shows a tax loss while cash-flowing — sheltering income. Rental losses are passive: they offset passive income freely, and up to $25,000/yr can offset ordinary (W-2) income if you actively participate and your MAGI is under $100k (phasing out to $0 by $150k); unused losses carry forward. On sale, claimed depreciation is recaptured at up to 25%, and gains may owe capital-gains tax (a 1031 exchange can defer both). Figures are a year-1 estimate at your 24.0% rate — not tax advice; consult a CPA.
Schools (NCES district)
- District
- Archbold-Area Local
- NCES district ID
- 3904704
- Math proficiency
- 75% ▼ -10.00%
- Reading proficiency
- 79% ▼ -1.00%
- Median HH income
- $55,424
- Composite
- 65.68/100
- National rank
- #460
- State rank
- #77 of 656 in OH
Livability — Archbold
- Score
- 76/100
- State rank
- #237
- US rank
- #3767
Category grades
Schools grade is shown separately in the Schools card above.
Census & demographics
- Census place
- Archbold, OH
- County
- Fulton · 33,657 people
- Metro
- Toledo, OH
- Population (ZIP)
- 6,916
- Household income
- $72,025
- Rent vs Own
- Severe rent burden
- 5.5
Population outlook (Fulton County) Hauer SSP2
- Today (2025)
- 41,958 people
- By 2030
- 41,130 · -2.0%
- By 2040
- 38,760 · -7.6%
- By 2050
- 36,040 · -14.1%
- By 2075
- 30,793 · -26.6%
- By 2100
- 25,429 · -39.4%
Race, ethnicity, and origin ACS 2023
- Neighborhood character
- Predominantly White (85%)
- Race & ethnicity
- White 85% Hispanic / Latino 12% Two or more races 5% Black 1%
- Hispanic origin (detail)
- Mexican 7% Puerto Rican 5%
- Common ancestry
- Iranian 3% Lithuanian 3% Italian 2%
- Foreign-born
- 3% · Canada
- Languages at home
- 95% English-only · Spanish 5%
Political lean MEDSL · Fulton
- 2024 margin
- Solid R (+42.4) · D 28.4% · R 70.8%
- 2008→2024 swing
- -34.3pp toward R · 2008: -8.1pp · 2024: -42.4pp
- All cycles
- 2024: R+42.4 2020: R+39.8 2016: R+36.0 2012: R+13.2 2008: R+8.1
Not yet ingested
- Civics
- —
Market trends
- HPI YoY
- ▼ -55.33%
- Current HPI
- 213.6316
- Rent YoY
- —
- Metro
- —
- State GDP YoY
- ▲ 1.98%
- F500 in state
- 48
Industry mix (Fortune 500 HQ in OH)
| Industry | F500 HQs | Revenue |
|---|---|---|
| Insurance | 3 | $145B |
|
||
| Industrial Machinery | 3 | $49B |
|
||
| Financial Services | 3 | $24B |
|
||
| Consumer Goods | 2 | $93B |
|
||
| Aerospace / Defense | 2 | $47B |
|
||
| Utilities | 2 | $33B |
|
||
Price history
+193.5% since first listed4 events — show timeline
- 2026-06-13 Coming Soon $135,000 NORIS
- 2002-07-31 Sold (Public Records) $89,000 Public Records
- 1995-06-30 Sold (Public Records) $60,000 Public Records
- 1993-07-20 Sold (Public Records) $46,000 Public Records
Property tax history
+6.4%/yrLatest (2025): $1,320 · -2.0% YoY. Source: county tax records.
Cash-flow waterfall
monthlySold comps — $/sqft
last 12 mo · ≤1 miLoading sold comps…