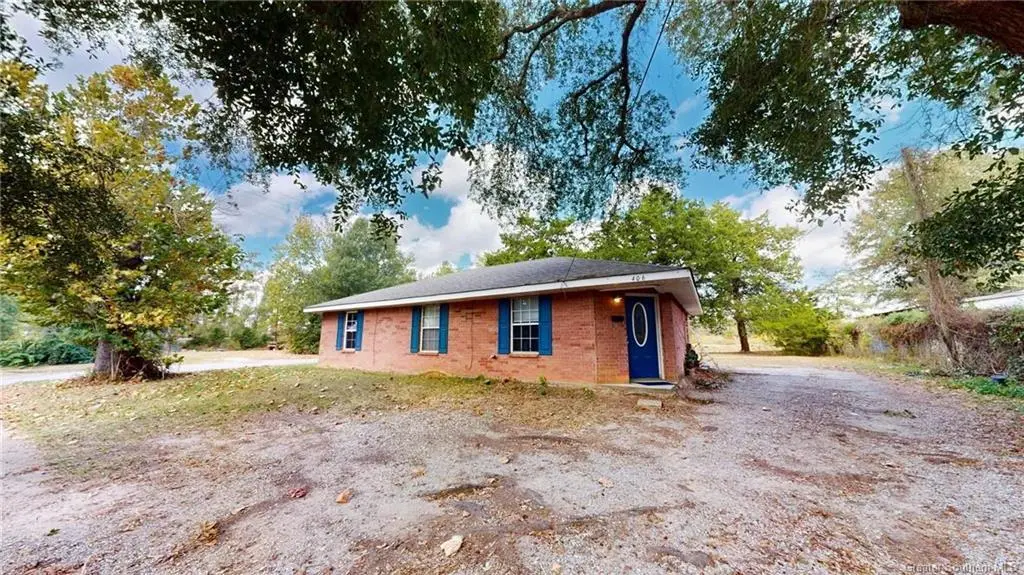
406 W Velmer St W · DeQuincy, LA
Flood risk 1/10 · Minimal
- FEMA flood zone
- X (unshaded)
- Chance of flooding over 30 yrs
- 0.0%
- Est. flood insurance / yr
- $507 – $1,088
Fire risk 3/10 · Minor
- Est. fire insurance / yr
- $1,269 – $2,357
Heat risk 9/10 · Severe
- Hot days now (above 110°F)
- 7 days/yr
- Hot days in 30 yrs
- 23 days/yr
Wind risk 9/10 · Severe
- Chance of severe wind over 30 yrs
- 99.0%
Air-quality risk 2/10 · Minimal
- Unhealthy air days now
- 1 days/yr
- Unhealthy air days in 30 yrs
- 1 days/yr
Risk factors via First Street. Map © Google.
Why this score? — see what drove the D grade
The composite is a weighted blend of 9 inputs, each scored 0–100. Each bar is that input's sub-score; the figure is the points it added to the 100-point composite (weight × sub-score).
- Cash flow +16.4/30.0
- DSCR +5.1/10.0
- ARV discount +4.2/15.0
- Livability +3.6/5.0
- 1% rule +3.3/10.0
- Schools +3.1/10.0
- Rent growth +2.5/5.0
- Condition / age +2.5/5.0
- Appreciation +0.0/10.0
$124,000
🖨 Deal sheet (PDF) 📄 Offer letter ✓ Due diligence
Listing remarks
OWNER FINANCING IS AVAILABLE! This 3-bedroom, 2-bathroom home is nestled on an expansive lot just outside city limits, offering a perfect blend of peaceful, rural living with easy access to urban conveniences. This home is in Flood Zone X, which means flood insurance is typically not needed. Home qualifies for Rural Development loan and for downpayment assistance loan with LHC for qualified buyers.
Key facts
- 6,098 sq ft lot
- Built 2002
- Listed 13 days
Property features AI
Exterior
- Parking: Driveway with open parking
- Utilities: Public water; Public sewer; Electricity connected; Water connected
- Home design: Single-family residence; One story; House with no common walls; Residential zoning
- Construction: Brick construction; Shingle roof; Slab foundation; Built as a house
- Exterior features: Corner lot; Paved city street frontage; Has a view; No pool or spa
Interior
- Kitchen: Electric oven; Electric range; Water heater
- Bedrooms: 3 bedrooms on the main level
- Bathrooms: 2 full bathrooms (2 on the main level)
- Heating & cooling: Central heating; Central air; Ceiling fan(s)
- Interior features: Ceiling fan(s)
- Laundry & utility: Laundry located in the kitchen
Neighborhood map
What this means for you Summary
Snapshot
- This is a 3-bed/2.0-bath single-family listed at $124k.
Deal economics
- At list price, monthly cash flow is $70 ($845/yr) — positive.
- The deal already cash-flows at list — no discount required.
- To meet the 1% rule (rent ≥ 1% of price), the offer needs to be $103k (16.9% below list).
- Recommended offer: $103k (16.9% below list) — sets the bar for 1% rule.
- Cap rate 7.0% vs local median 5.6% in DeQuincy — meaningfully above typical; check what's discounted (condition, days-on-market, listing class) to confirm the premium yield is real.
Location & tenants
- Location reads 71/100 on livability (#51 in LA) — a middle-class / working-renter tenant base. Strengths: cost of living A+, housing A+, health & safety A; Watch: amenities F, commute F.
- Calcasieu Parish (other): math 30% / reading 44% proficiency, ranked #29 of 98 in LA (top 30%) — families likely to look elsewhere, expect single-tenant / working-renter base with shorter leases.
- Zoned schools: Dequincy Primary School (260 students, 70% FRL); Dequincy Middle School (math 13% / reading 32%, grade F, #151 of 218 statewide, top 70%, 212 students, 58% FRL); Dequincy High School (math 22% / reading 47%, grade F, #106 of 265 statewide, top 43%, 324 students, 46% FRL).
- Market conditions: 107 active listings in the ZIP; 1,298 units permitted in Calcasieu Parish in 2024 (526 in 5+ unit buildings).
Forward outlook
- Local home prices are declining (-3.0%/yr); year-one equity from $857 of loan paydown is wiped out by about $4k of value loss. Plan a longer hold.
- Calcasieu County population projected at +11% by 2050 — modest demand growth; plan on rents tracking national, not racing it.
Negotiation context
- Only 13 days on market — expect competitive offers; lowballing is unlikely to land.
- Current owner paid $4k; list at $124k implies a 3443% gain — meaningful room to come down on a strong offer.
Risks & watch-outs
- Climate carrying-cost: severe wind risk, 99% chance of damaging wind over 30y; extreme-heat days projected 7→23/yr by 2055 (HVAC capex compounding) — expect insurance premiums to compound above CPI over the hold.
Questions for the listing agent
- Is there a deadline driving the sale (1031 exchange, divorce, estate, relocation)? That informs how much negotiation room exists.
- Schools are B-rated — typically a magnet for longer-tenancy family renters. What's the average tenant stay here, and is there a school-zone premium baked into asking?
- The area grade is low — what's the realistic commute time and amenity access for the typical tenant pool here? Any planned neighborhood developments (good or bad) we should know about?
- What's the average days-on-market for RENTAL listings here right now (not sales)? A rising rental-DOM trend means longer vacancies and softer asking-rent achievability than the comps imply.
- What's the recent tenant-quality profile in this submarket — average credit score on applications, eviction rate, late-payment / NSF rate, and stable-employment percentage? A property-management company in the area should have these aggregated.
- How much new for-sale + rental construction is in the pipeline within 1–3 miles? Heavy new supply typically softens prices + rents 12–24 months out; constrained supply supports both.
Investment metrics
- 1% rule
- 0.83% ✗
- Cap rate
- 6.97%
- Cash-on-cash
- 2.43%
- DSCR
- 1.11
- GRM
- 10.0
CMA / ARV
- ARV (median comp)
- $115,445
- List price
- $124,000
- Delta
- 7.84%
- Verdict
- FAIR
- Comps
- 6 within 1.0 mi
Show comp detail 3 sales within ~0.75 mi
| Address | Dist | Beds/Ba | Sqft | Sold | Price | $/sf | Match |
|---|---|---|---|---|---|---|---|
| 306 Coffee St | 0.10mi | 2/1.0 (-1) | 1,139 (+3%) | 2mo | $100,000 | $88 | 80 |
| 309 S Perkins St S | 0.09mi | 2/1.0 (-1) | 1,036 (-7%) | 14mo | $97,500 | $94 | 64 |
| 306 N Green St N | 0.29mi | 3/2.0 | 1,036 (-7%) | 23mo | $115,000 | $111 | 56 |
Match score weights: distance 35% · size 25% · config 20% · recency 20%. Top-matched comps best support the ARV.
Projected returns pro-forma
-3.0% appreciation · 3.0% rent growth · sell at horizon
- IRR
- -12.5%
- Equity multiple
- 0.55×
- Total profit
- $-15,662
- Equity at exit
- $18,489
- IRR
- -3.5%
- Equity multiple
- 0.77×
- Total profit
- $-8,083
- Equity at exit
- $10,721
Cash invested: $34,720 (down + closing). Projections, not guarantees.
Landlord ↔ Tenant lean methodology
- Overall (STATE)
- 90 Strongly Landlord-Friendly
- State Louisiana
- 90 Strongly Landlord-Friendly · R+12
- County
- — inherits STATE
- City
- — inherits STATE
ZIP-level market 70633
- Active inventory
- 107
- Price-to-rent
- 10.0×
Monthly cashflow live
- Estimated rent
- $1,030 medium interval (Pro) →
- Mortgage (P&I)
- −$650
- Tax from tax record
- −$41 /mo · $496/yr
- Insurance
- −$52
- HOA
- −$0
- Vacancy / Maint / Mgmt
- −$216
- Net cashflow
- $70
Break-even live
Sensitivity live
| Price | -10% $141 | -5% $106 | +0% $70 | +5% $35 | +10% $0 |
|---|---|---|---|---|---|
| Rent | -10% $-11 | -5% $30 | +0% $70 | +5% $111 | +10% $152 |
| Rate | -1.0pp $133 | -0.5pp $102 | base $70 | +0.5pp $38 | +1.0pp $6 |
UW: 25.0% down · 7.5% · 30yr · 1.5% tax · 5.0% vac · 8.0% maint · 8.0% mgmt
Financing live
Cash to close
- Down payment
- $31,000
- Closing costs
- $3,720
- Reserves months
- —
- Total cash needed
- —
Loan-product check · same deal, 3 products live
Conventional
25% down · 7.5% · 30yr
- Down + closing
- —
- Monthly P&I
- —
- Monthly cashflow
- —
- DSCR
- —
- Eligible?
- —
Personal DTI + credit; lowest rate.
DSCR
20% down · 8.5% · 30yr
- Down + closing
- —
- Monthly P&I
- —
- Monthly cashflow
- —
- DSCR
- —
- Eligible?
- —
No personal income docs; deal must DSCR.
Hard money
10% down · 12.0% · 12mo
- Down + closing
- —
- Monthly P&I
- —
- Monthly cashflow
- —
- DSCR
- —
- Eligible?
- —
Short-term bridge; refi at stabilization.
Listing history 20 events
-
2026-06-17pricestatus $124,000 Pending 13 DOM
-
2026-06-16days on market $119,900 Active 13 DOM
-
2026-06-15days on market $119,900 Active 12 DOM
-
2026-06-14days on market $119,900 Active 10 DOM
-
2026-06-13days on market $119,900 Active 9 DOM
-
2026-06-10days on market $119,900 Active 7 DOM
-
2026-06-09days on market $119,900 Active 6 DOM
-
2026-06-08days on market $119,900 Active 5 DOM
-
2026-06-07days on market $119,900 Active 4 DOM
-
2026-06-05pricedays on market $119,900 Active 1 DOM
-
2026-06-01days on market $124,500 Active 559 DOM
-
2026-05-31days on market $124,500 Active 178 DOM
-
2026-05-30days on market $124,500 Active 177 DOM
-
2025-12-04status Active 401-char remark
-
2025-12-04price $124,500 401-char remark
-
2025-12-04$124,500 Active 401-char remark
-
2025-06-03status Active 401-char remark
-
2025-06-01historical 401-char remark
-
2024-11-13$125,000 Active 401-char remark
-
2002-04-22soldstatus $3,500
ⓘ Source: listings_history table (triggers on properties + properties_extension) + one-shot
backfill from property_details.listing_events for pre-trigger history.
Tax reassessment forecast LA · Resets to sale price
- Current annual tax
- $496 · $41/mo
- Projected year-2 tax
- $682 · $57/mo
- Expected delta
- +$186/yr (+$16/mo · 37.5%)
ⓘ Screening estimate from a state-policy table — verify with the county assessor before closing.
Climate risk First Street
- Flood 1/10 Low FEMA zone X (unshaded) · 0% chance over 30 yrs
- Wildfire 3/10 Moderate
- Heat 9/10 Extreme 7 d/yr ≥110°F today · 23 d/yr by 30 yrs out
- Wind 9/10 Extreme 99% chance of damaging wind over 30 yrs
- Air quality 2/10 Low 1 unhealthy d/yr today · 1 by 30 yrs out
Nearby sold comps map
Loading sold comps map…
Walkable amenities ~0.75 mi
Loading nearby amenities…
Taxation est. · year 1
- Rental income
- $12,360
- − Mortgage interest
- −$6,946
- − Property taxes
- −$496
- − Insurance
- −$620
- − Repairs & maintenance
- −$989
- − Management
- −$989
- − Depreciation
- −$3,607
- Taxable loss
- −$1,287
- Est. tax savings @ 24.0%
- +$309
- After-tax cash flow
- $1,154/yr
For passive investors: Depreciation is non-cash, so a rental often shows a tax loss while cash-flowing — sheltering income. Rental losses are passive: they offset passive income freely, and up to $25,000/yr can offset ordinary (W-2) income if you actively participate and your MAGI is under $100k (phasing out to $0 by $150k); unused losses carry forward. On sale, claimed depreciation is recaptured at up to 25%, and gains may owe capital-gains tax (a 1031 exchange can defer both). Figures are a year-1 estimate at your 24.0% rate — not tax advice; consult a CPA.
Schools (NCES district)
- District
- Calcasieu Parish
- NCES district ID
- 2200330
- Math proficiency
- 30% ▼ -39.00%
- Reading proficiency
- 44% ▼ -33.00%
- Median HH income
- $44,700
- Composite
- 31.45/100
- National rank
- #5979
- State rank
- #29 of 98 in LA
Livability — DeQuincy
- Score
- 71/100
- State rank
- #51
- US rank
- #7288
Category grades
Schools grade is shown separately in the Schools card above.
Census & demographics
- Census place
- DeQuincy, LA
- Population (ZIP)
- 8,178
Population outlook (Calcasieu County) Hauer SSP2
- Today (2025)
- 212,179 people
- By 2030
- 218,199 · +2.8%
- By 2040
- 228,486 · +7.7%
- By 2050
- 236,208 · +11.3%
- By 2075
- 251,696 · +18.6%
- By 2100
- 247,848 · +16.8%
Race, ethnicity, and origin ACS 2023
- Neighborhood character
- Predominantly White (82%)
- Race & ethnicity
- White 82% Black 9% Two or more races 8% Hispanic / Latino 4%
- Common ancestry
- Lithuanian 6% Italian 2% Iranian 2%
- Foreign-born
- 1%
- Languages at home
- 98% English-only · Spanish 1% French/Haitian/Cajun 1%
Political lean MEDSL · Calcasieu
- 2024 margin
- Solid R (+39.6) · D 29.5% · R 69.0% · Other 1.5%
- 2008→2024 swing
- -15.0pp toward R · 2008: -24.6pp · 2024: -39.6pp
- All cycles
- 2024: R+39.6 2020: R+35.2 2016: R+33.3 2012: R+28.7 2008: R+24.6
Not yet ingested
- Civics
- —
Market trends
- HPI YoY
- ▼ -68.41%
- Current HPI
- 90.4407
- Rent YoY
- —
- Metro
- —
- State GDP YoY
- ▲ 3.29%
- F500 in state
- 10
Industry mix (Fortune 500 HQ in LA)
| Industry | F500 HQs | Revenue |
|---|---|---|
| Telecommunications | 2 | $23B |
|
||
| Utilities | 1 | $12B |
|
||
| Wholesale / Distribution | 1 | $5B |
|
||
| Advertising | 1 | $2B |
|
||
Price history
+3442.9% since first listed5 events — show timeline
- 2026-06-16 Pending — SWLAR
- 2026-06-16 Price Changed $124,000 SWLAR
- 2026-06-03 Listed $119,900 SWLAR
- 2025-12-04 Price Changed $124,500 GFPAR
- 2002-04-22 Sold (Public Records) $3,500 Public Records
Property tax history
-0.4%/yrLatest (2025): $496 · +1.5% YoY. Source: county tax records.
Cash-flow waterfall
monthlySold comps — $/sqft
last 12 mo · ≤1 miLoading sold comps…